



22%
Growth in Account Increase in Trade Execution Efficiency
19%
Improvement in Risk Assessment Accuracy
54%
Enhancement in Usability and Data Accessibility
25%
Reduction in Time Spent on Data Interpretationt
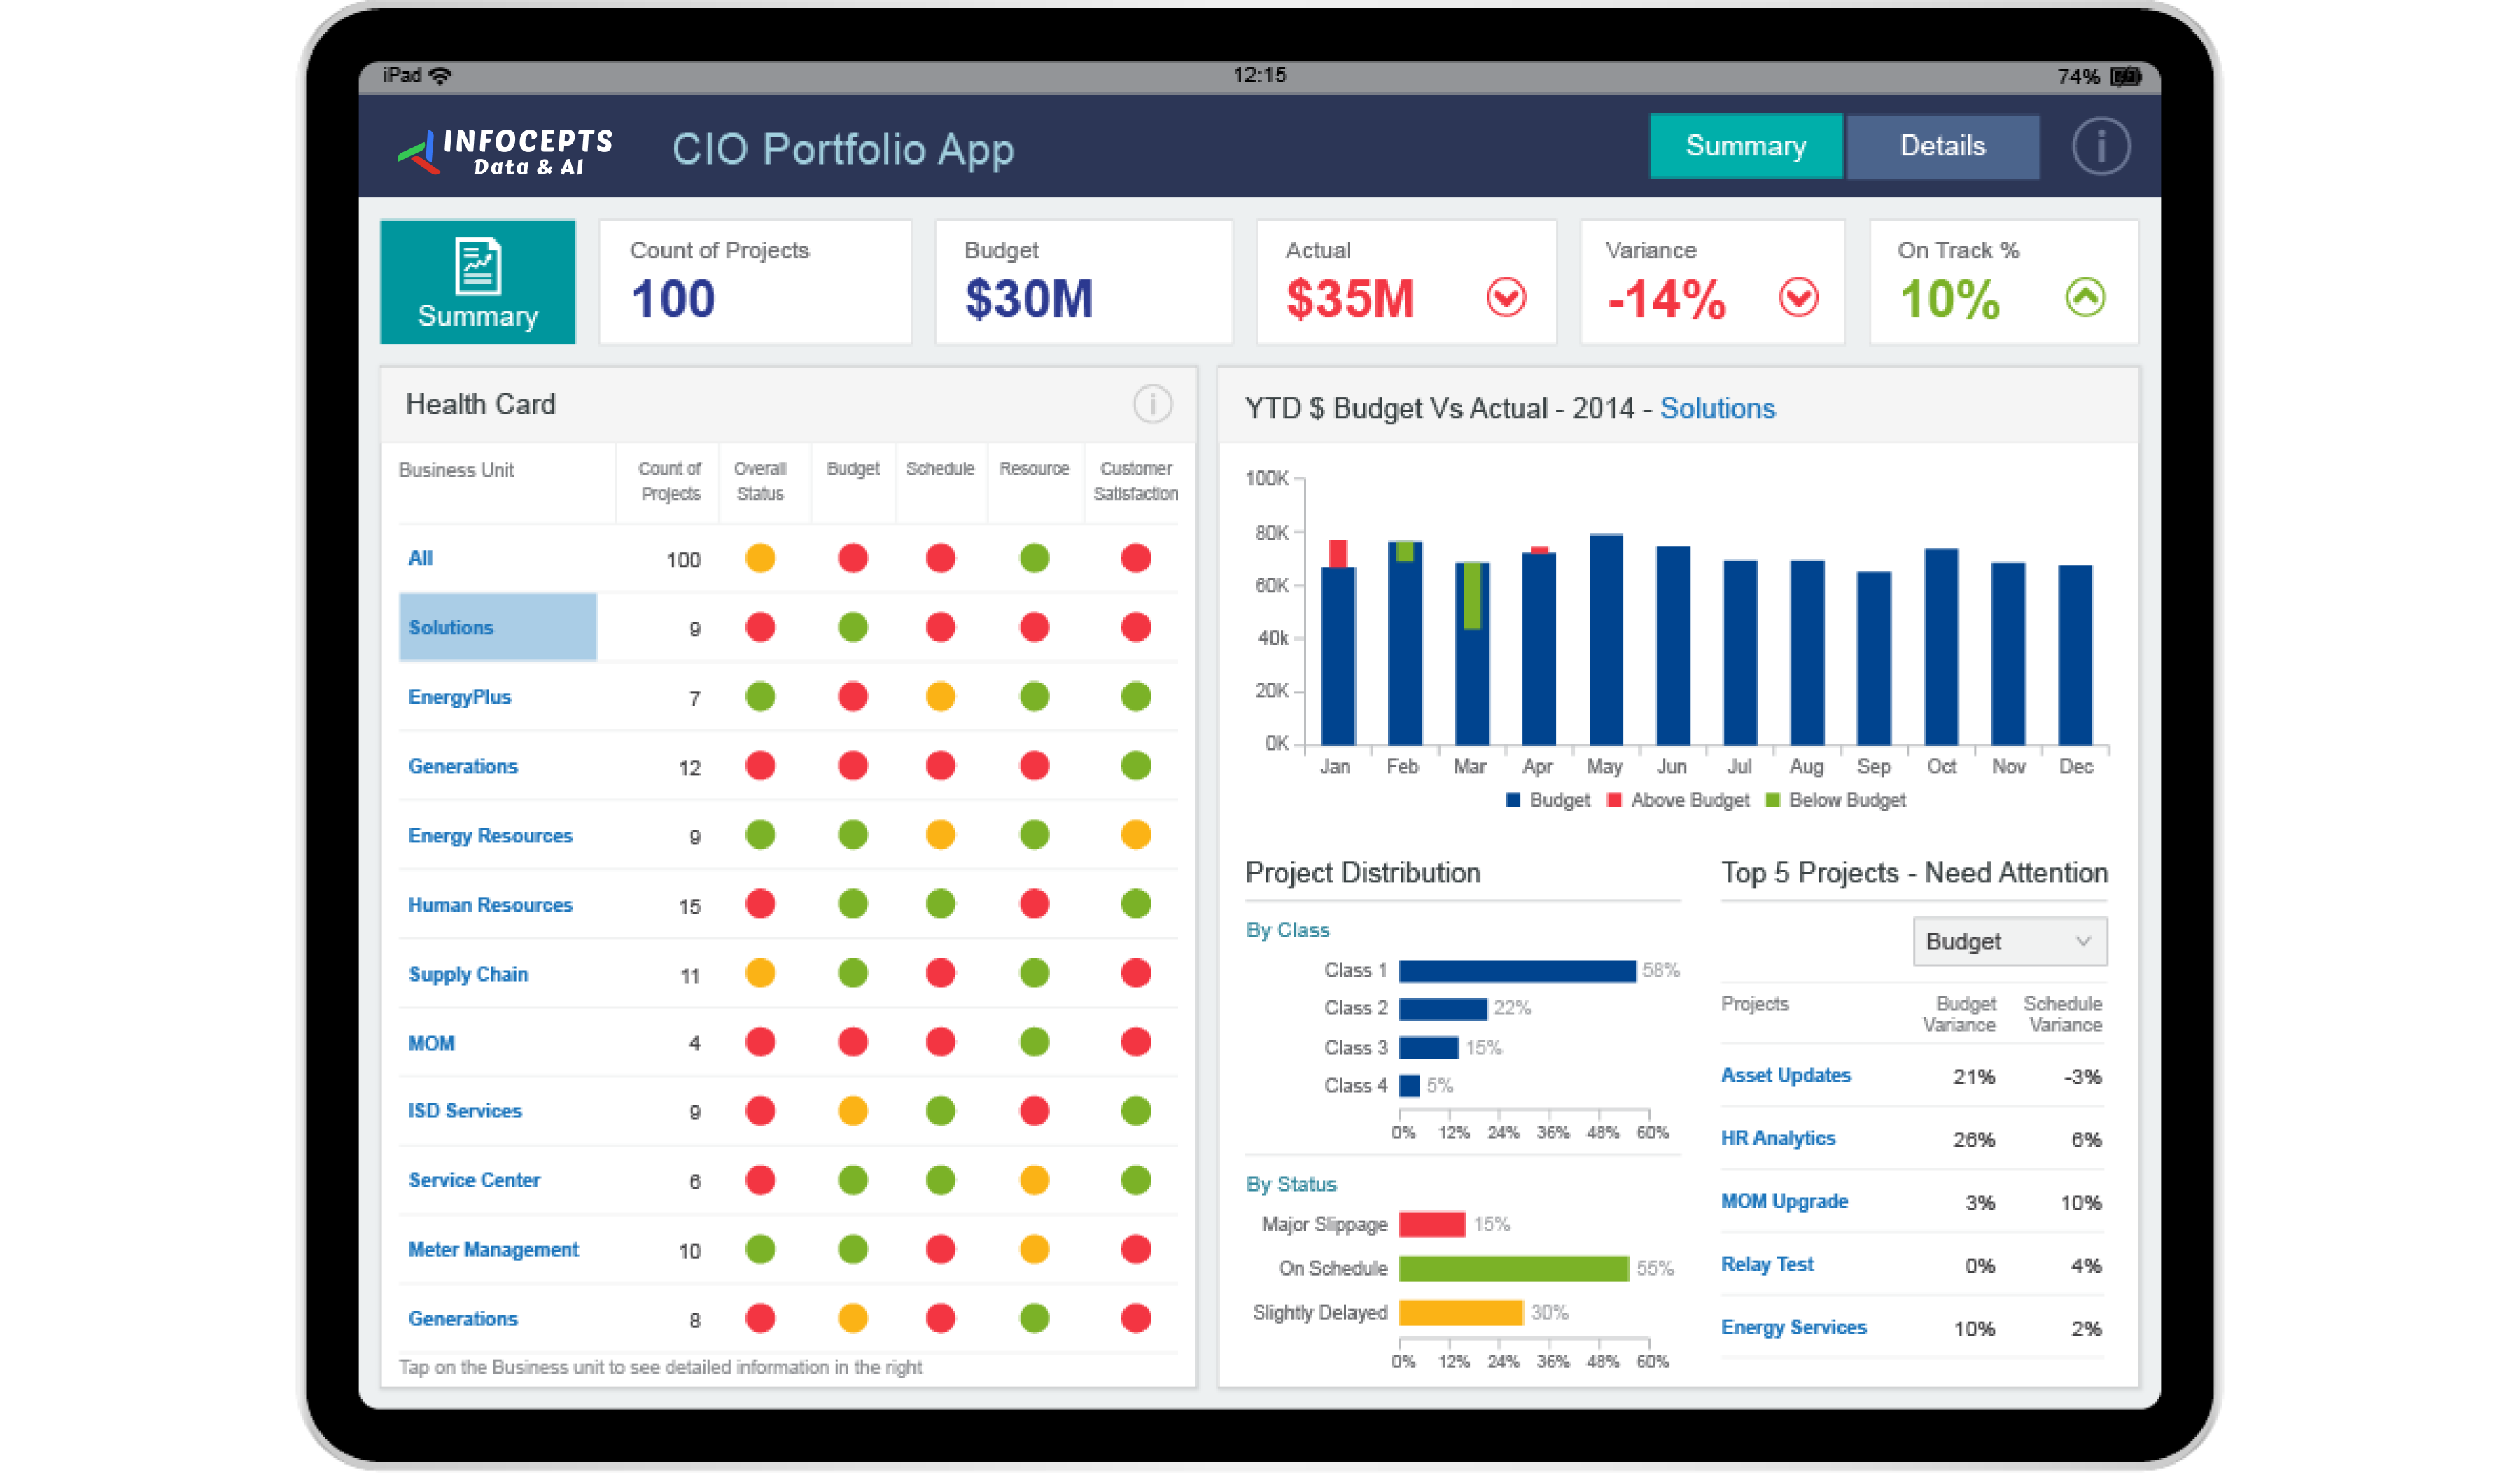
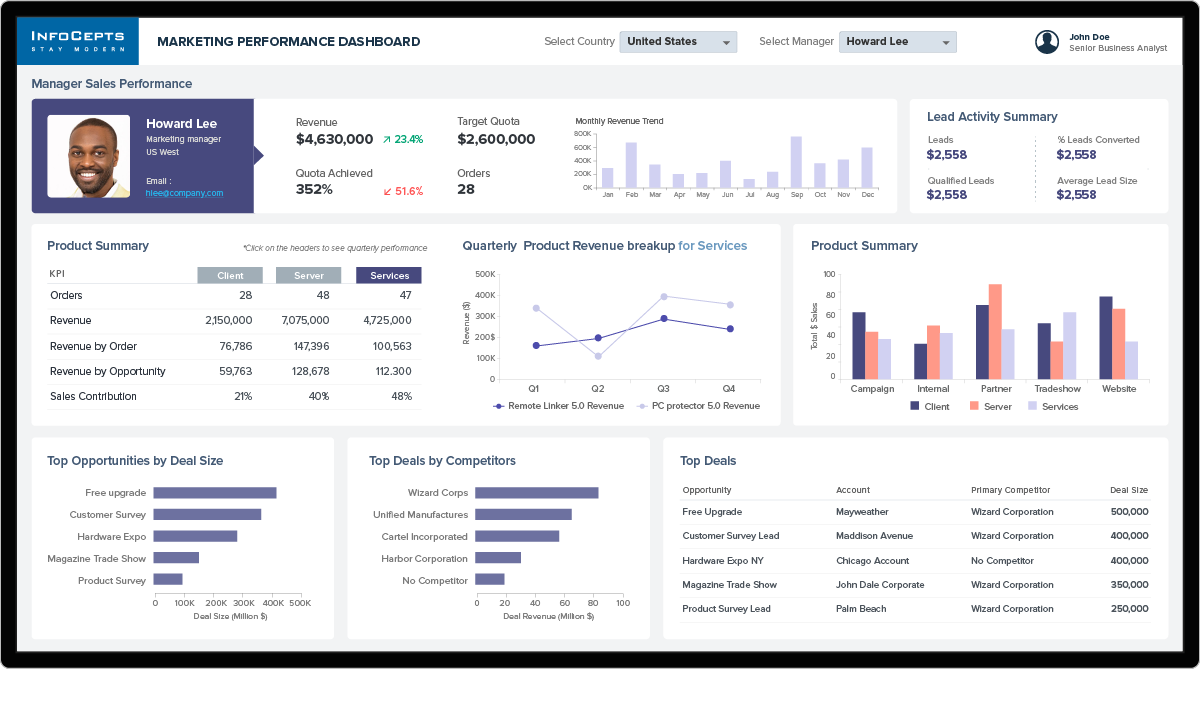
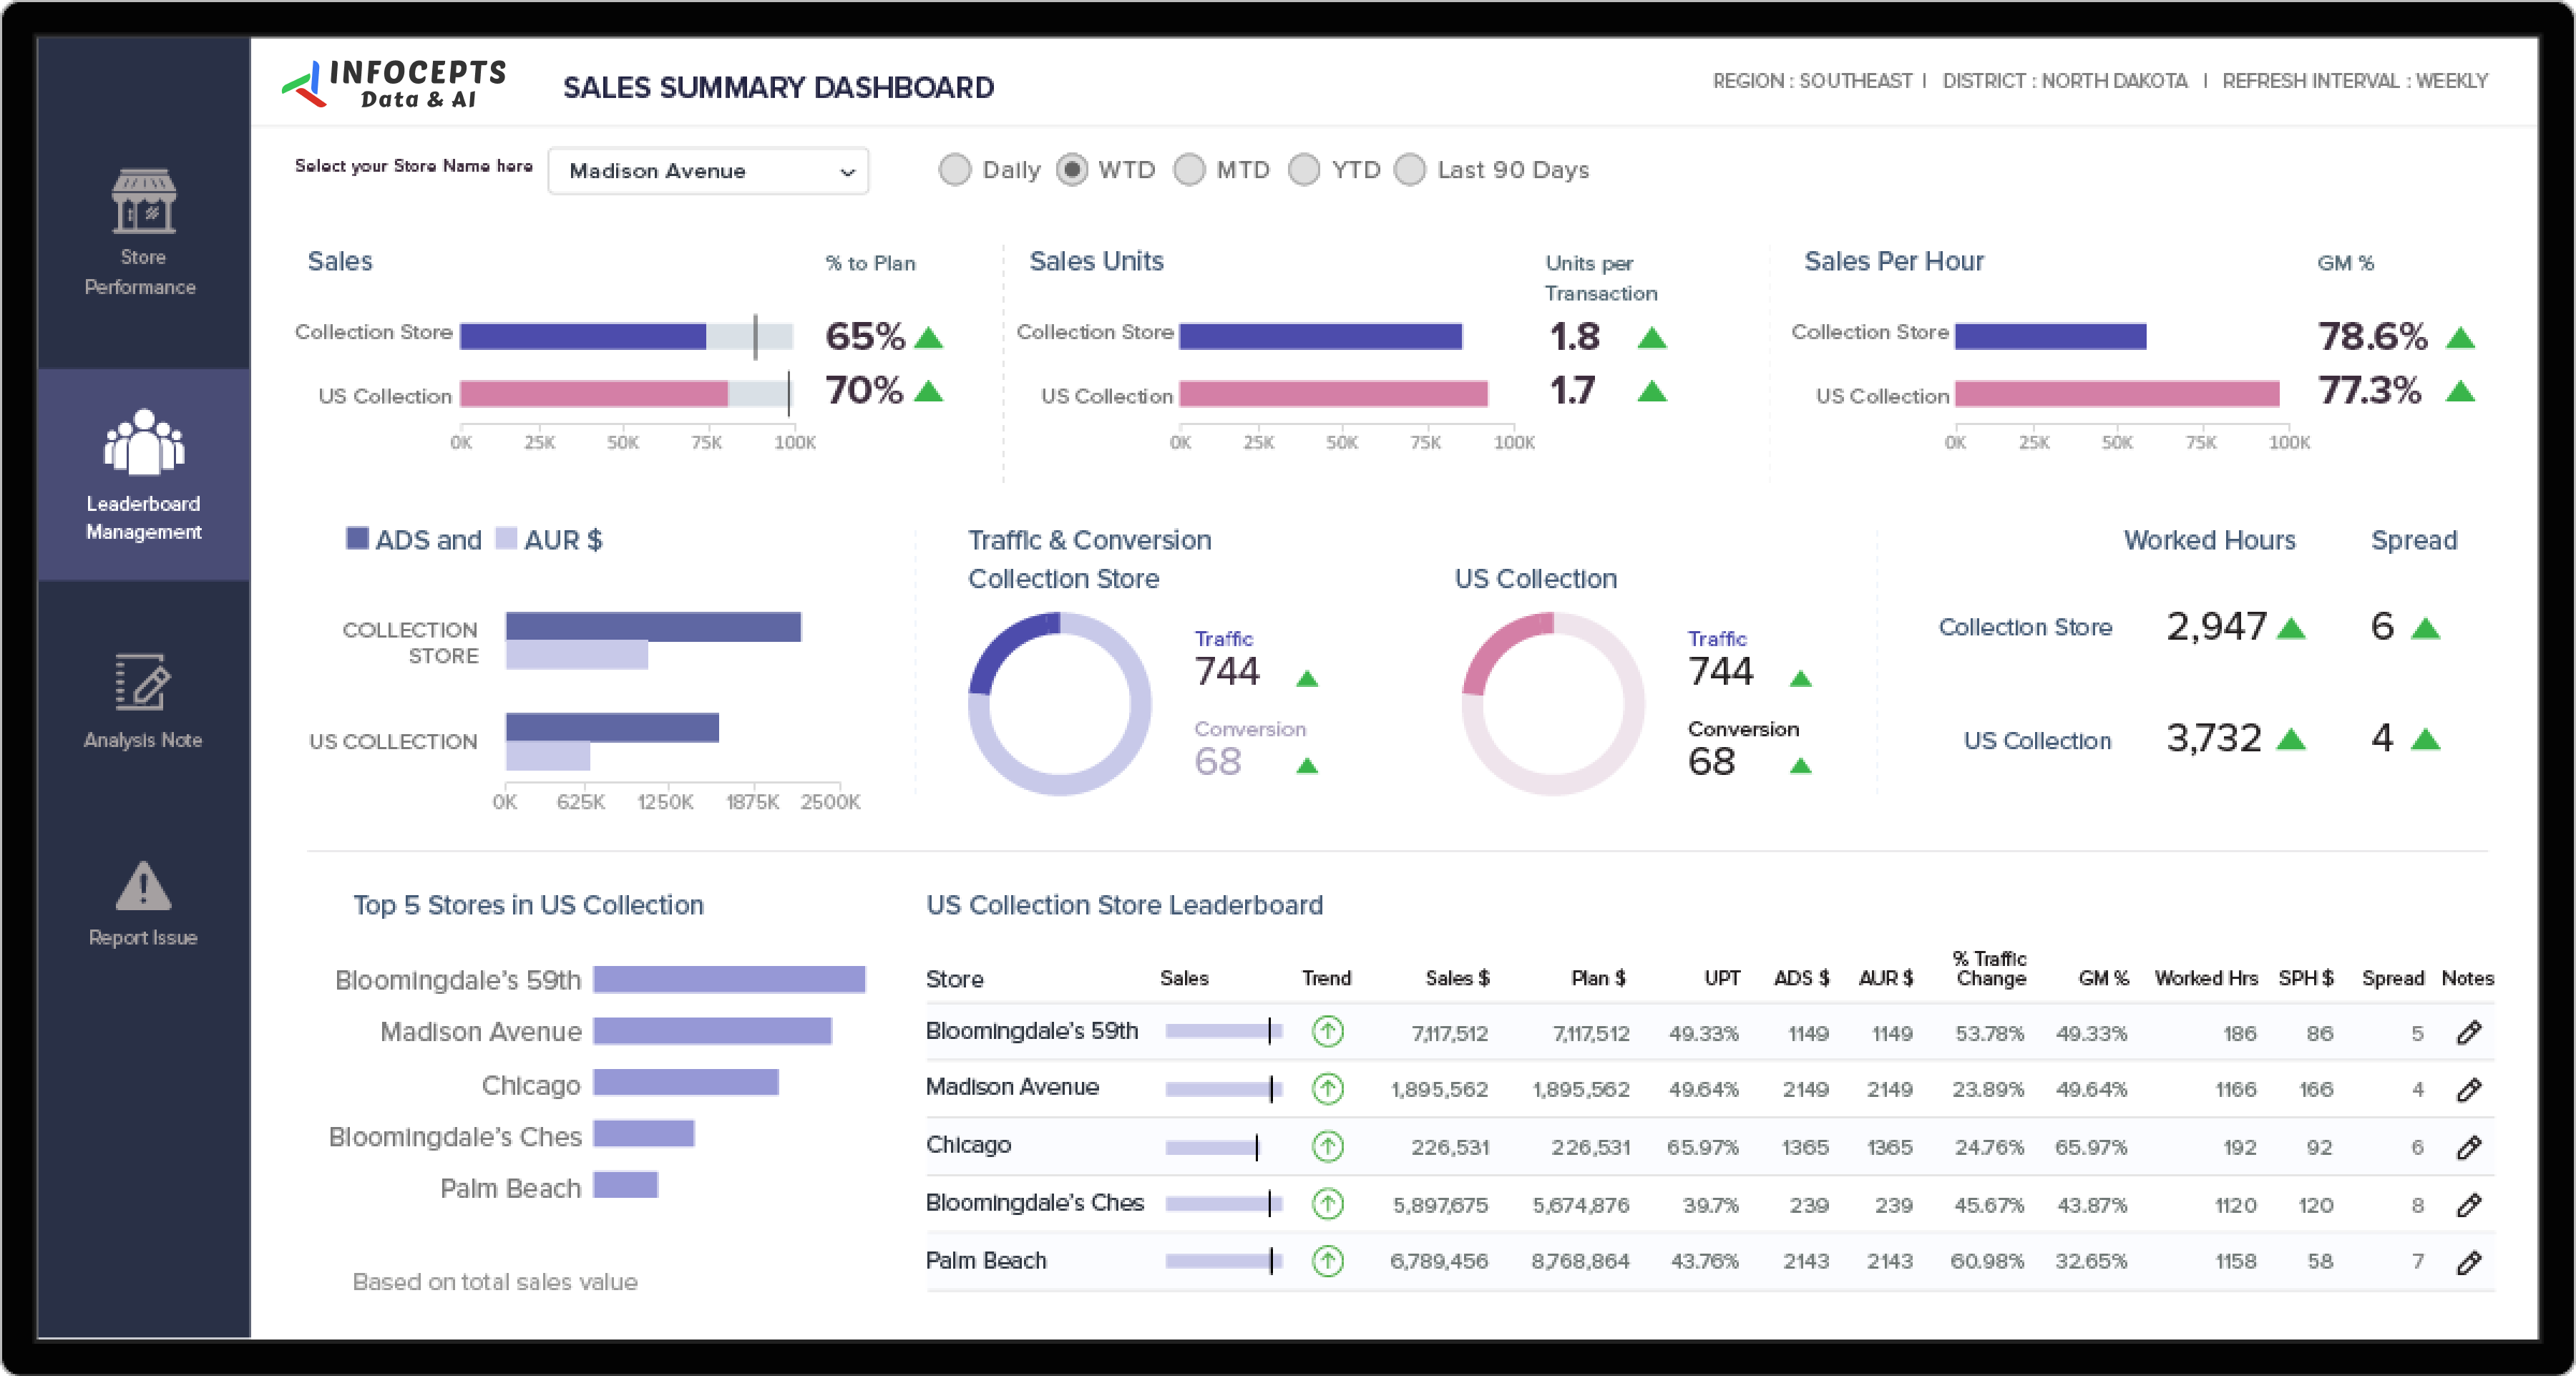
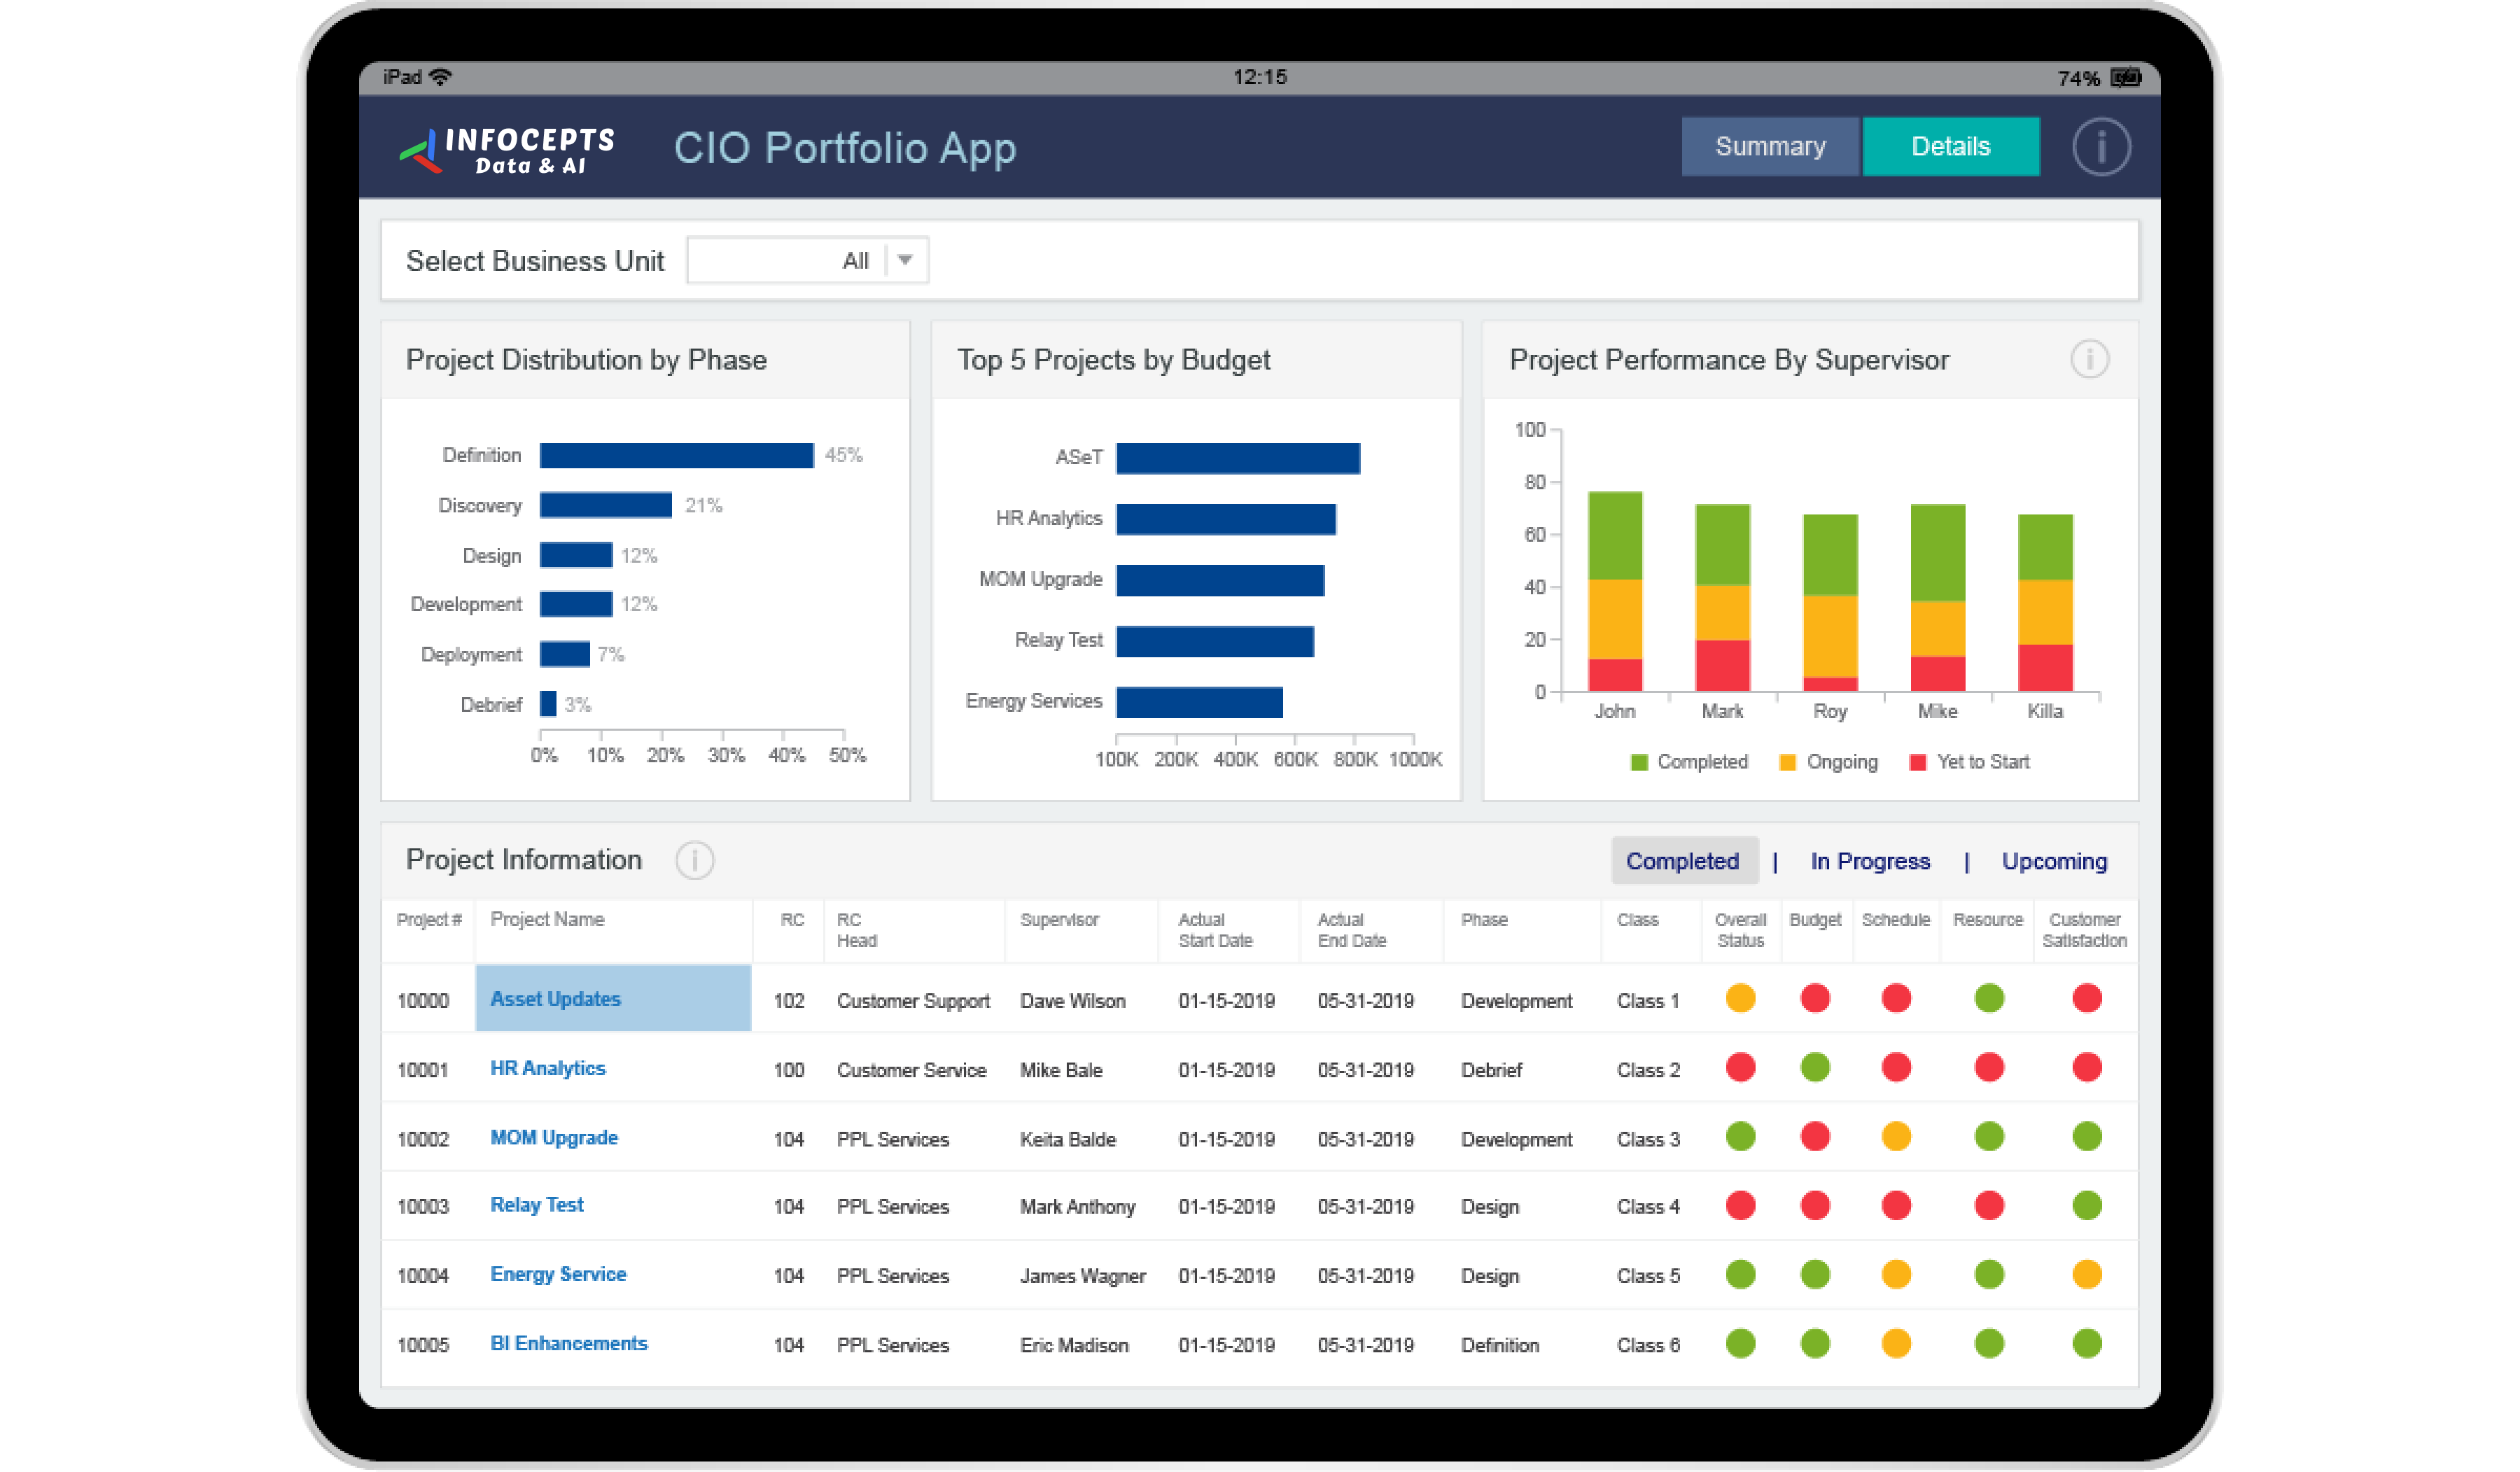
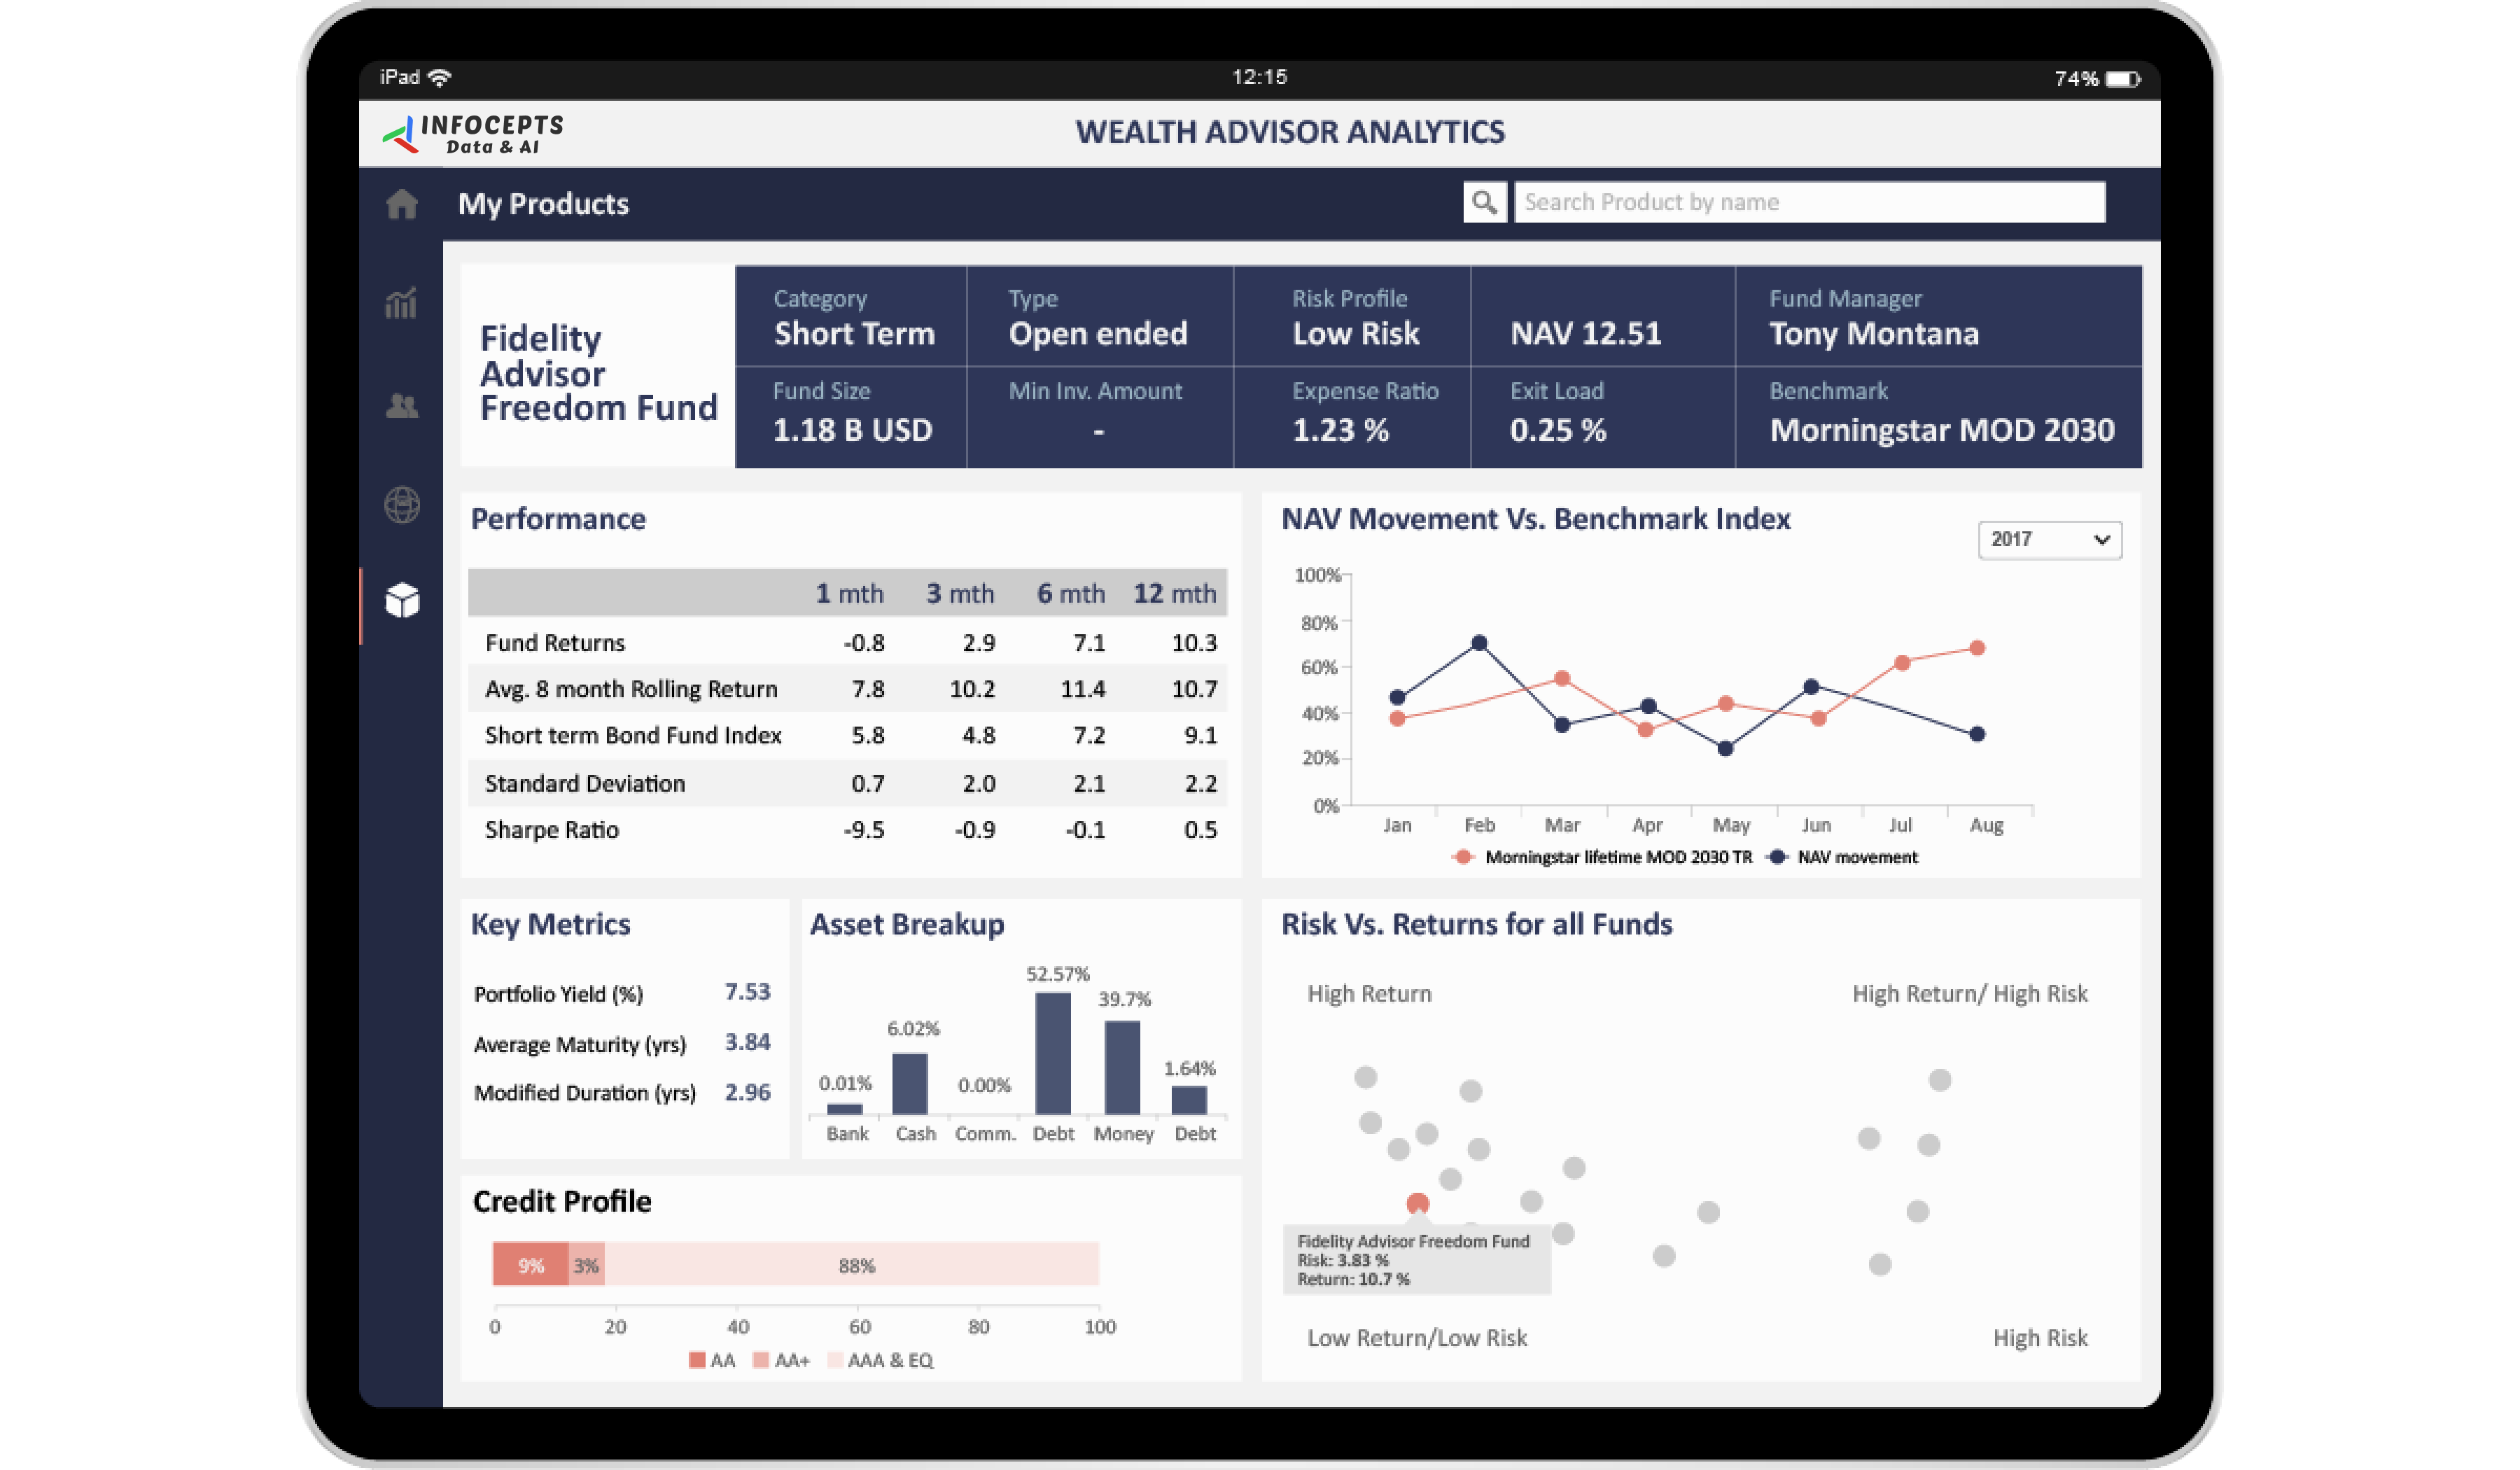
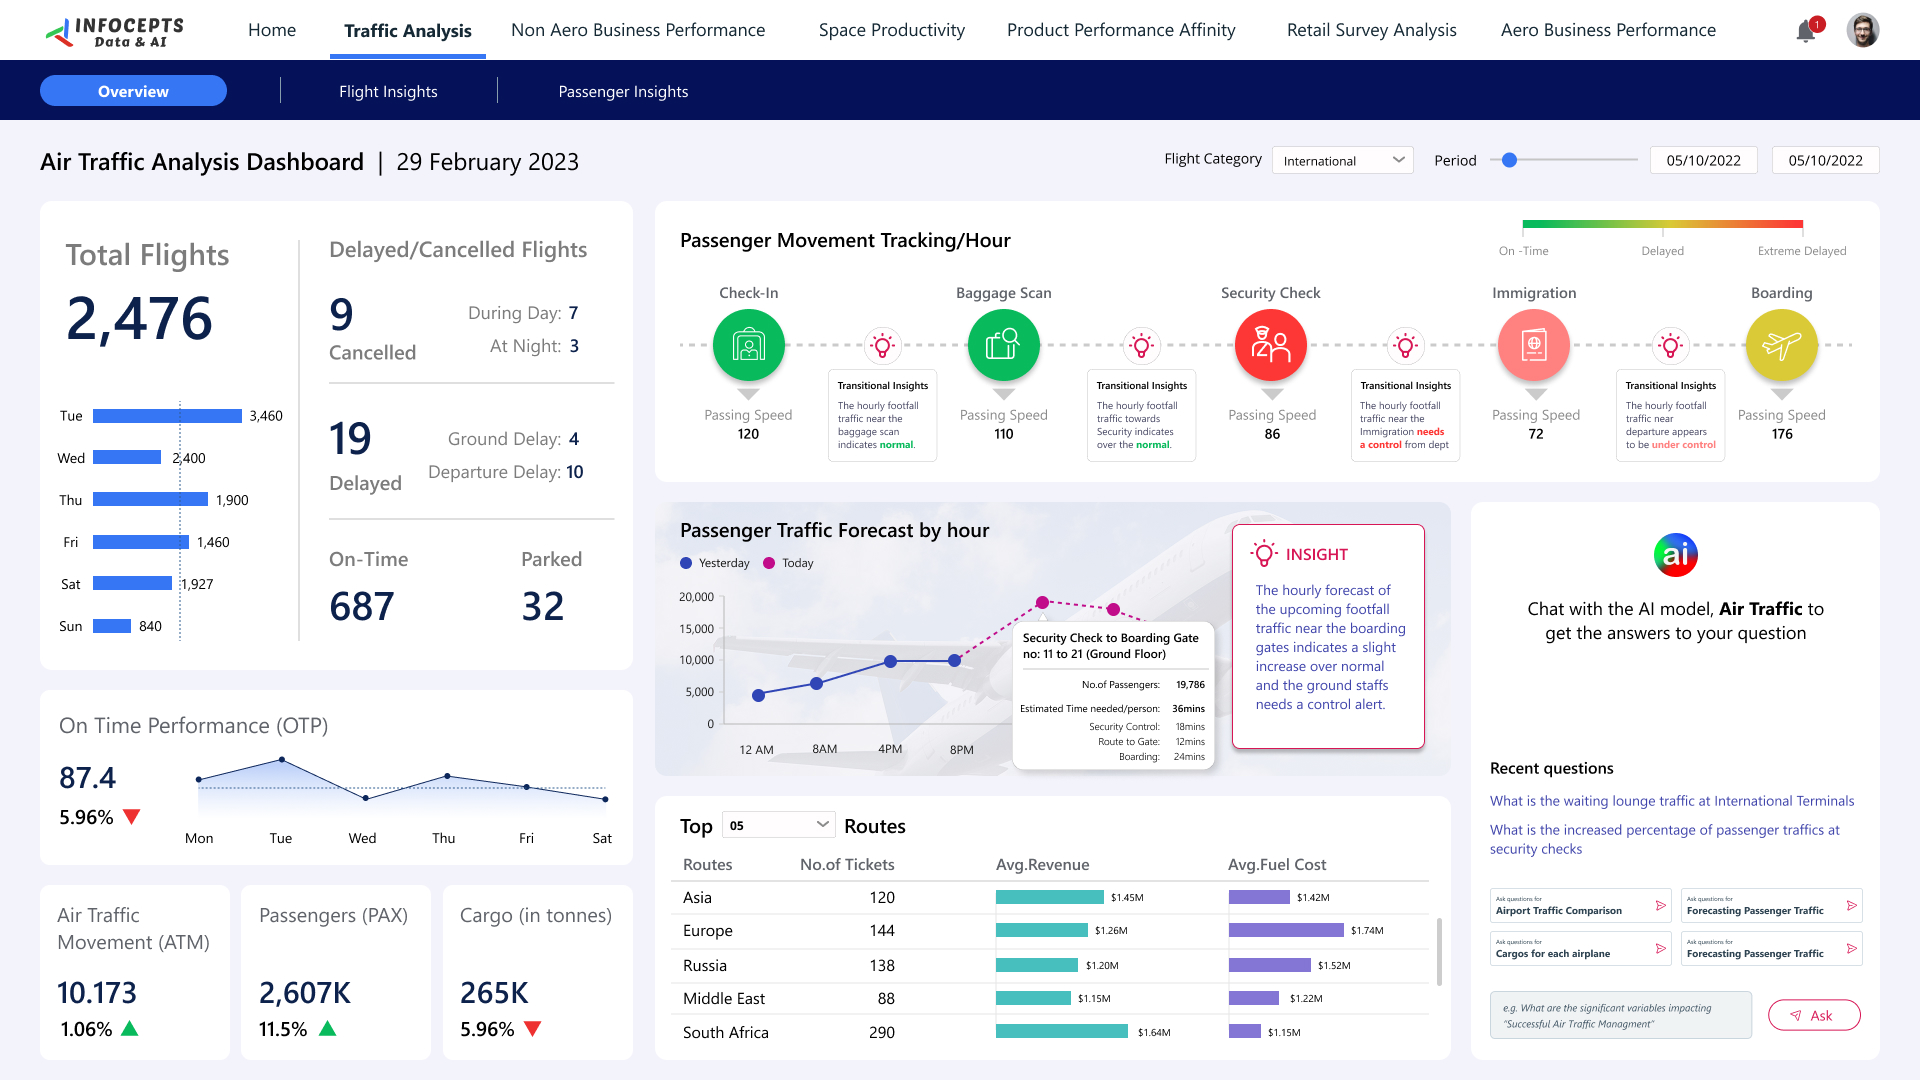
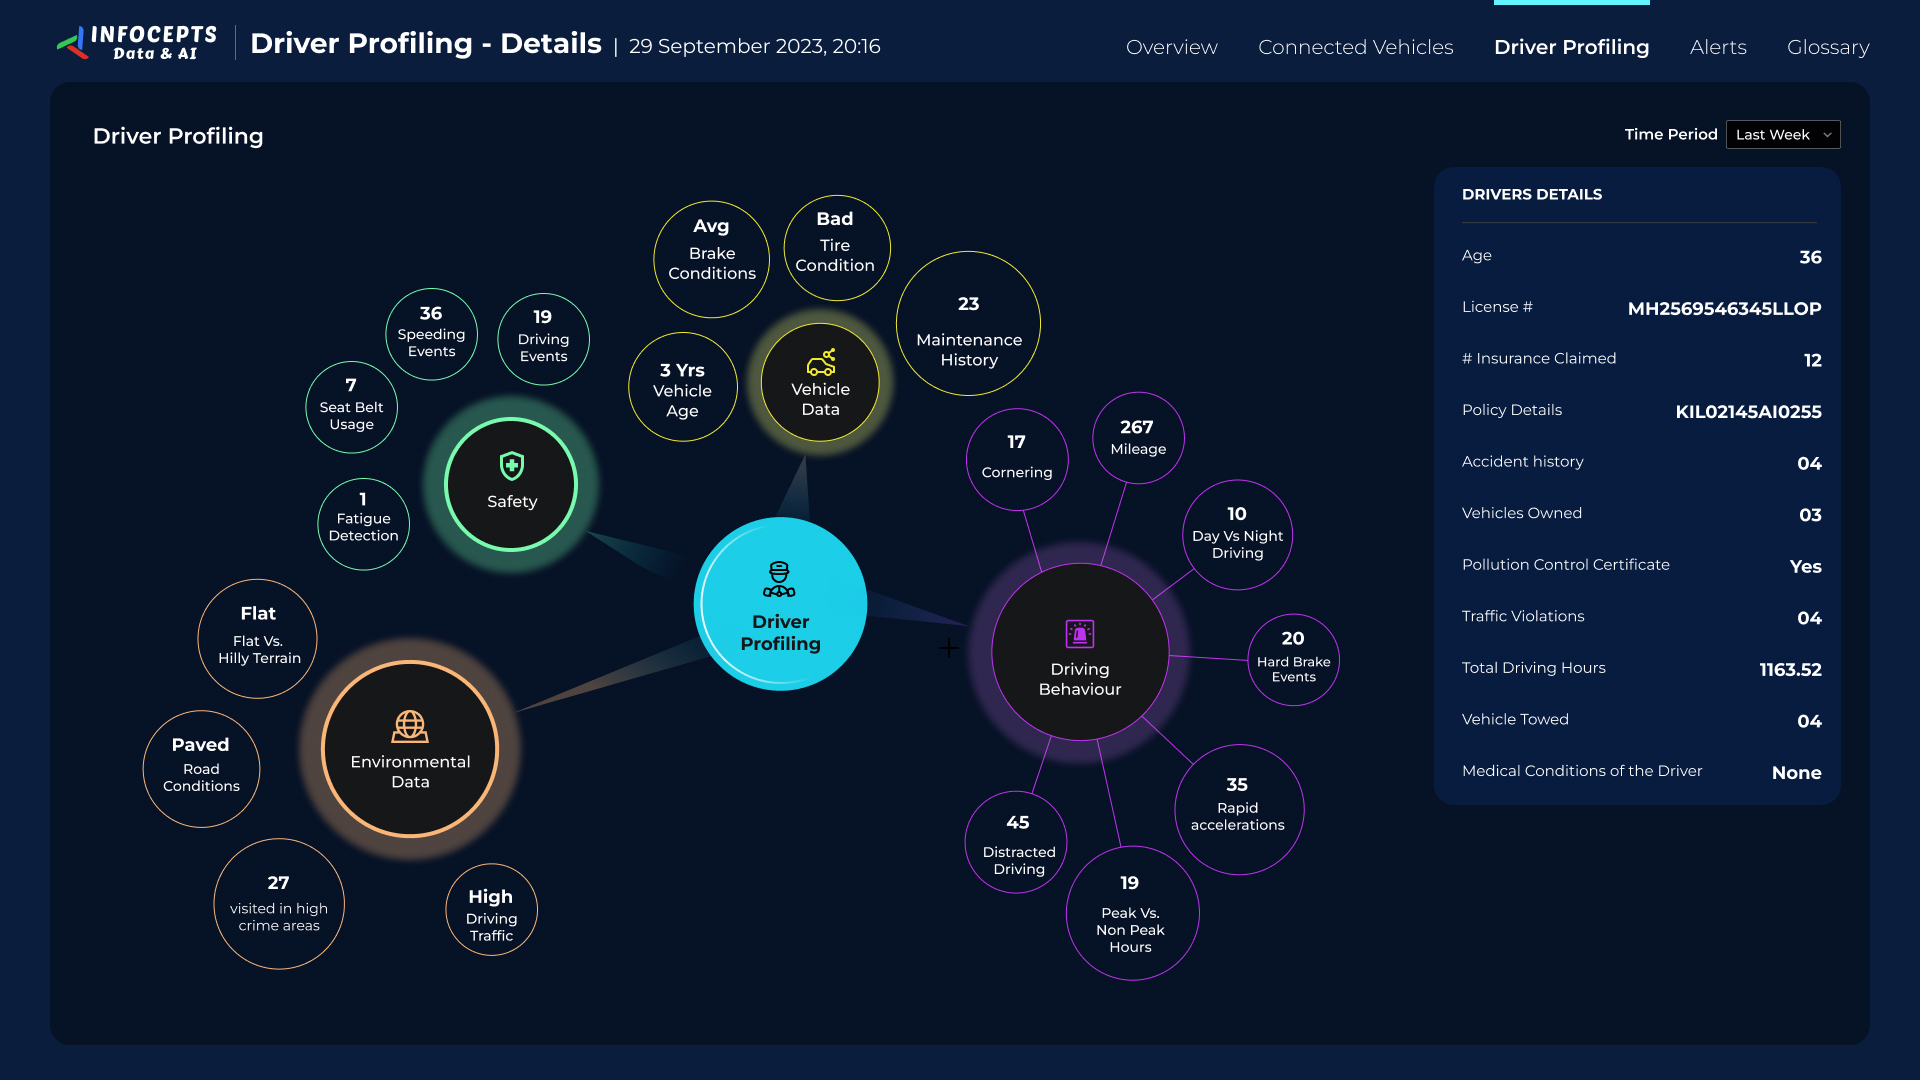
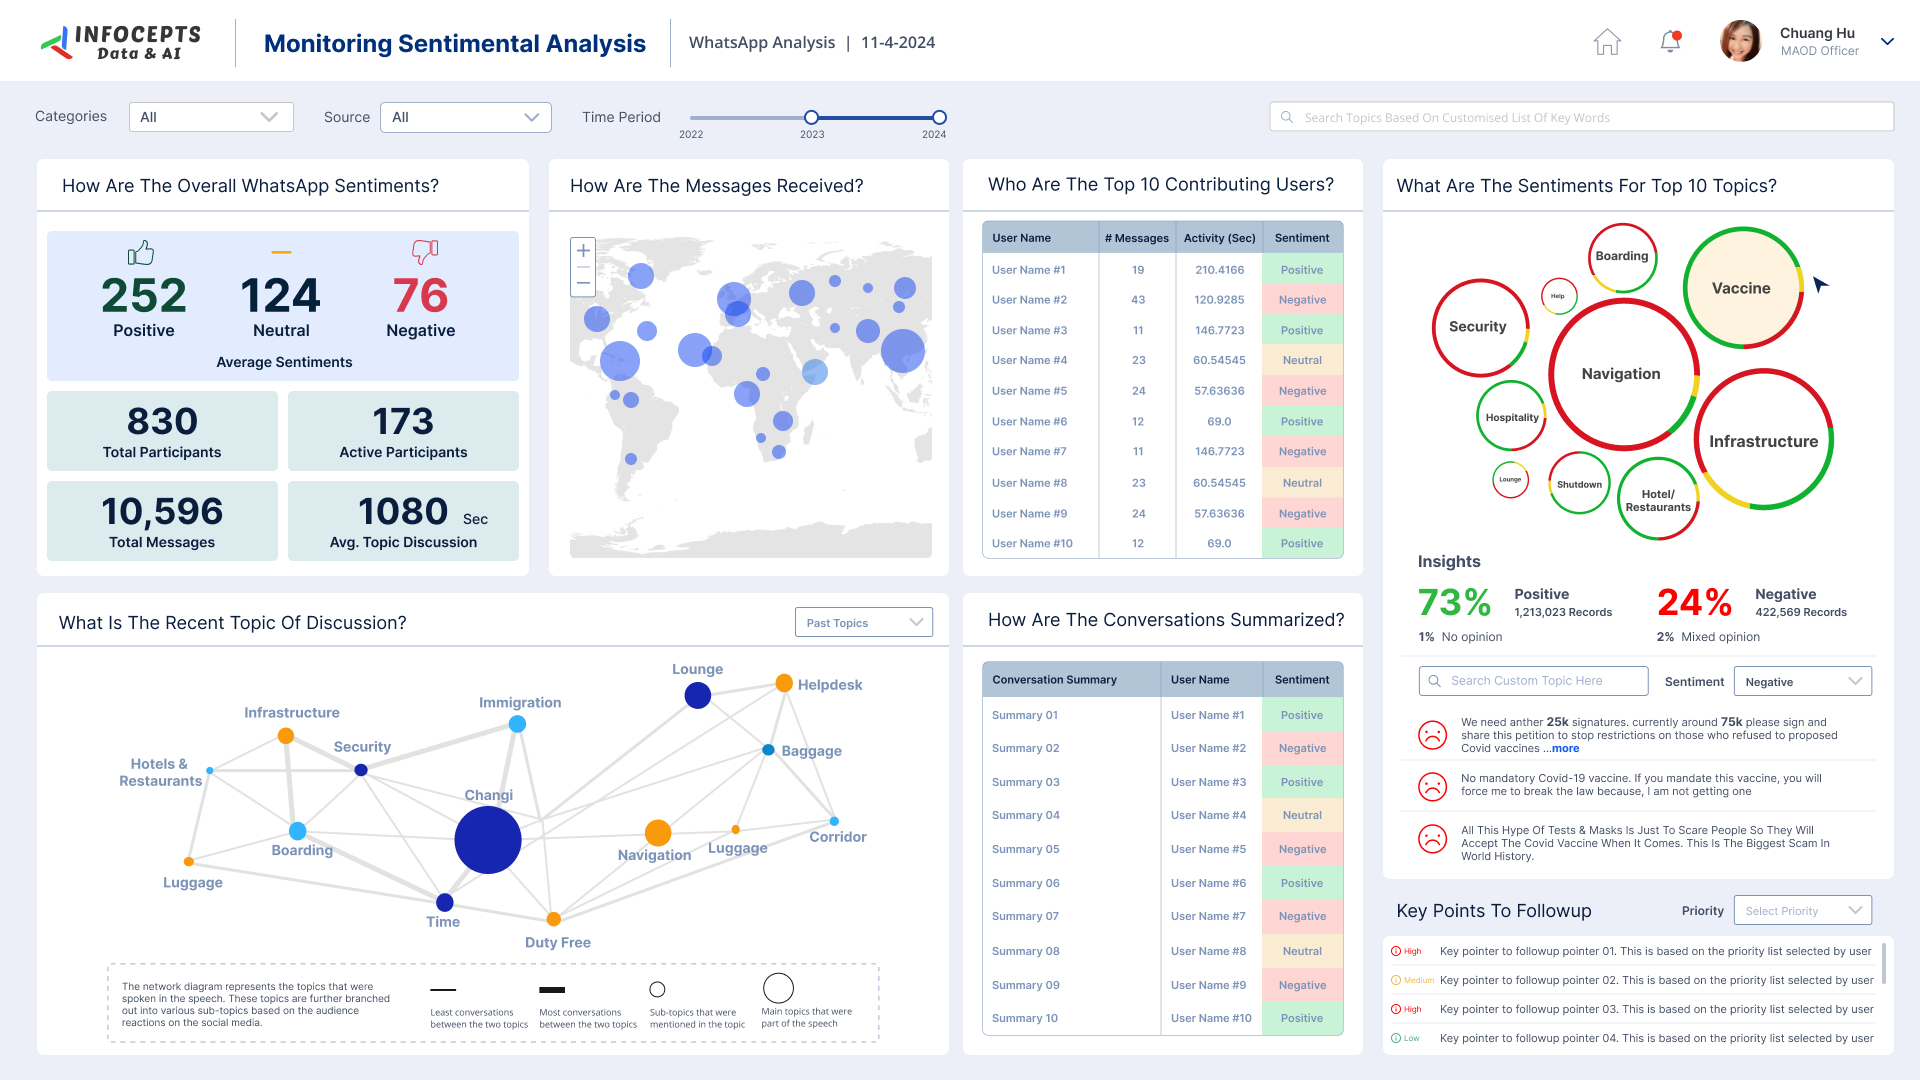
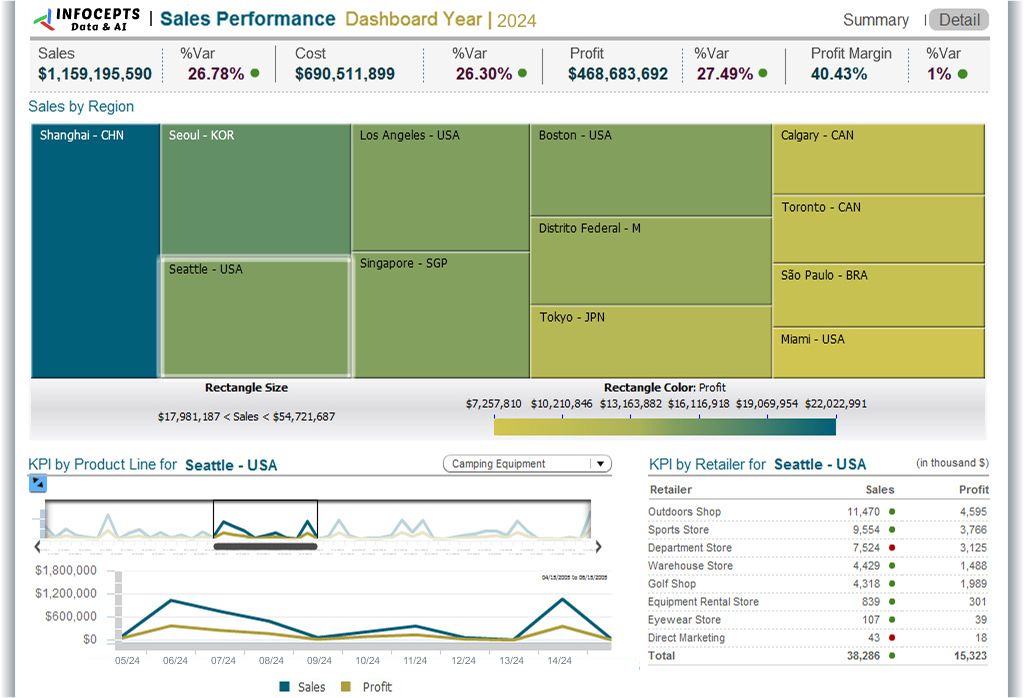
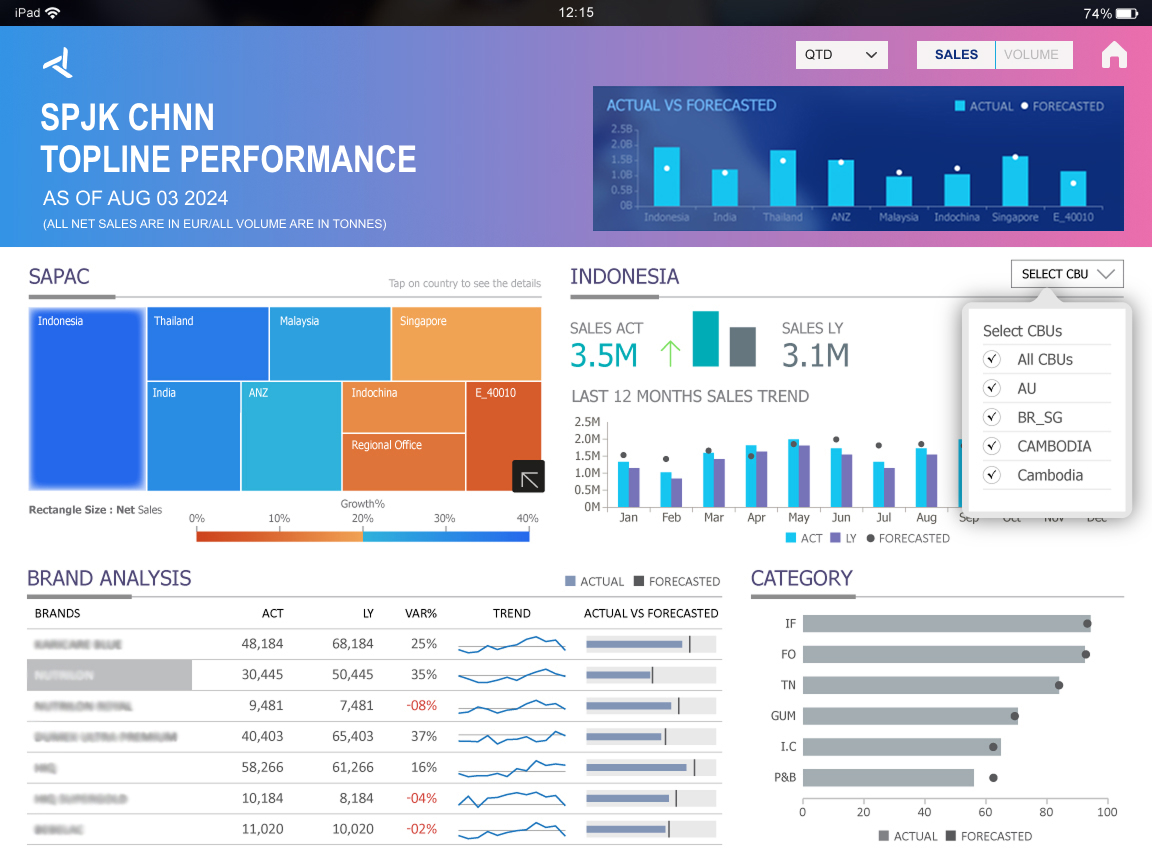
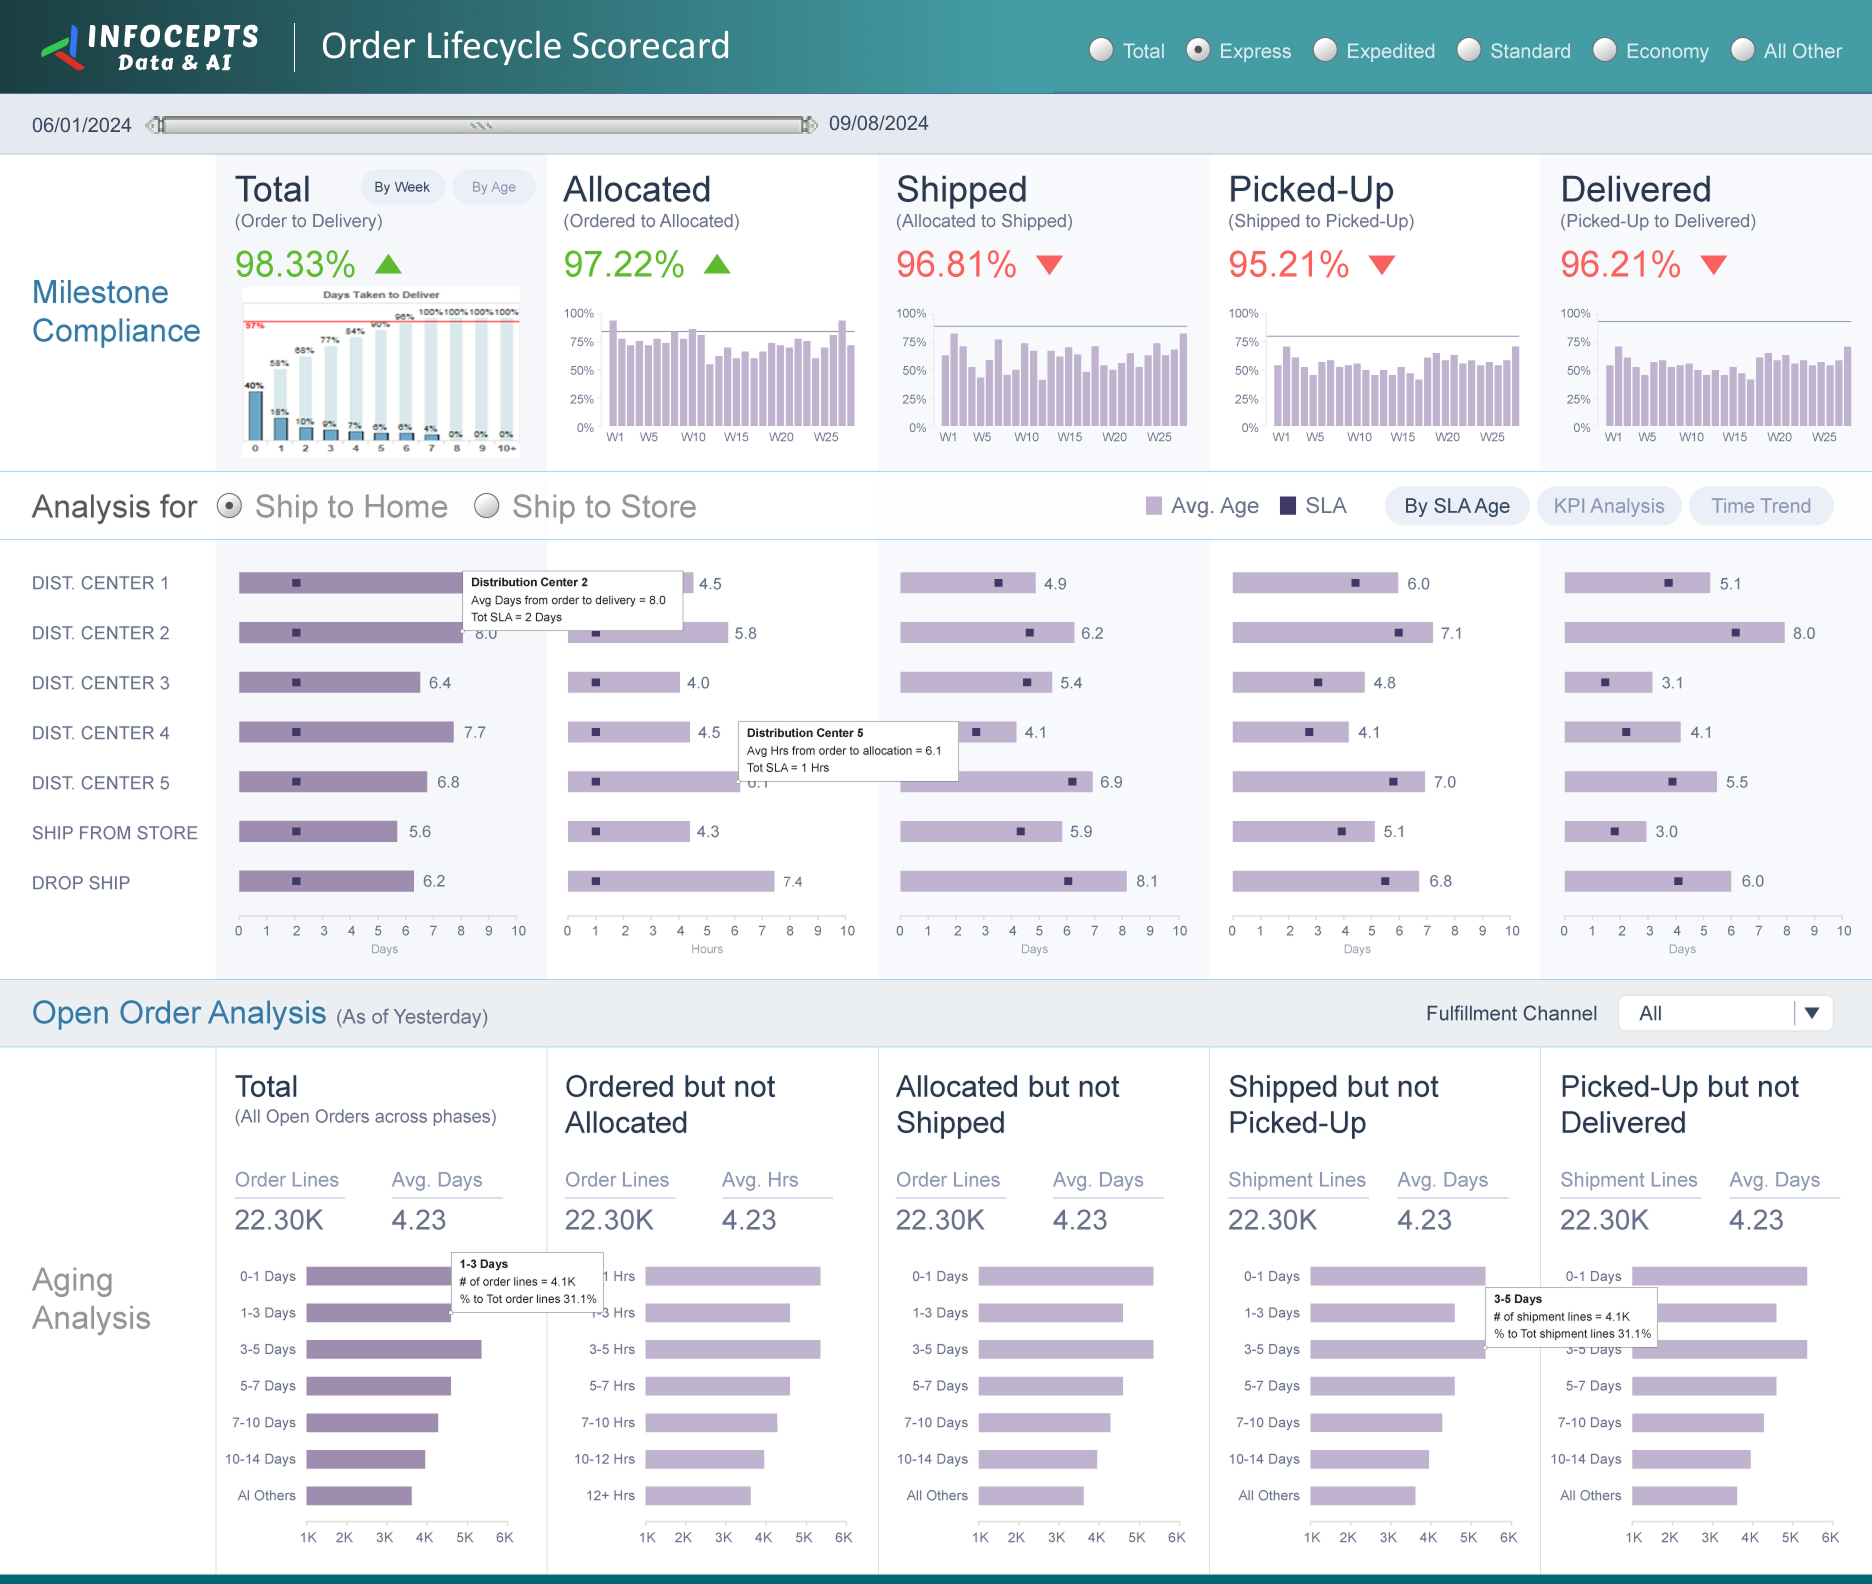
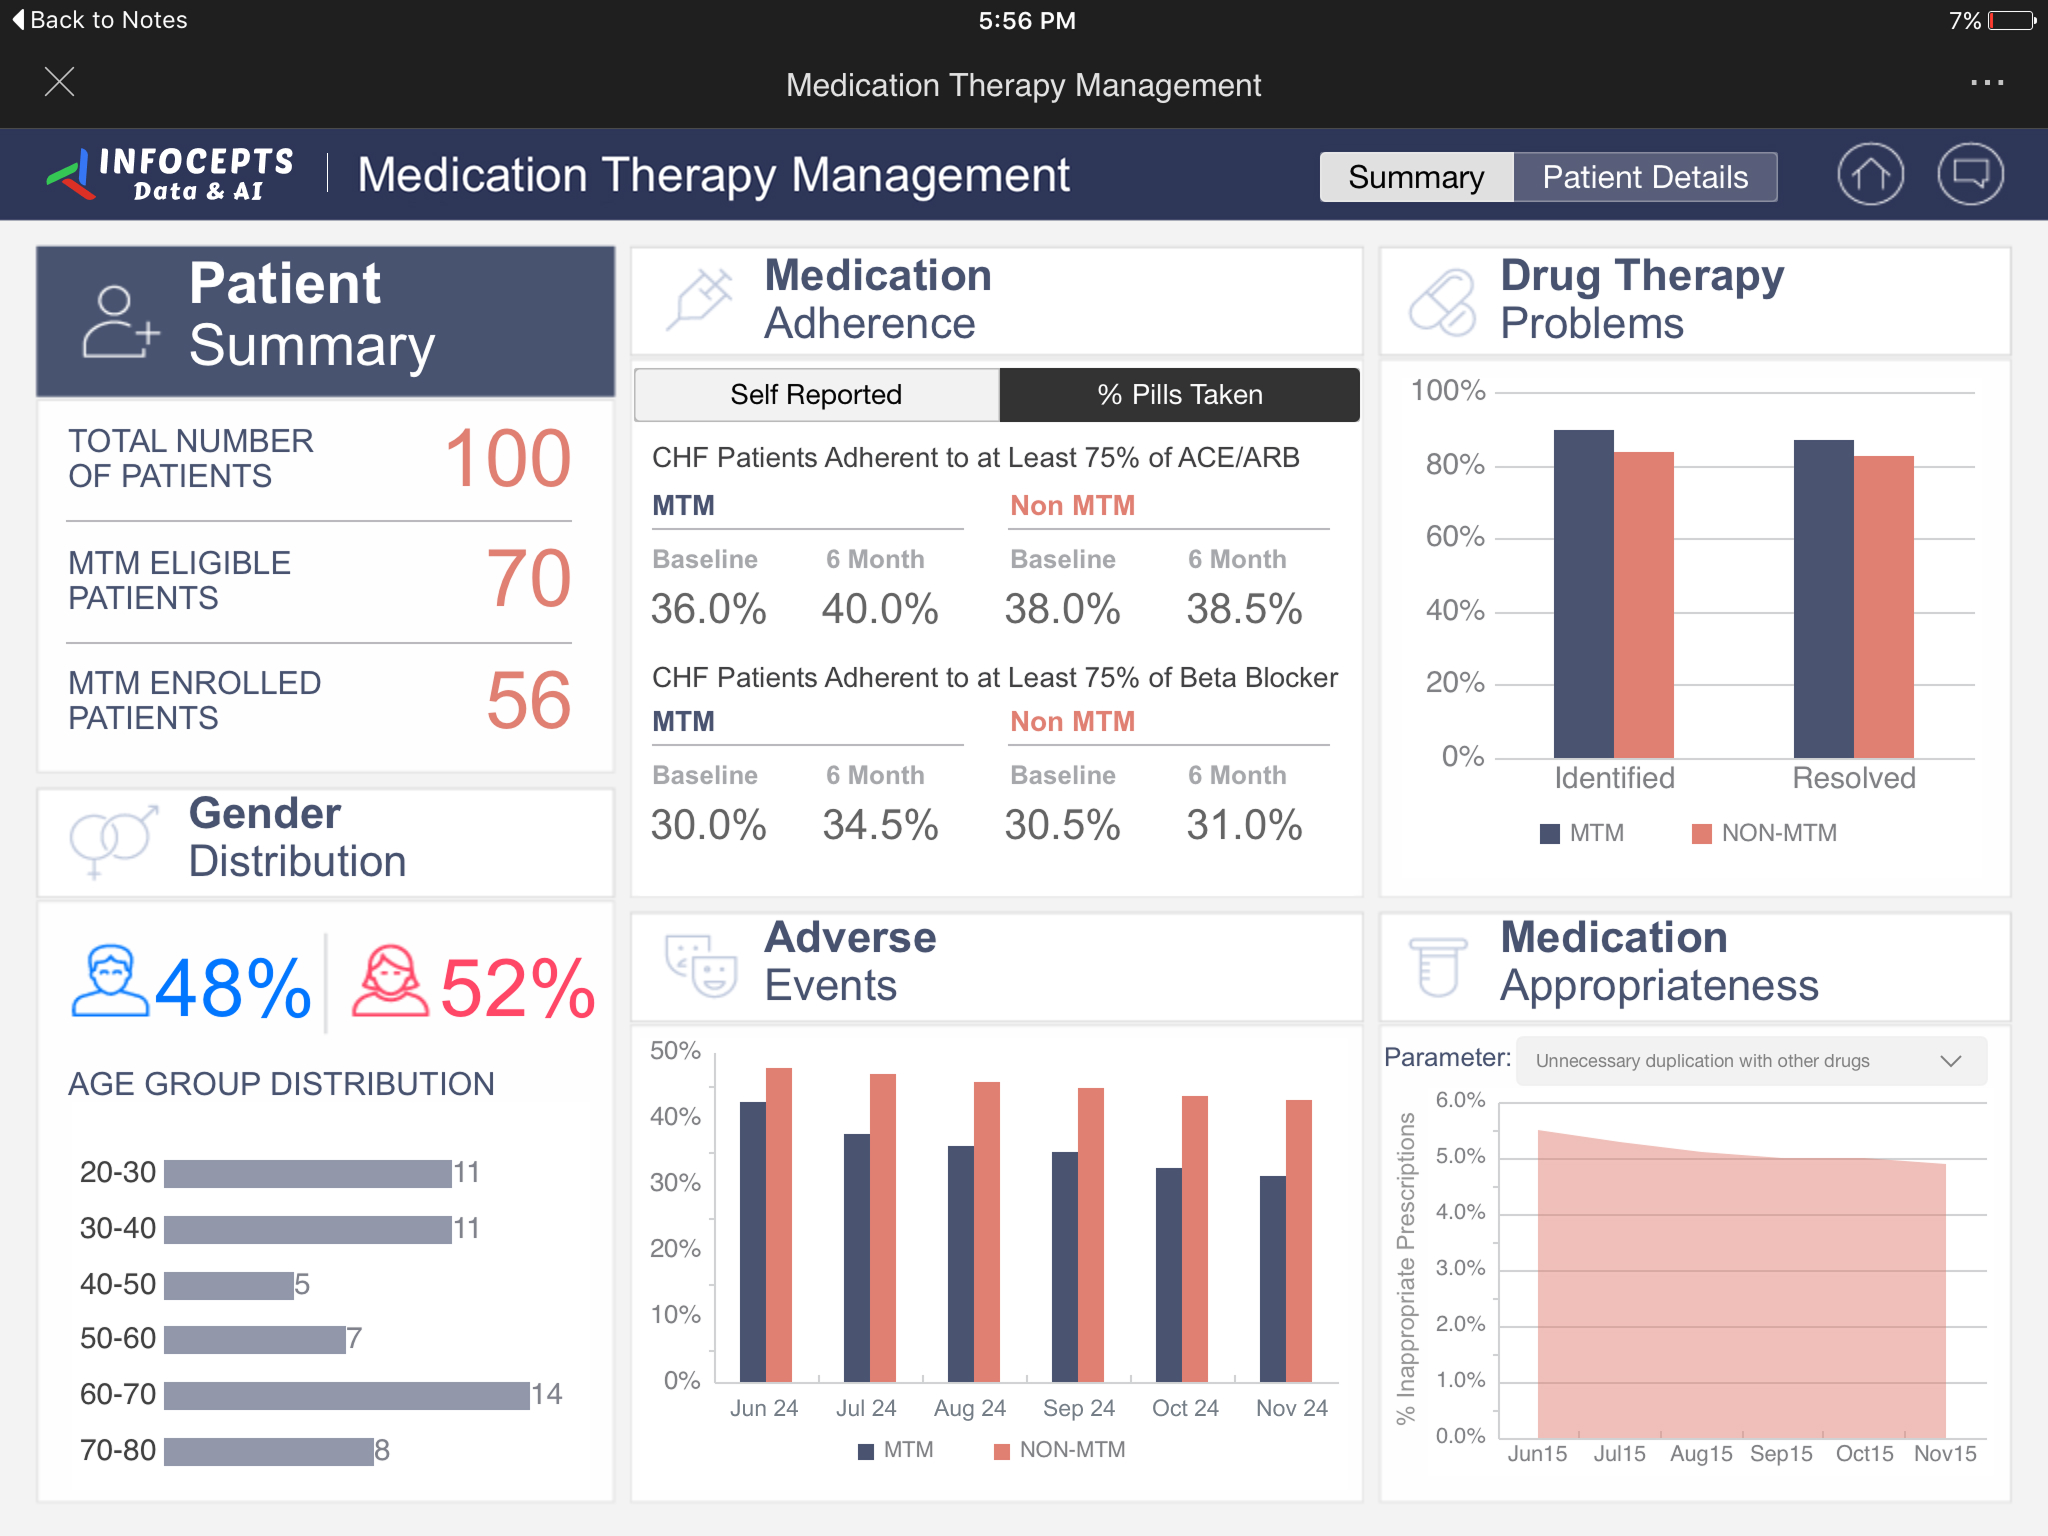
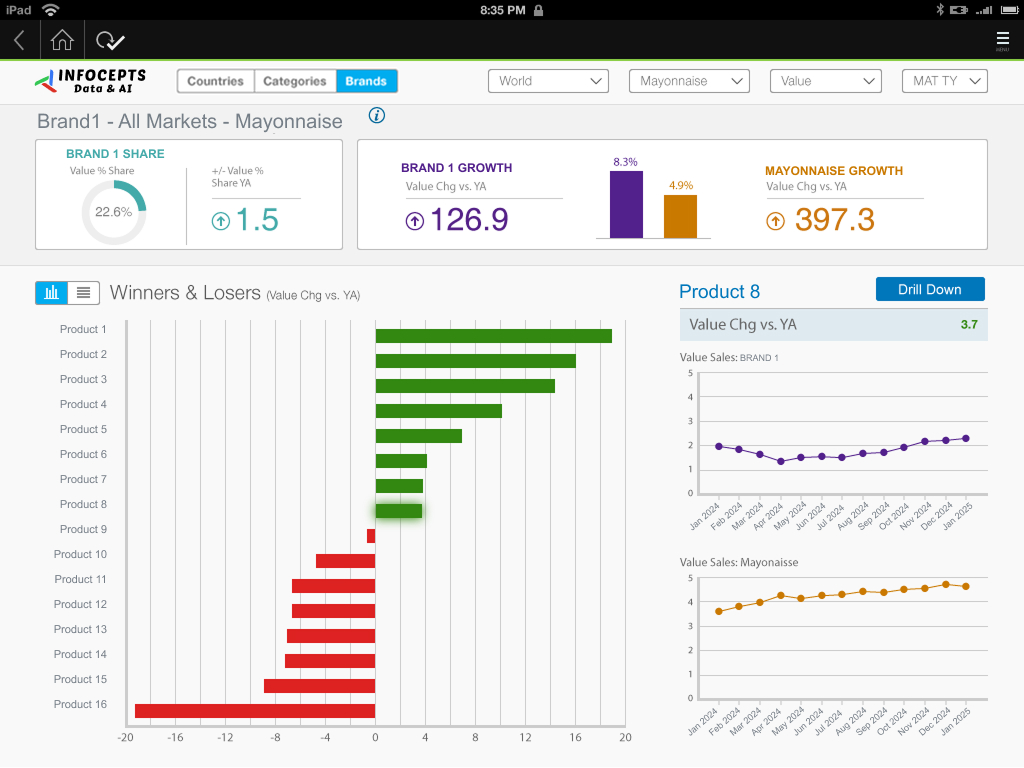
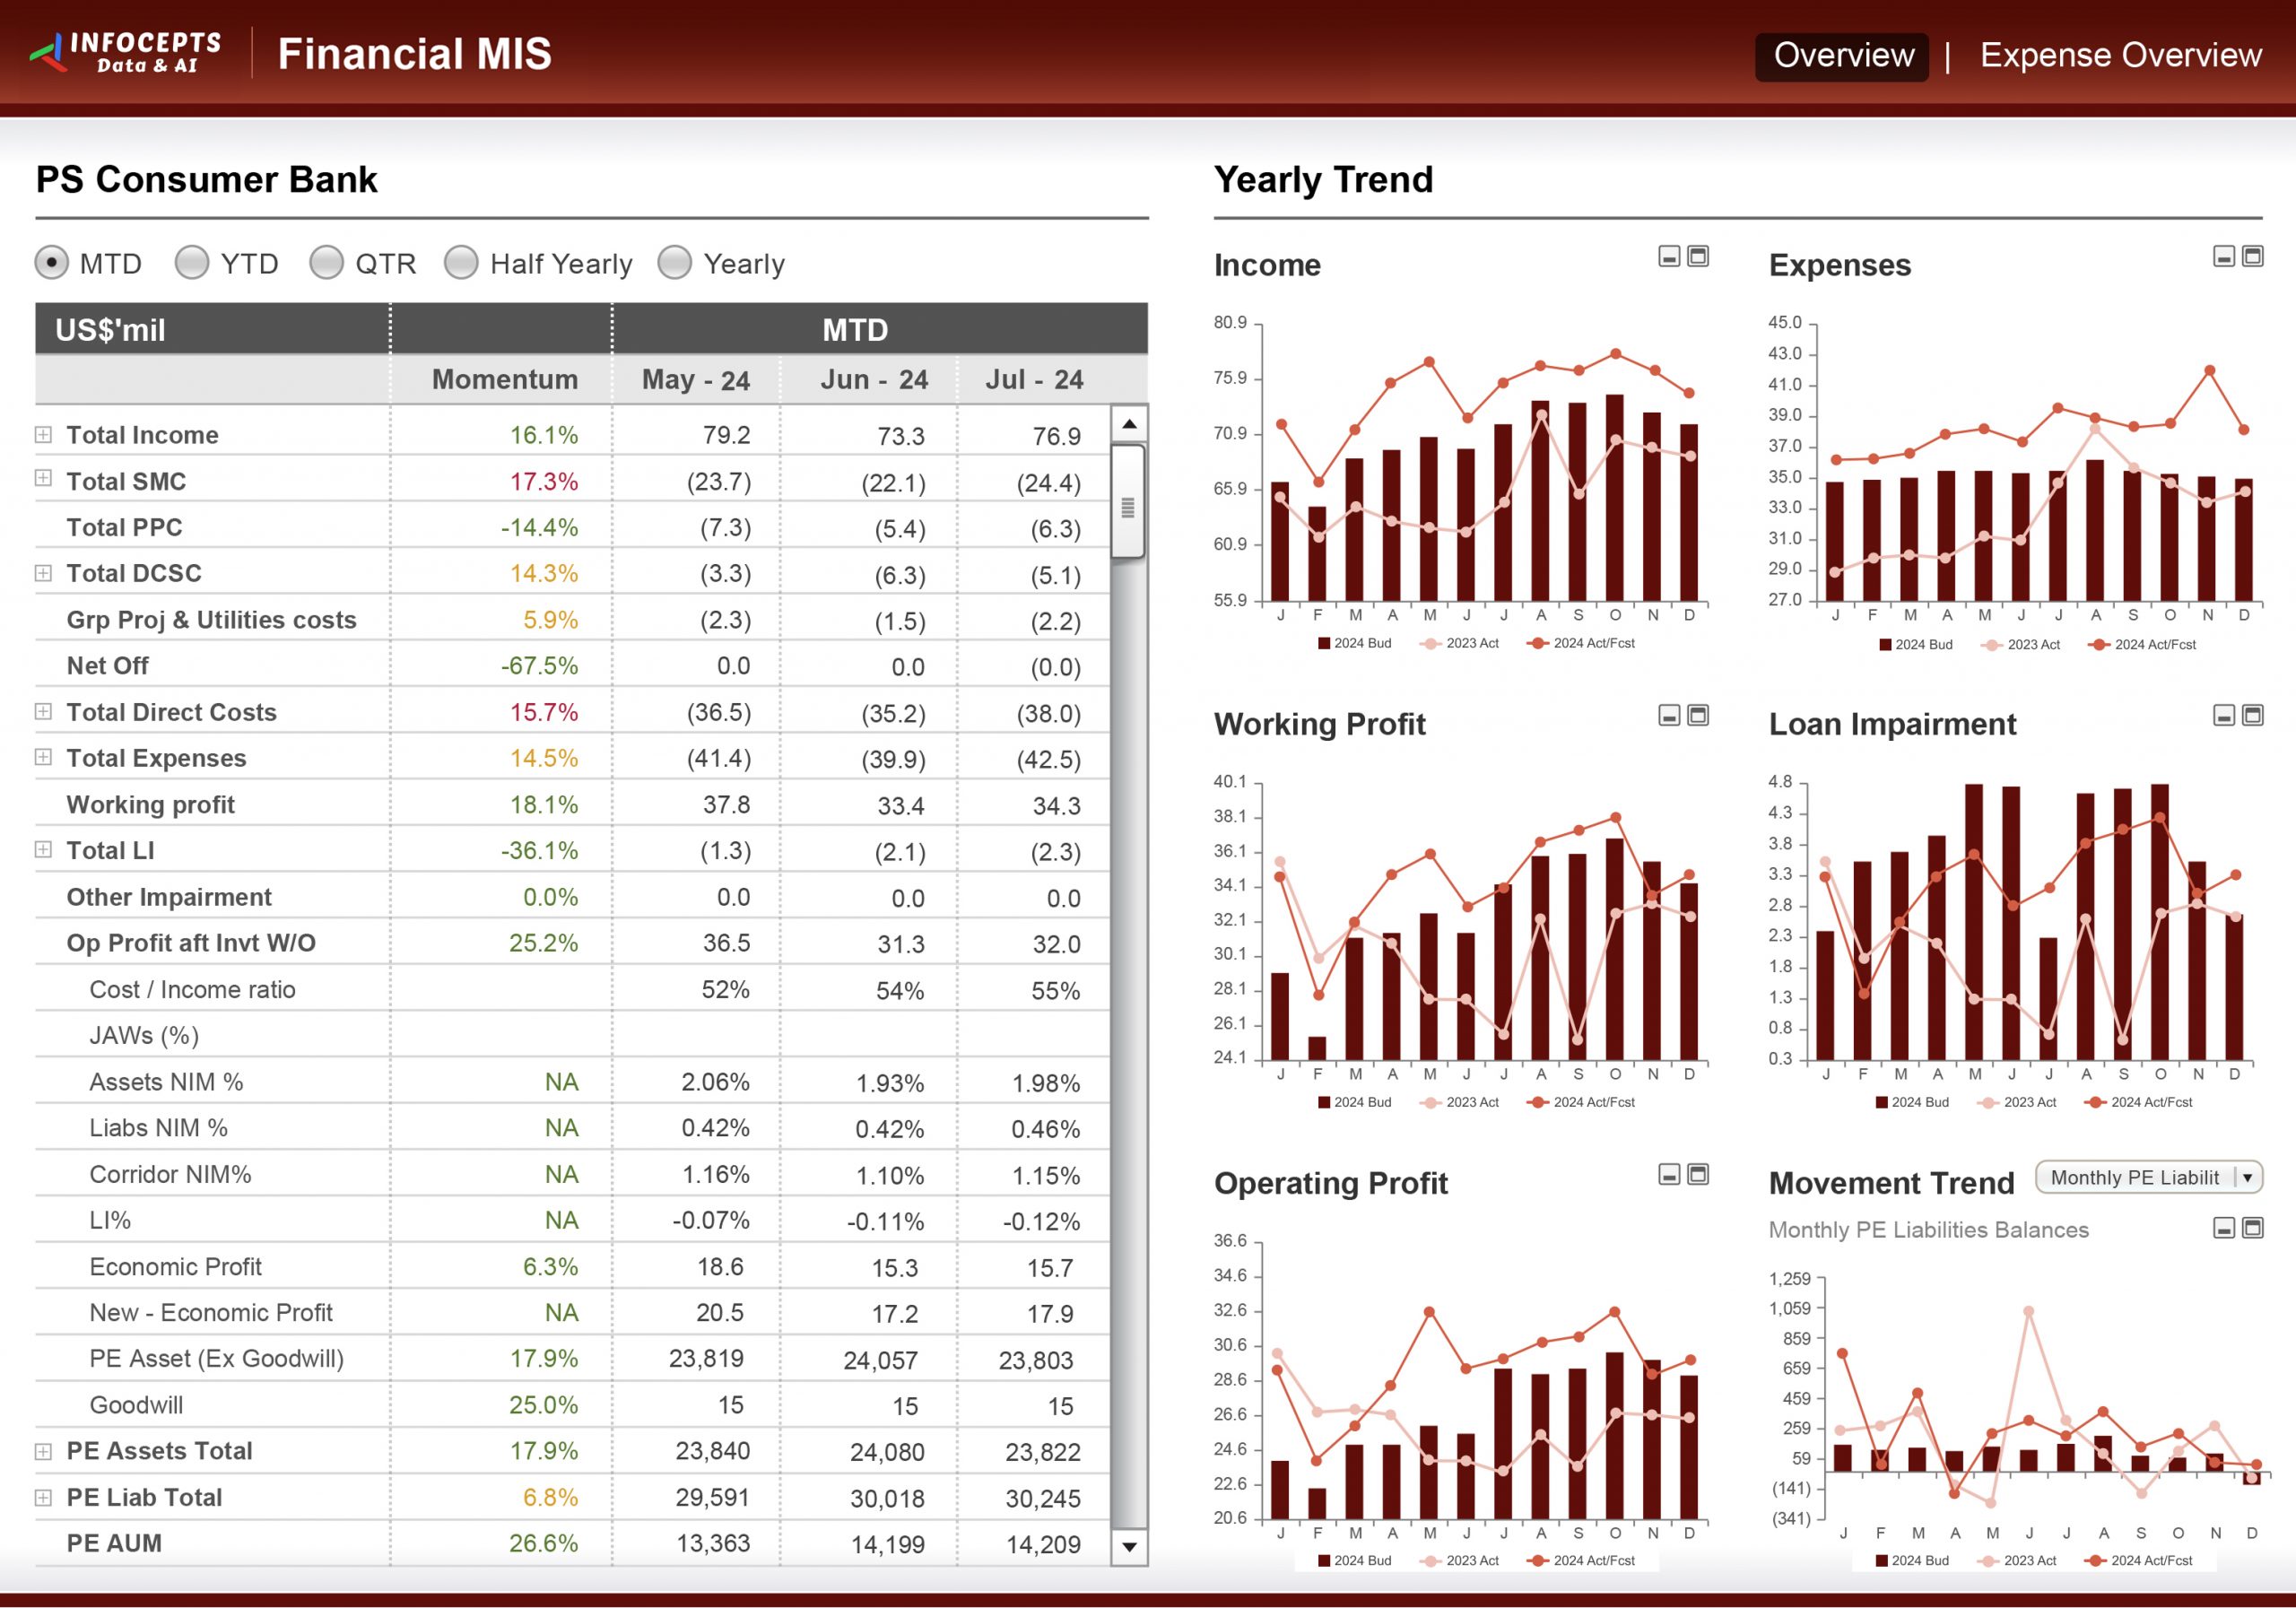
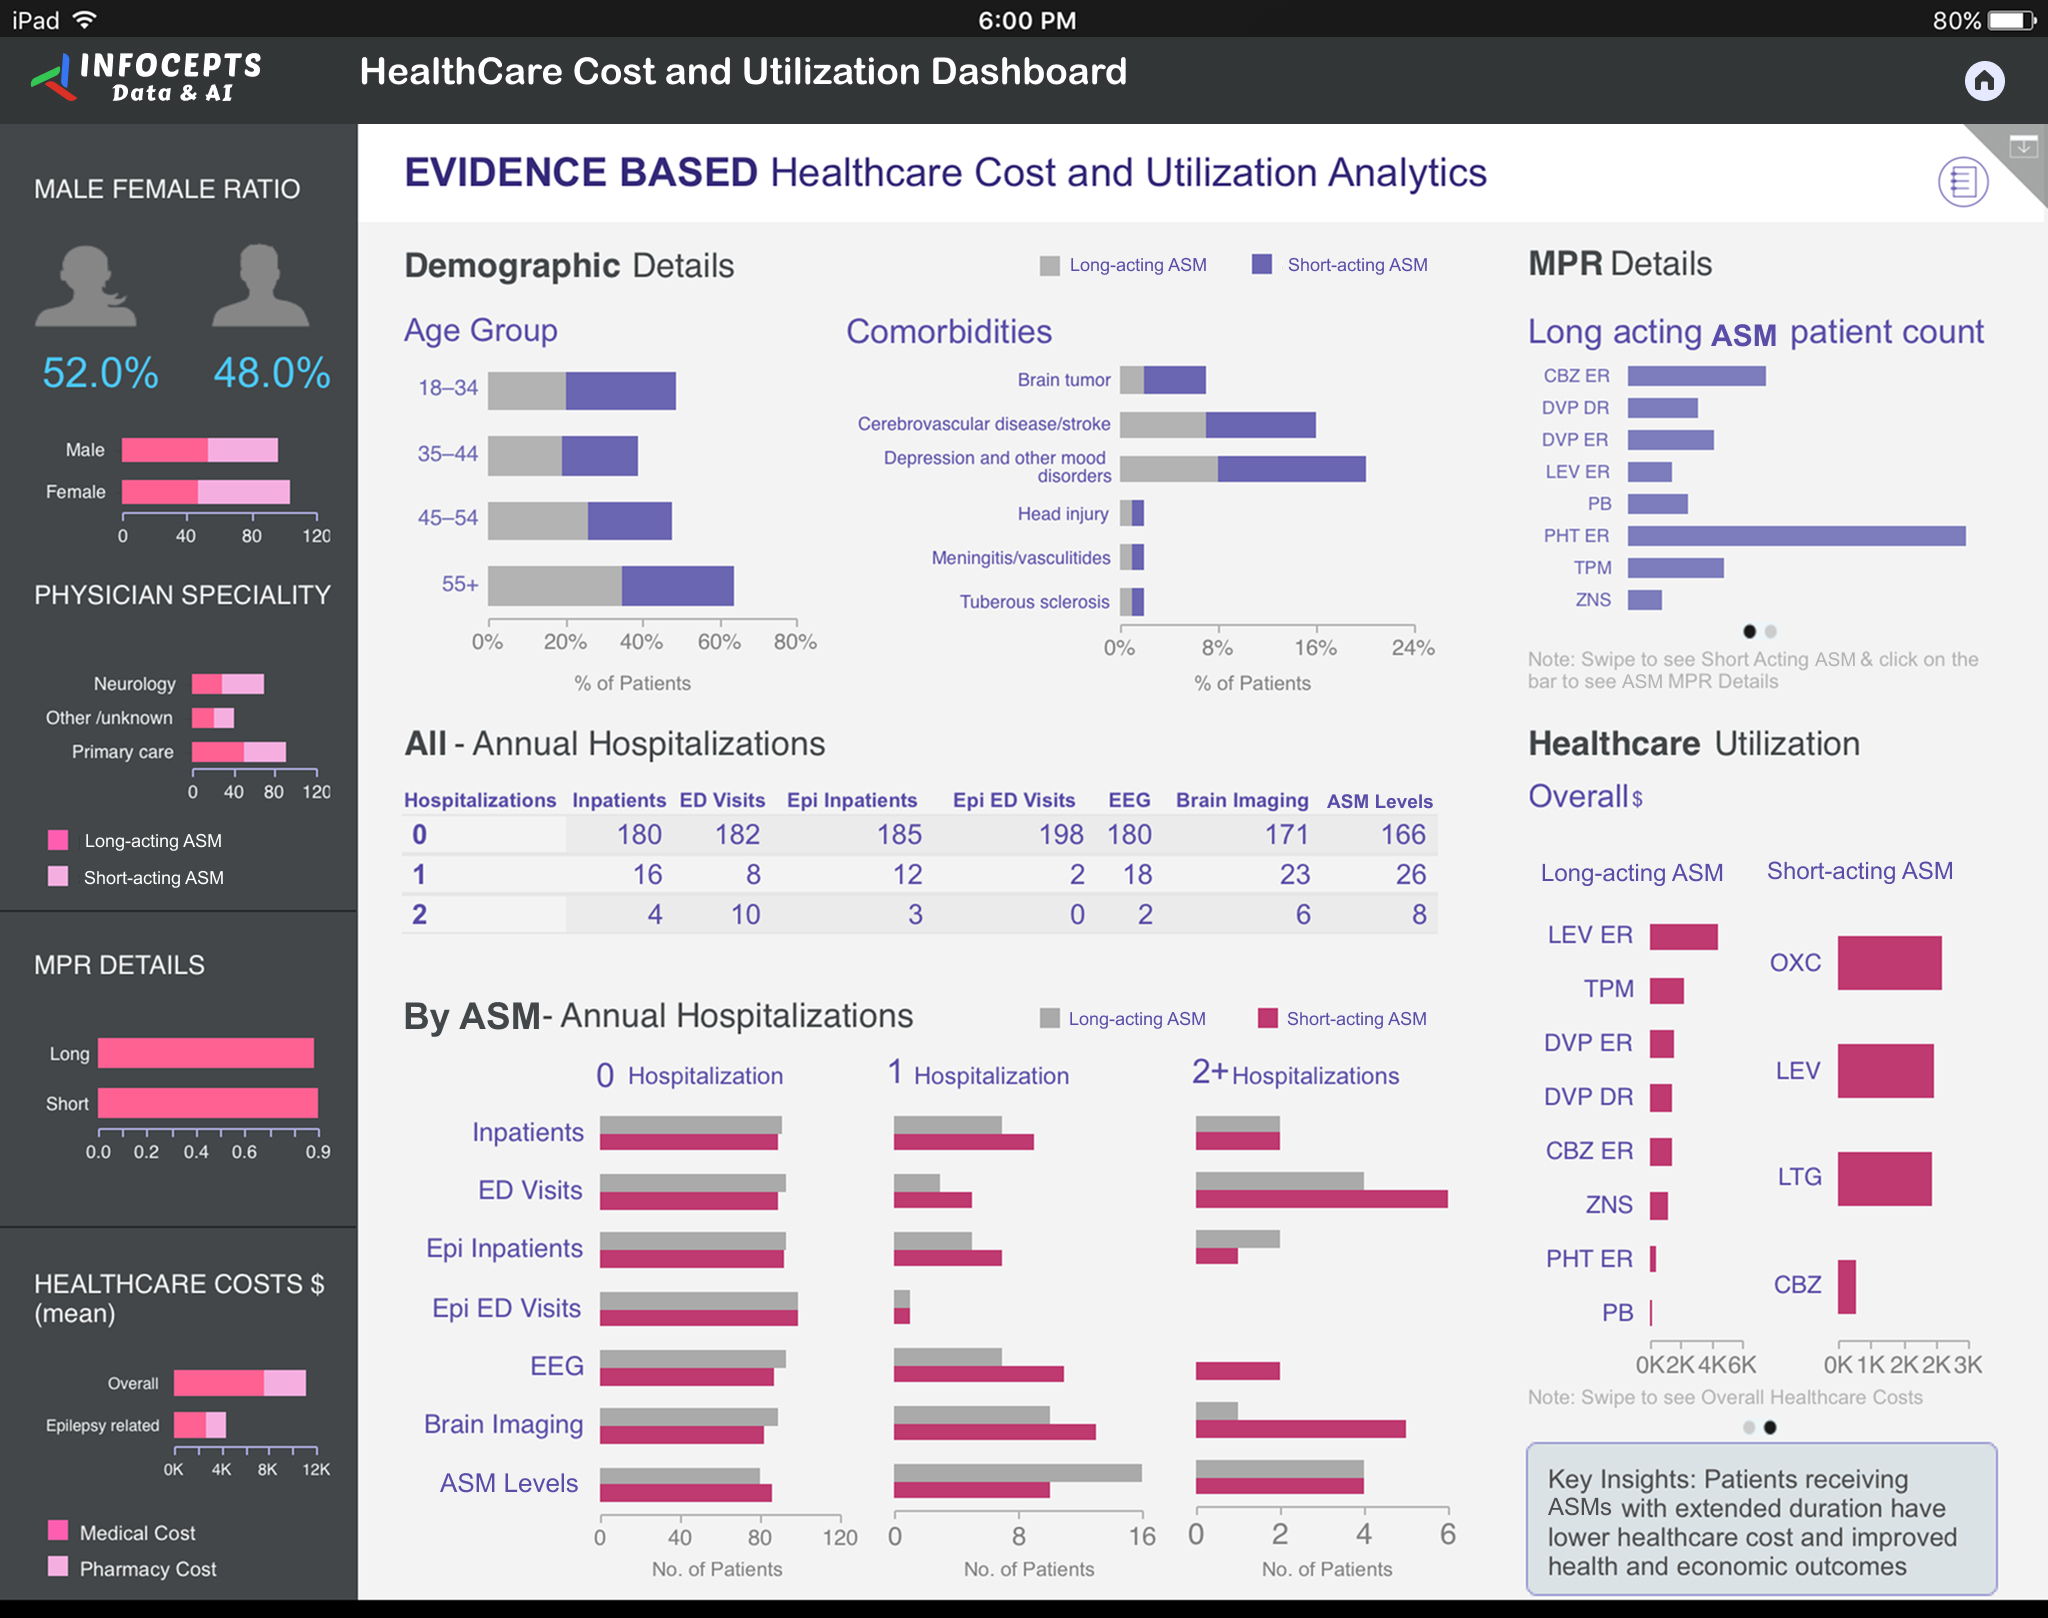
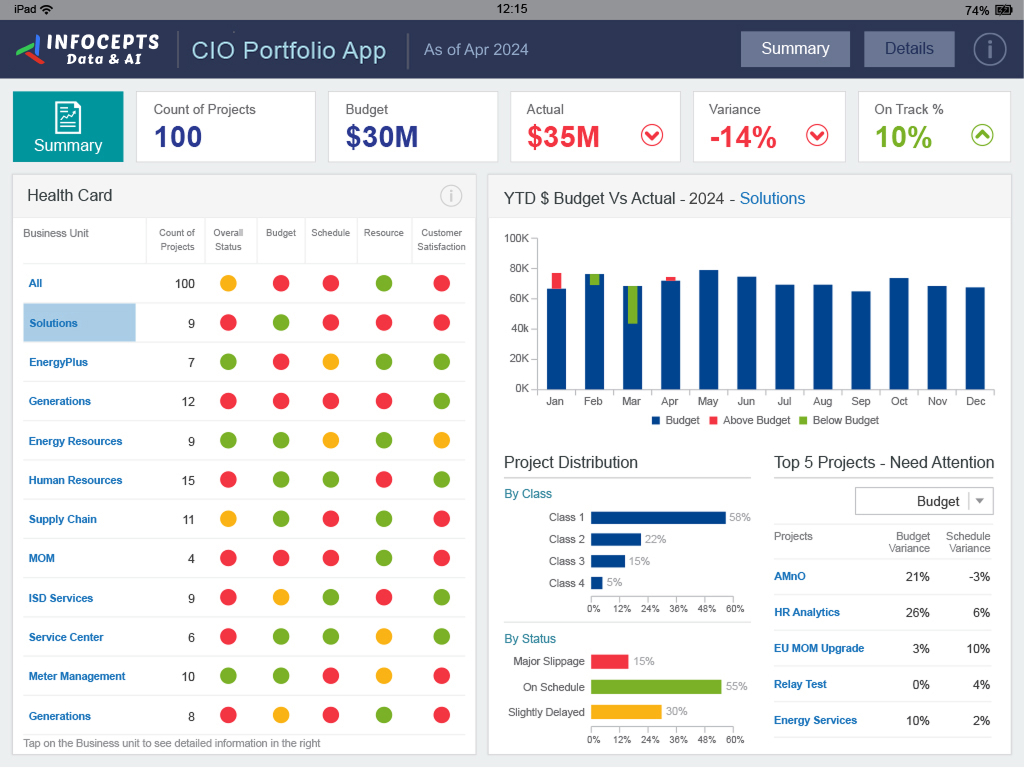
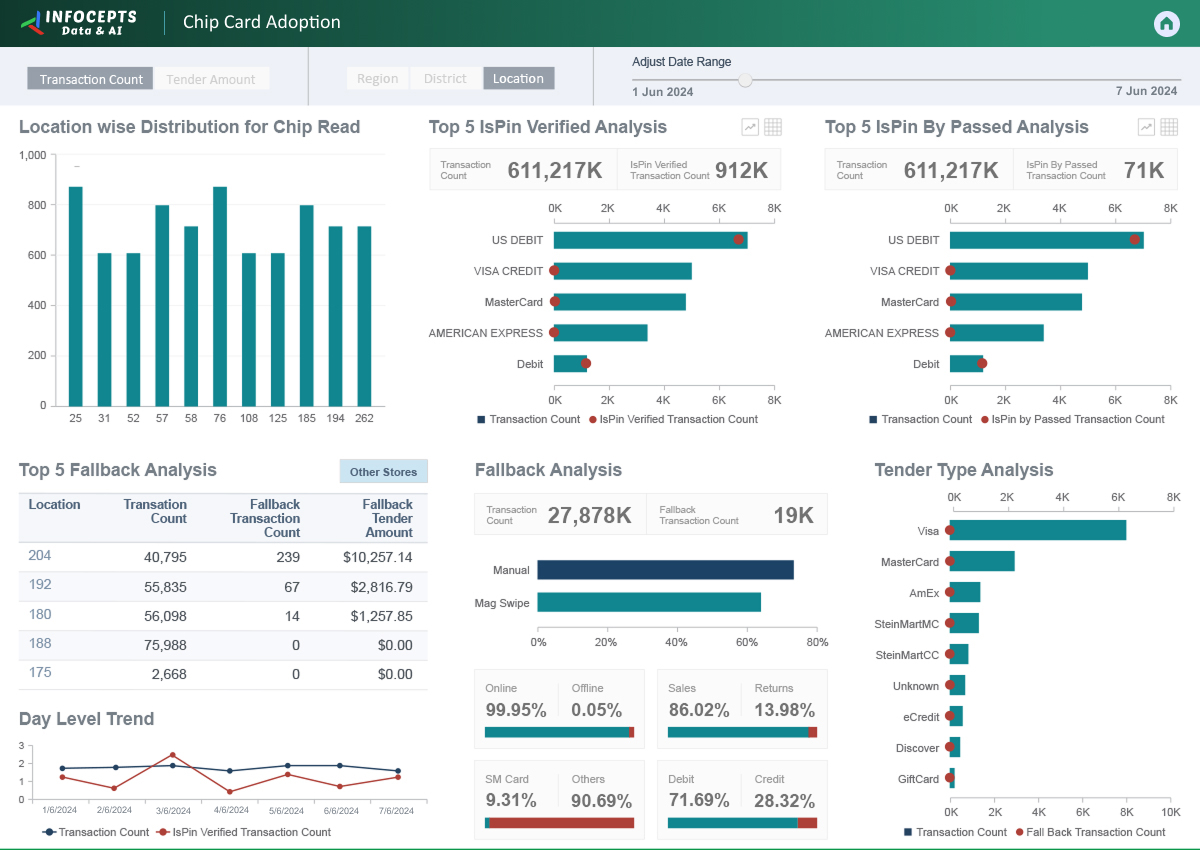
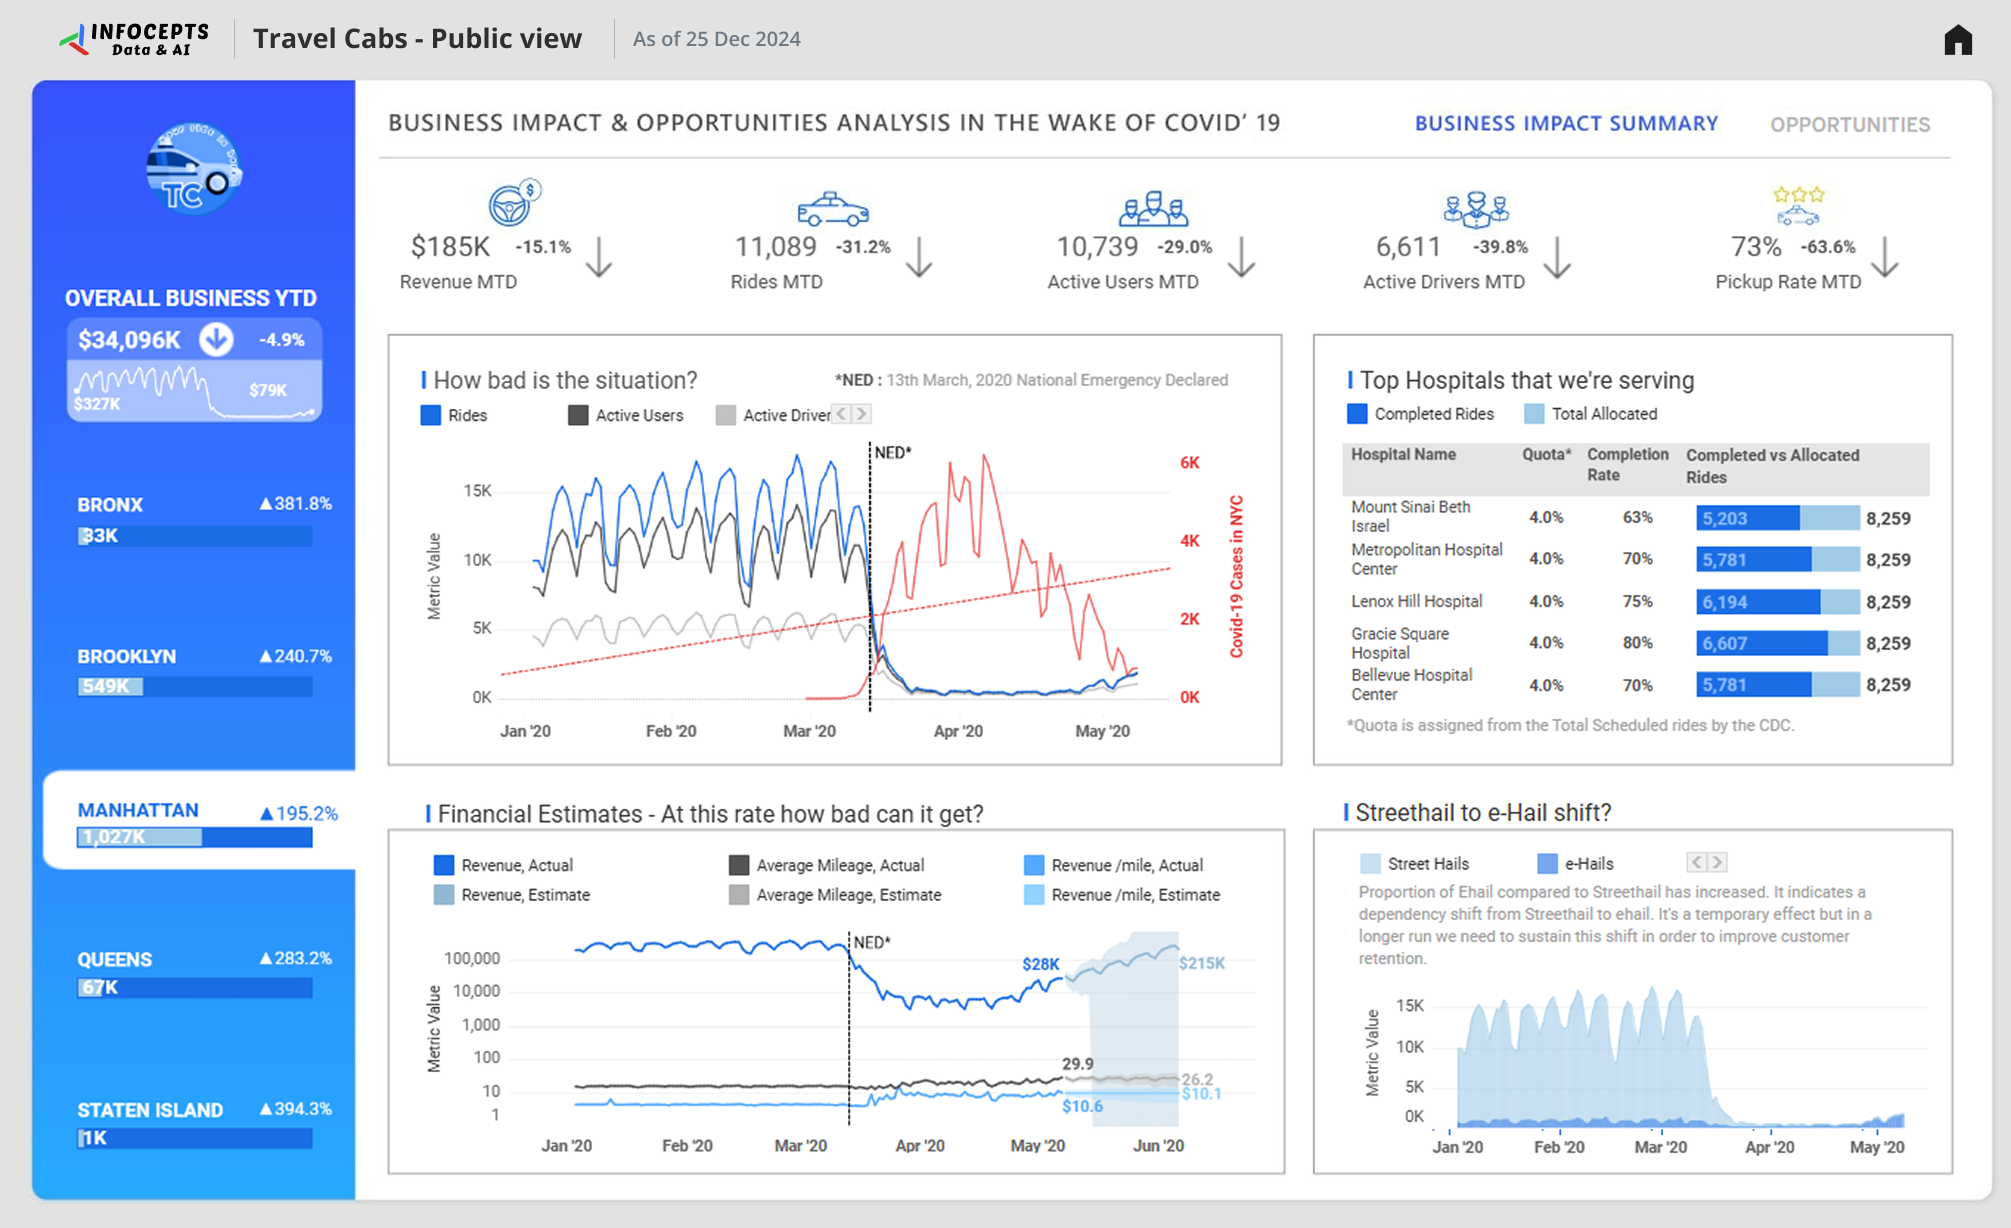
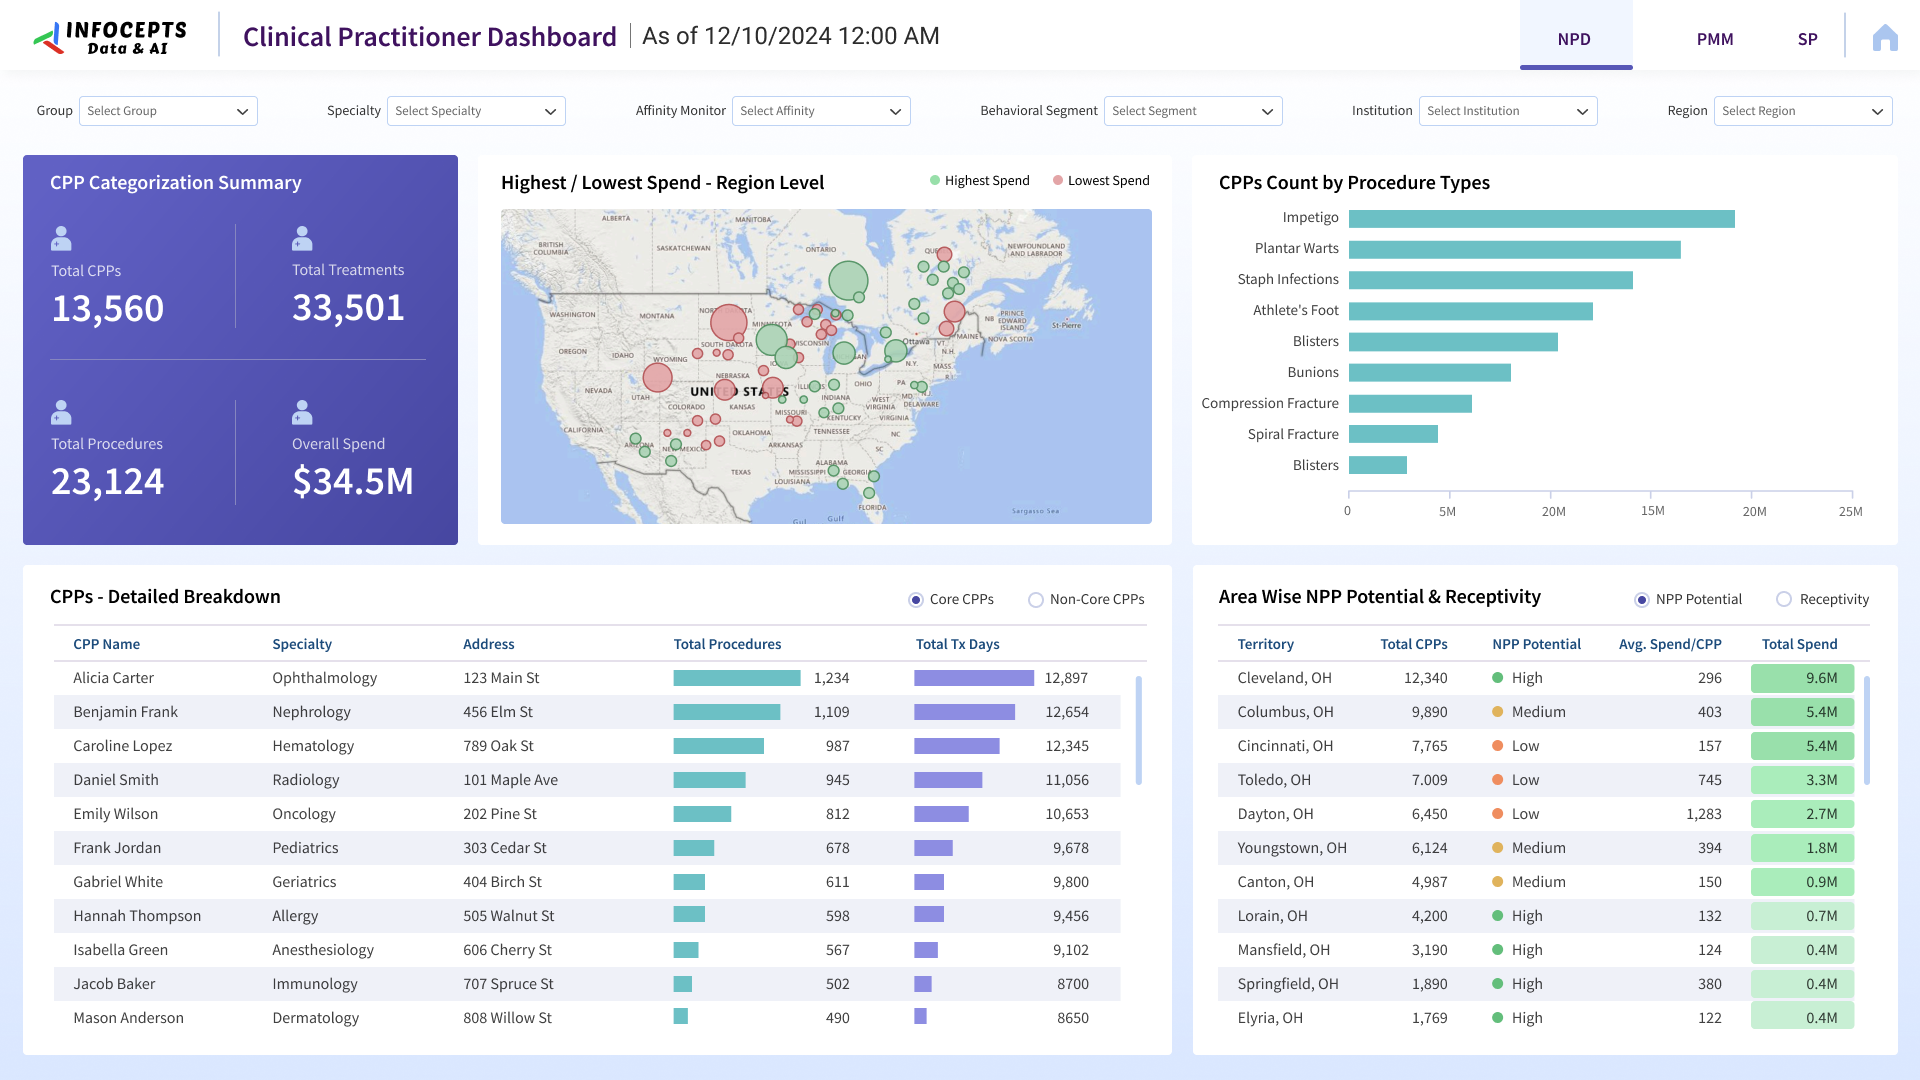
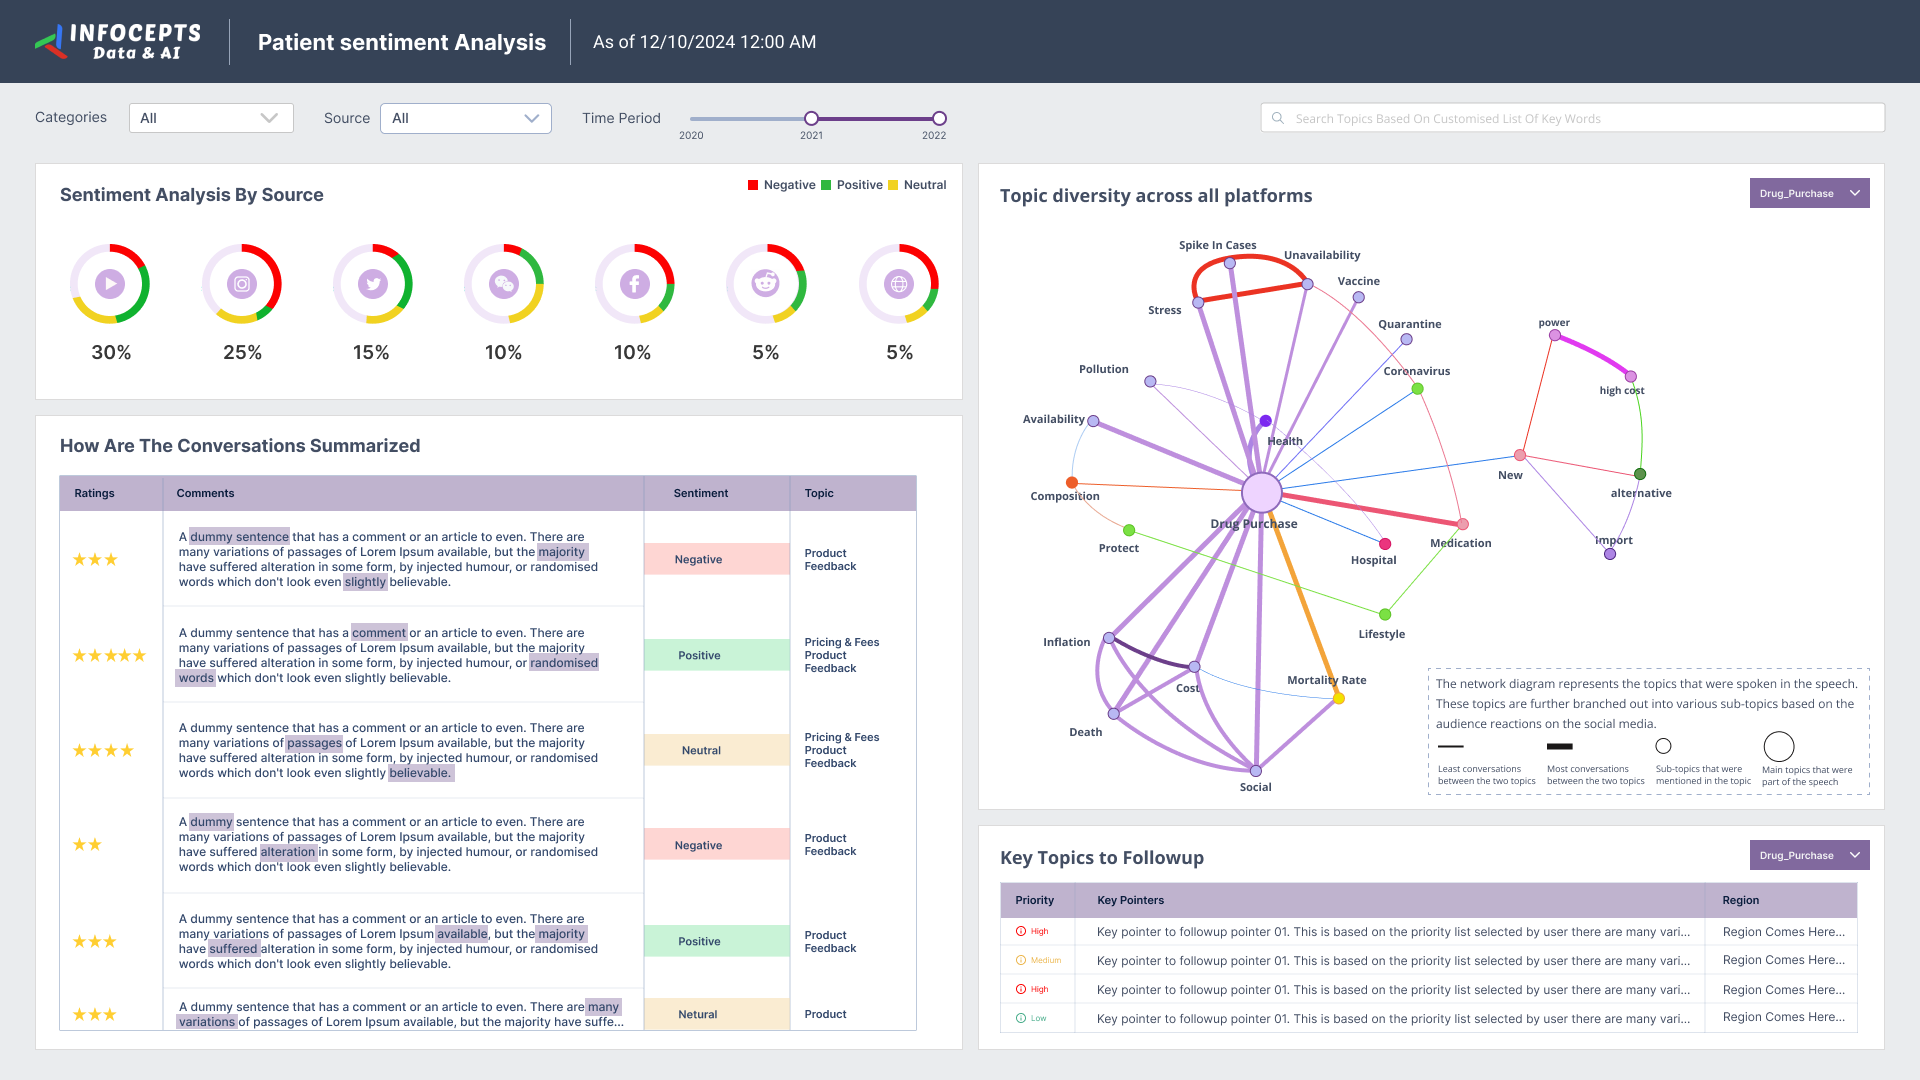
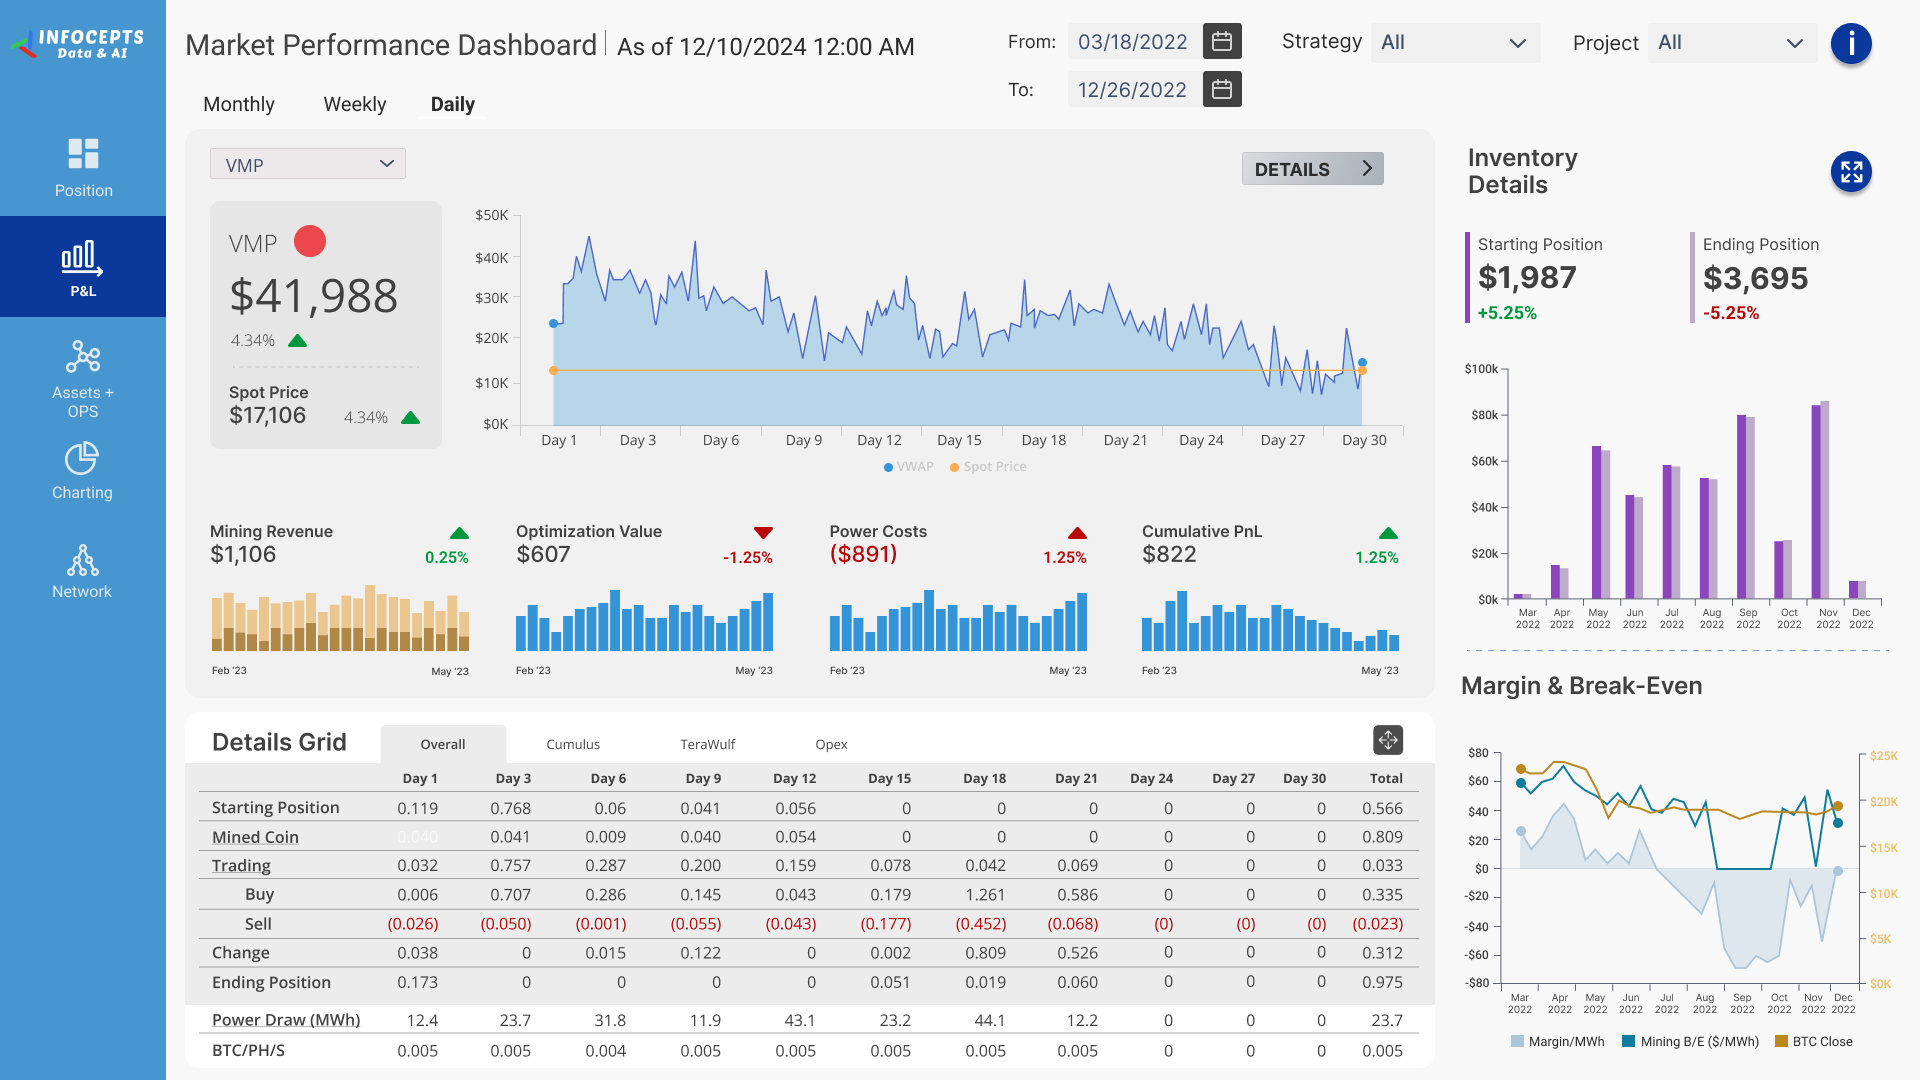
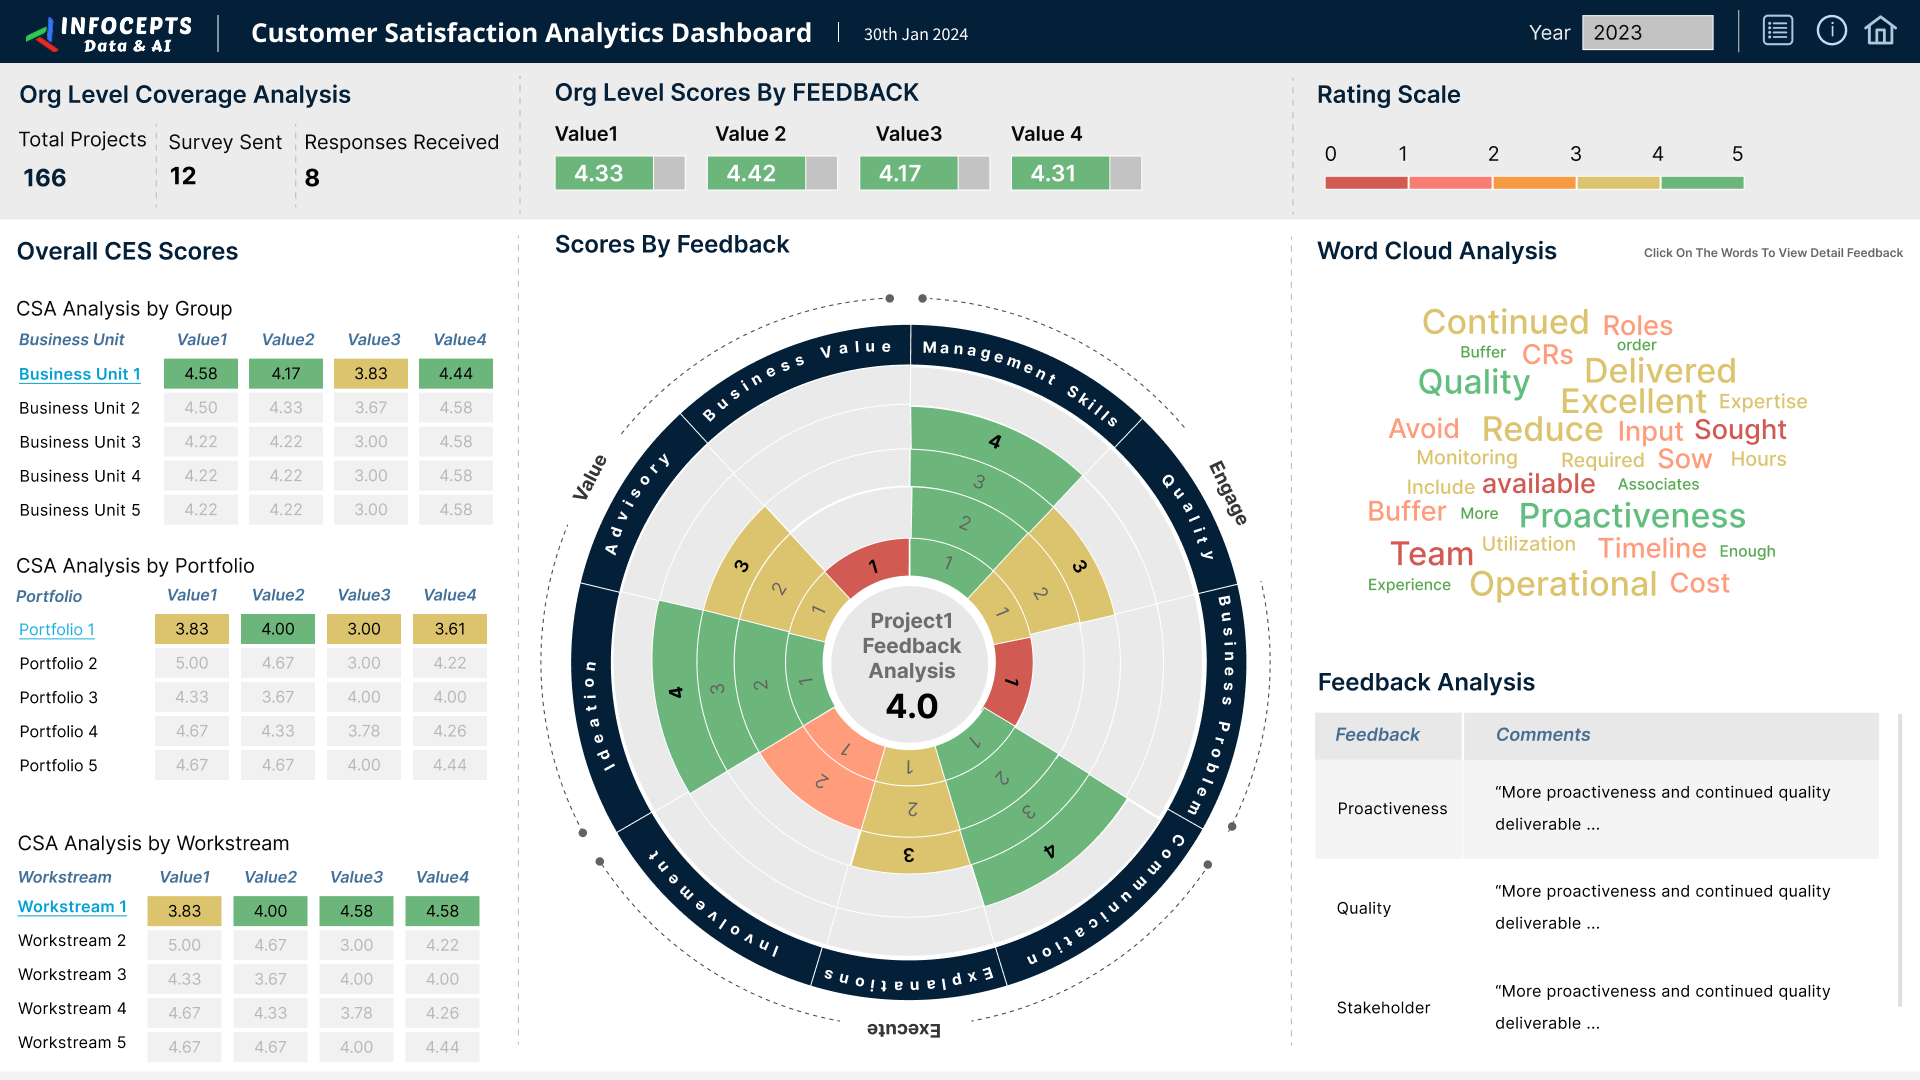
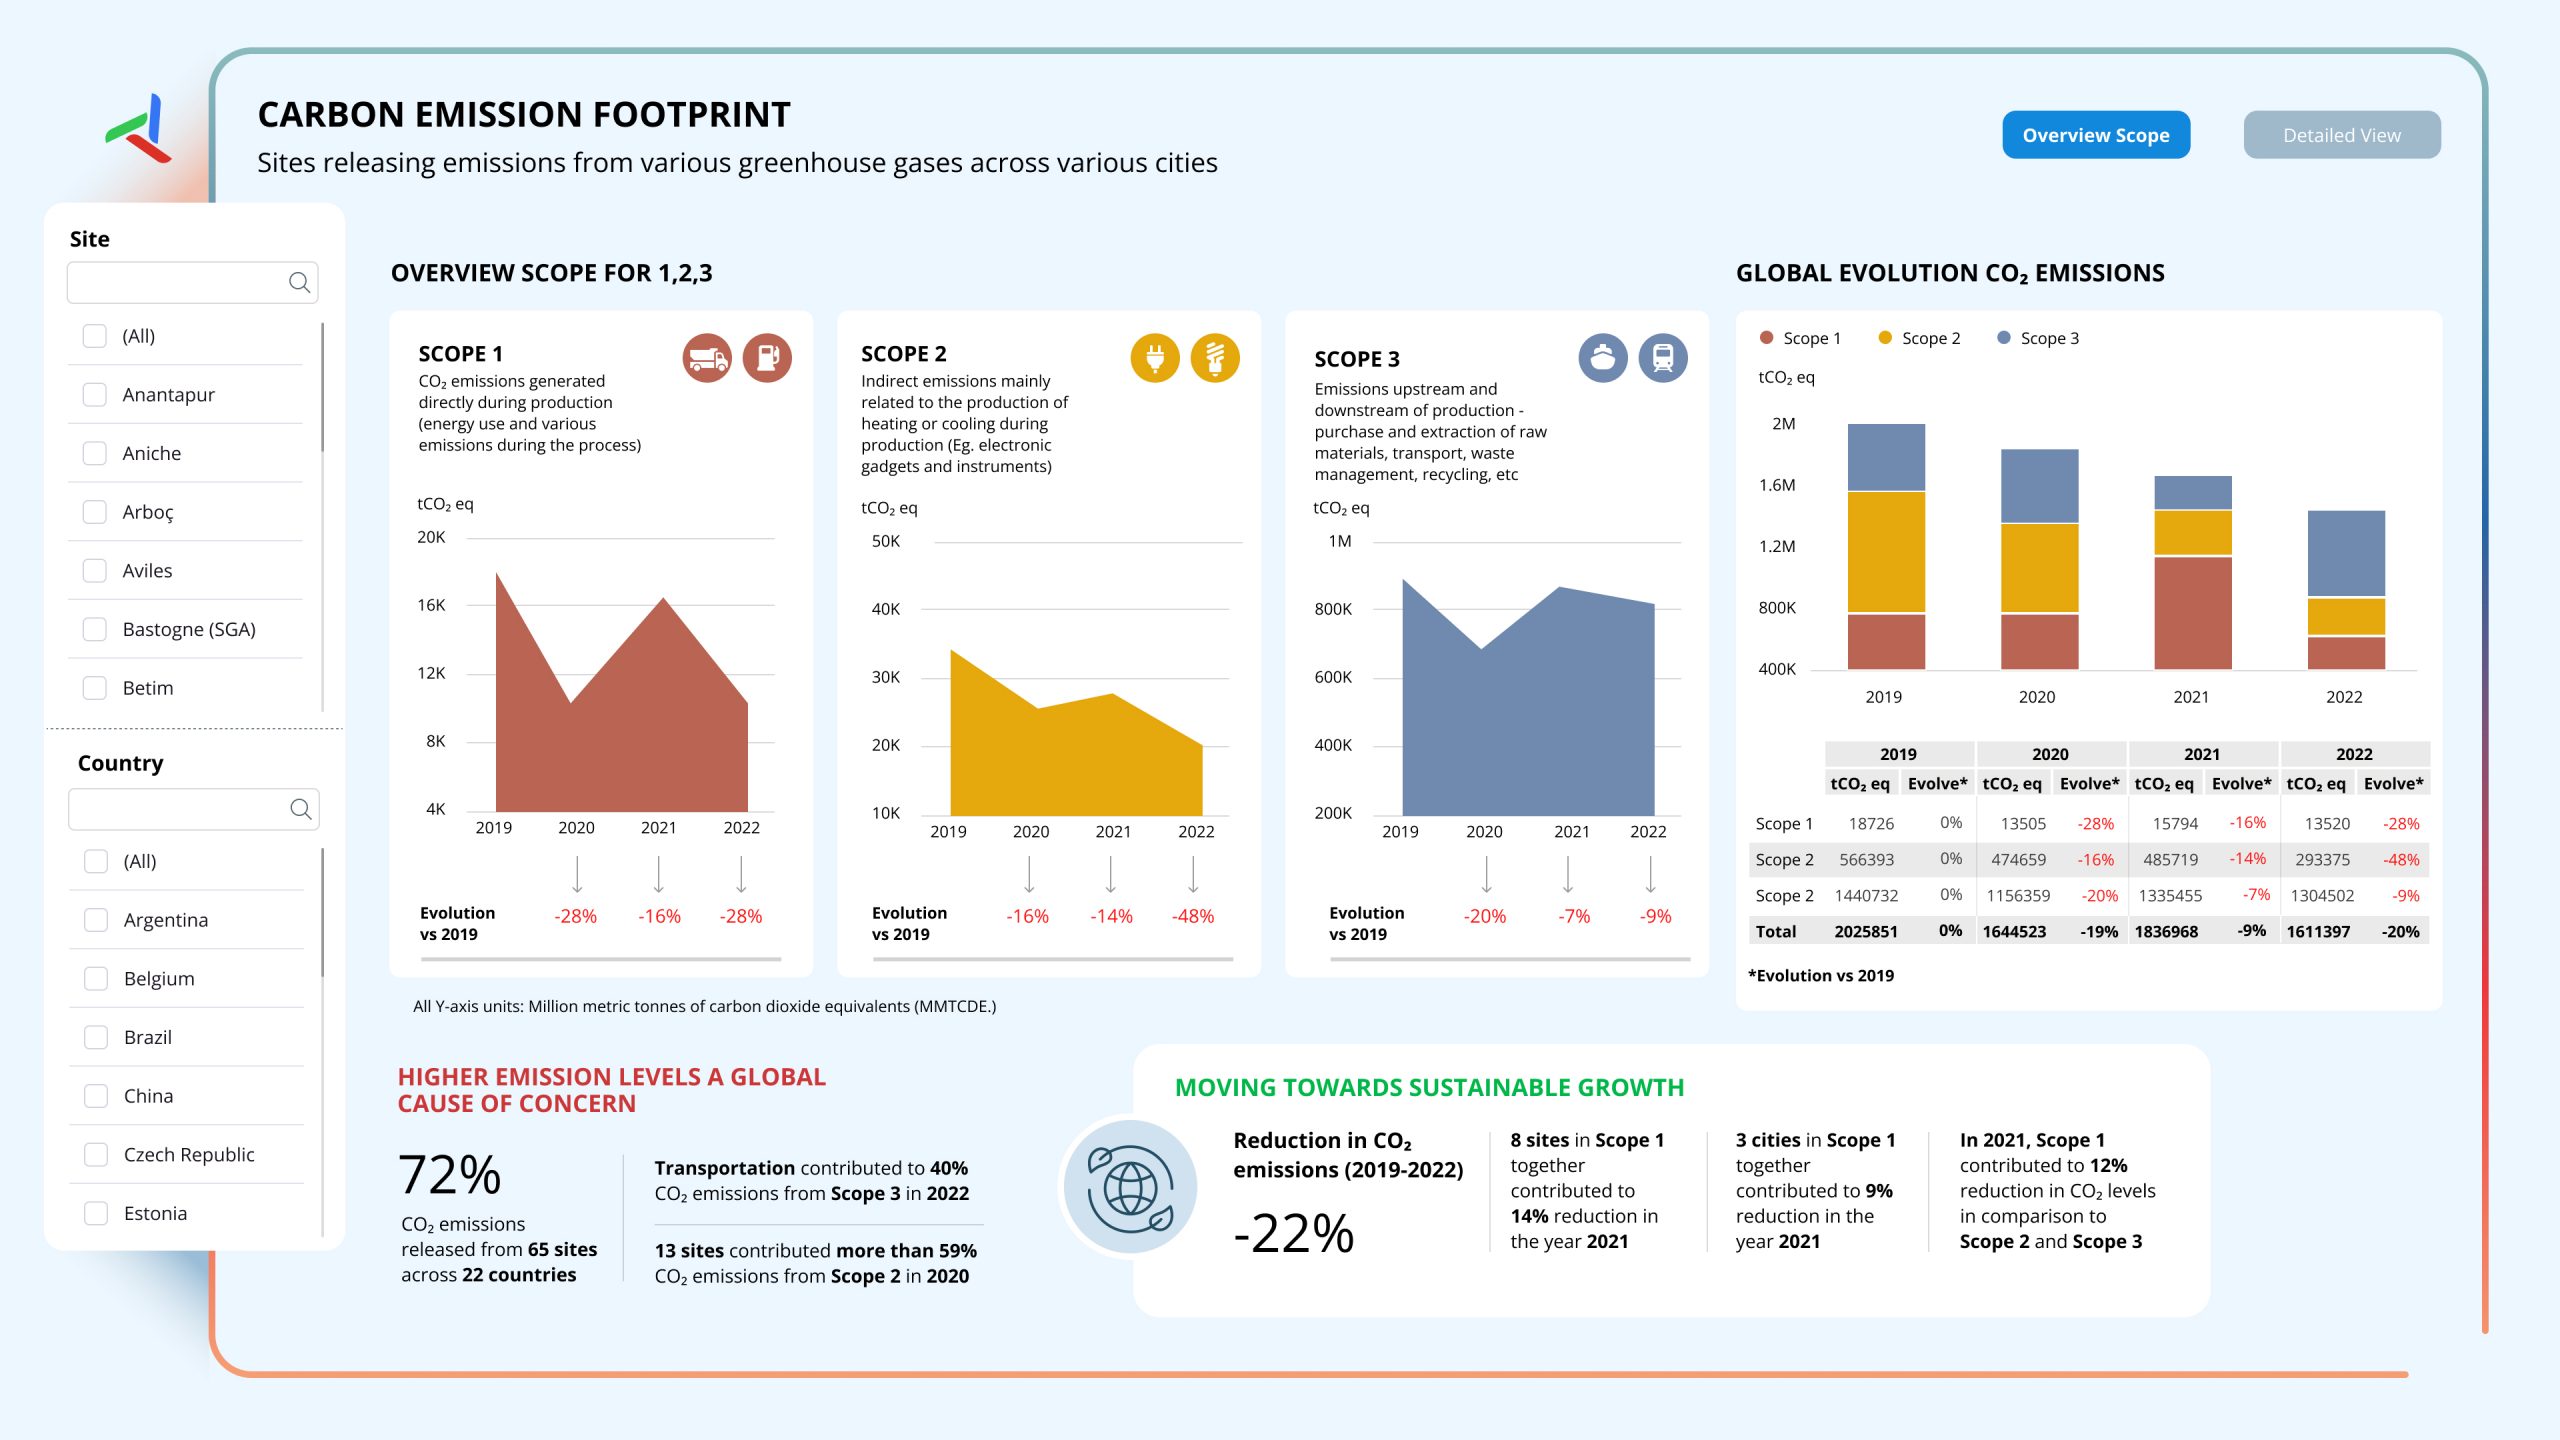
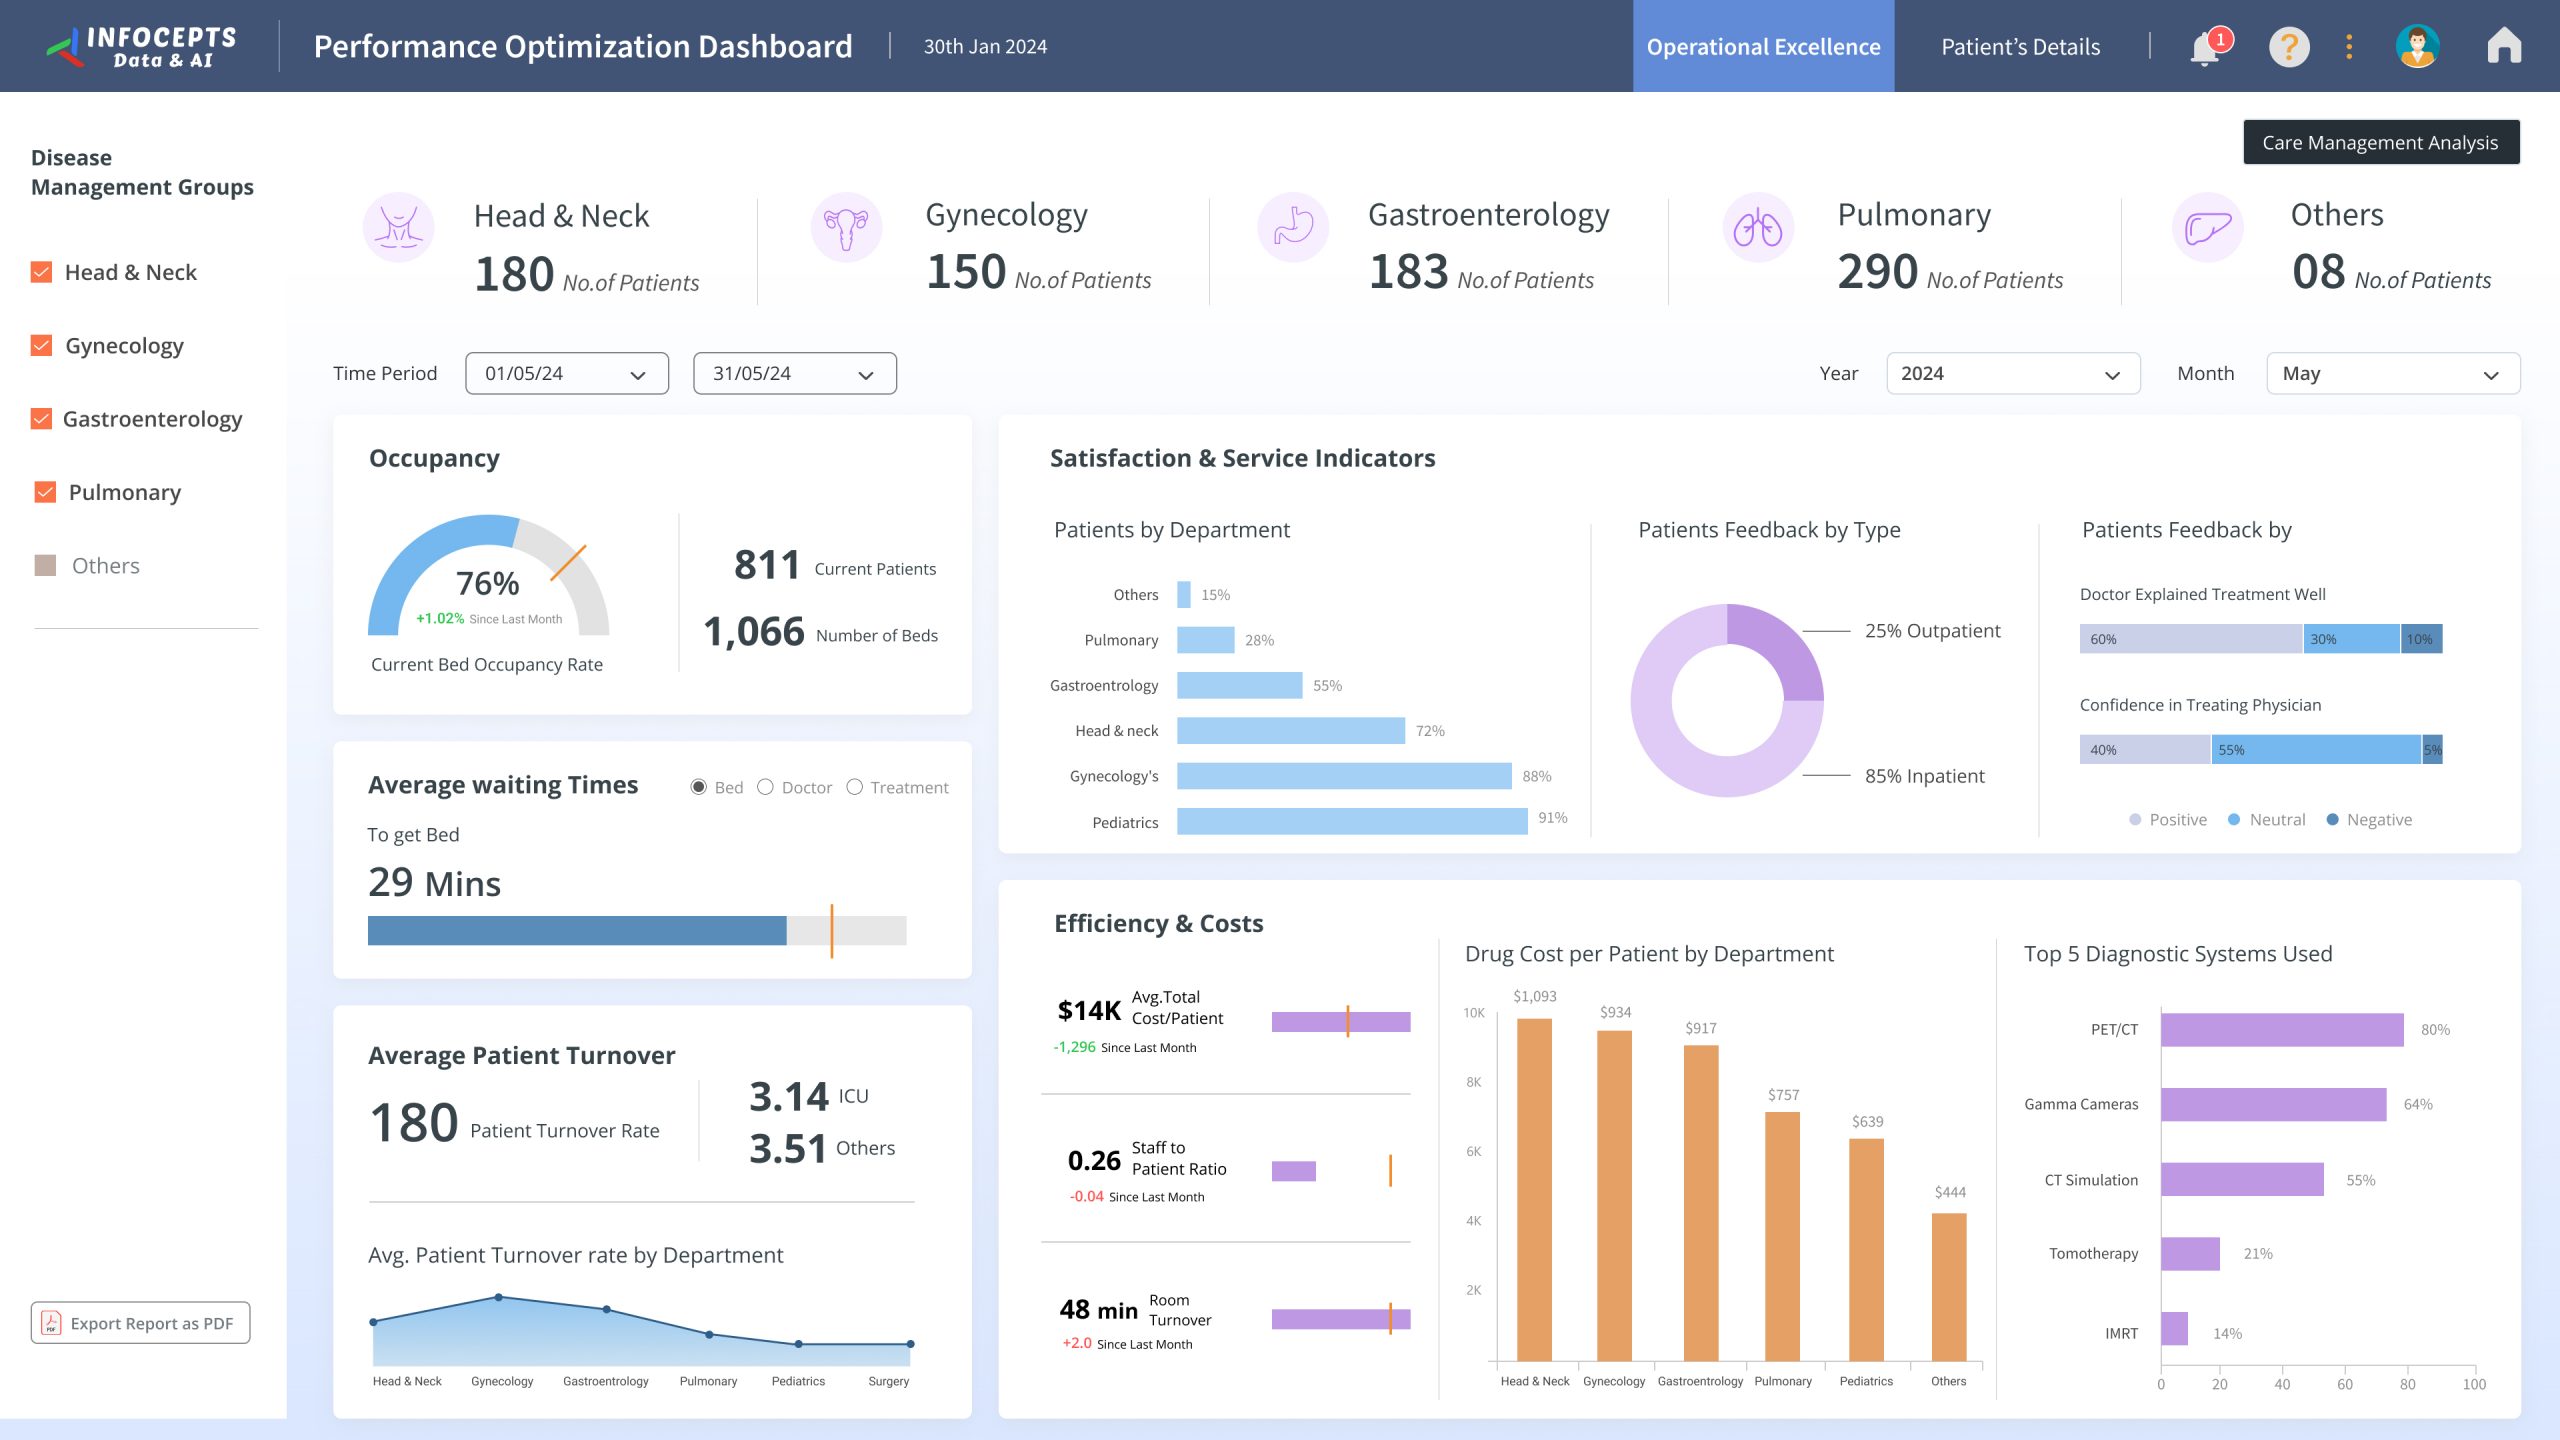
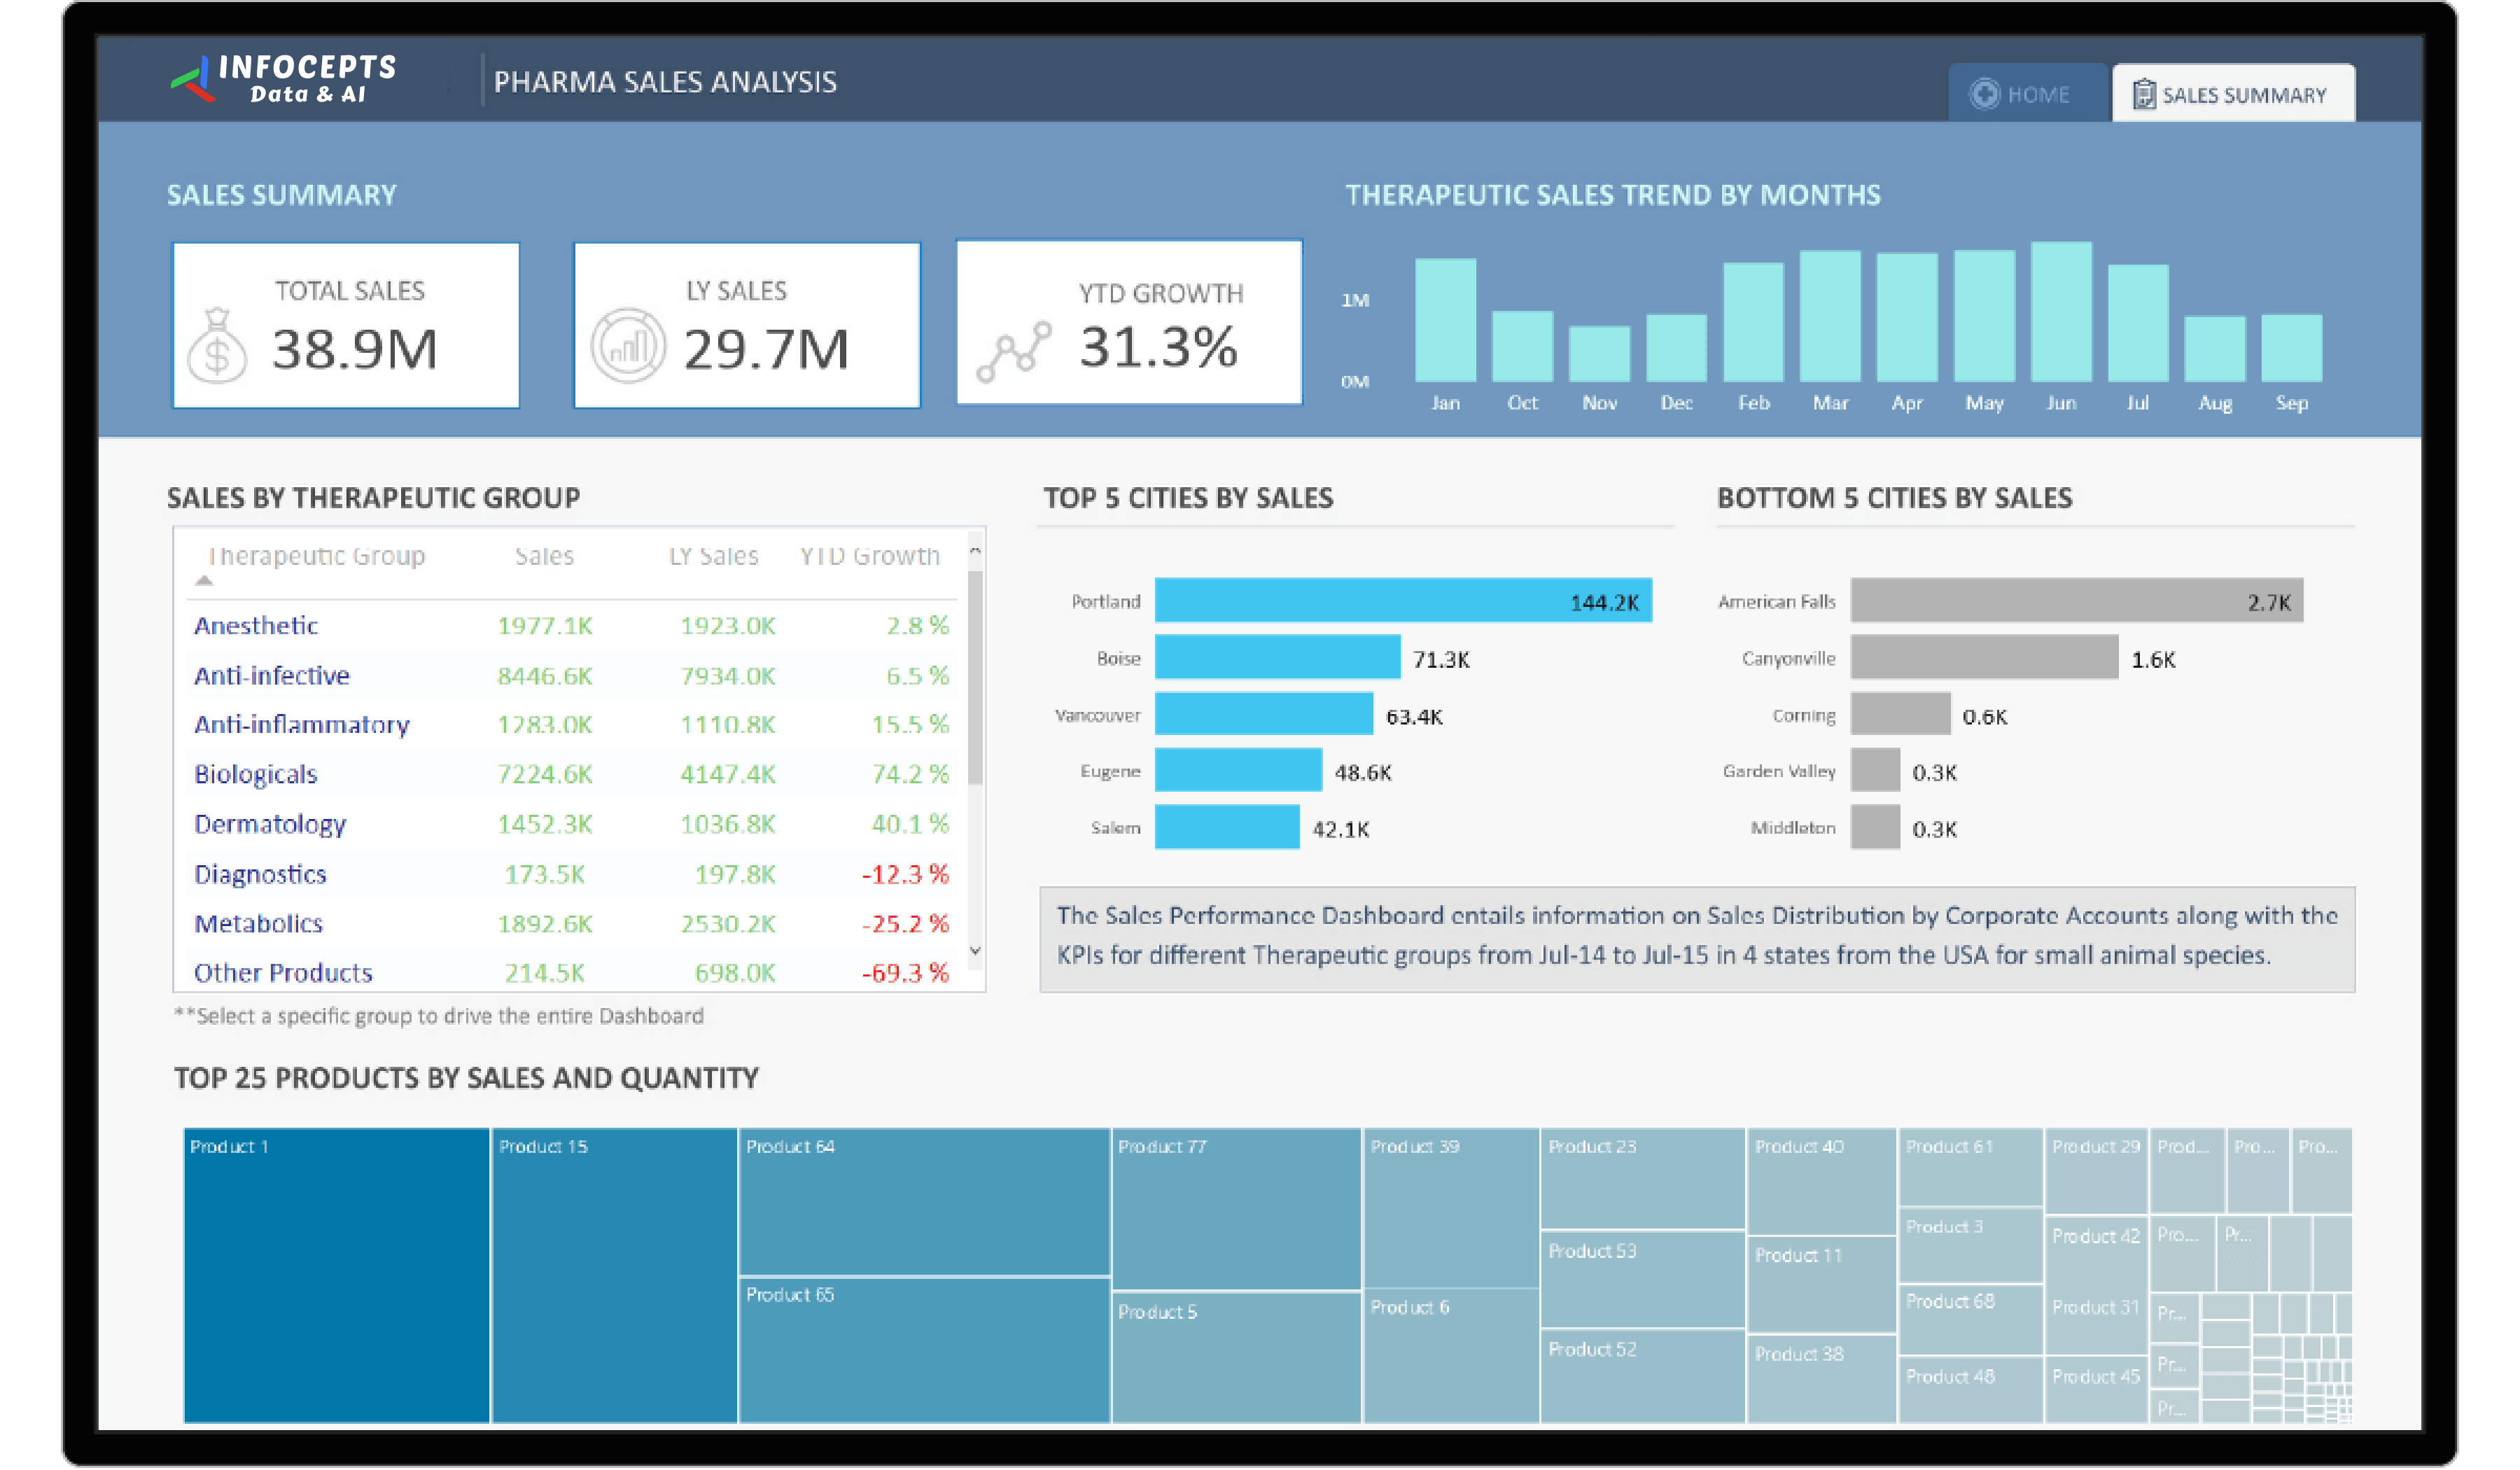
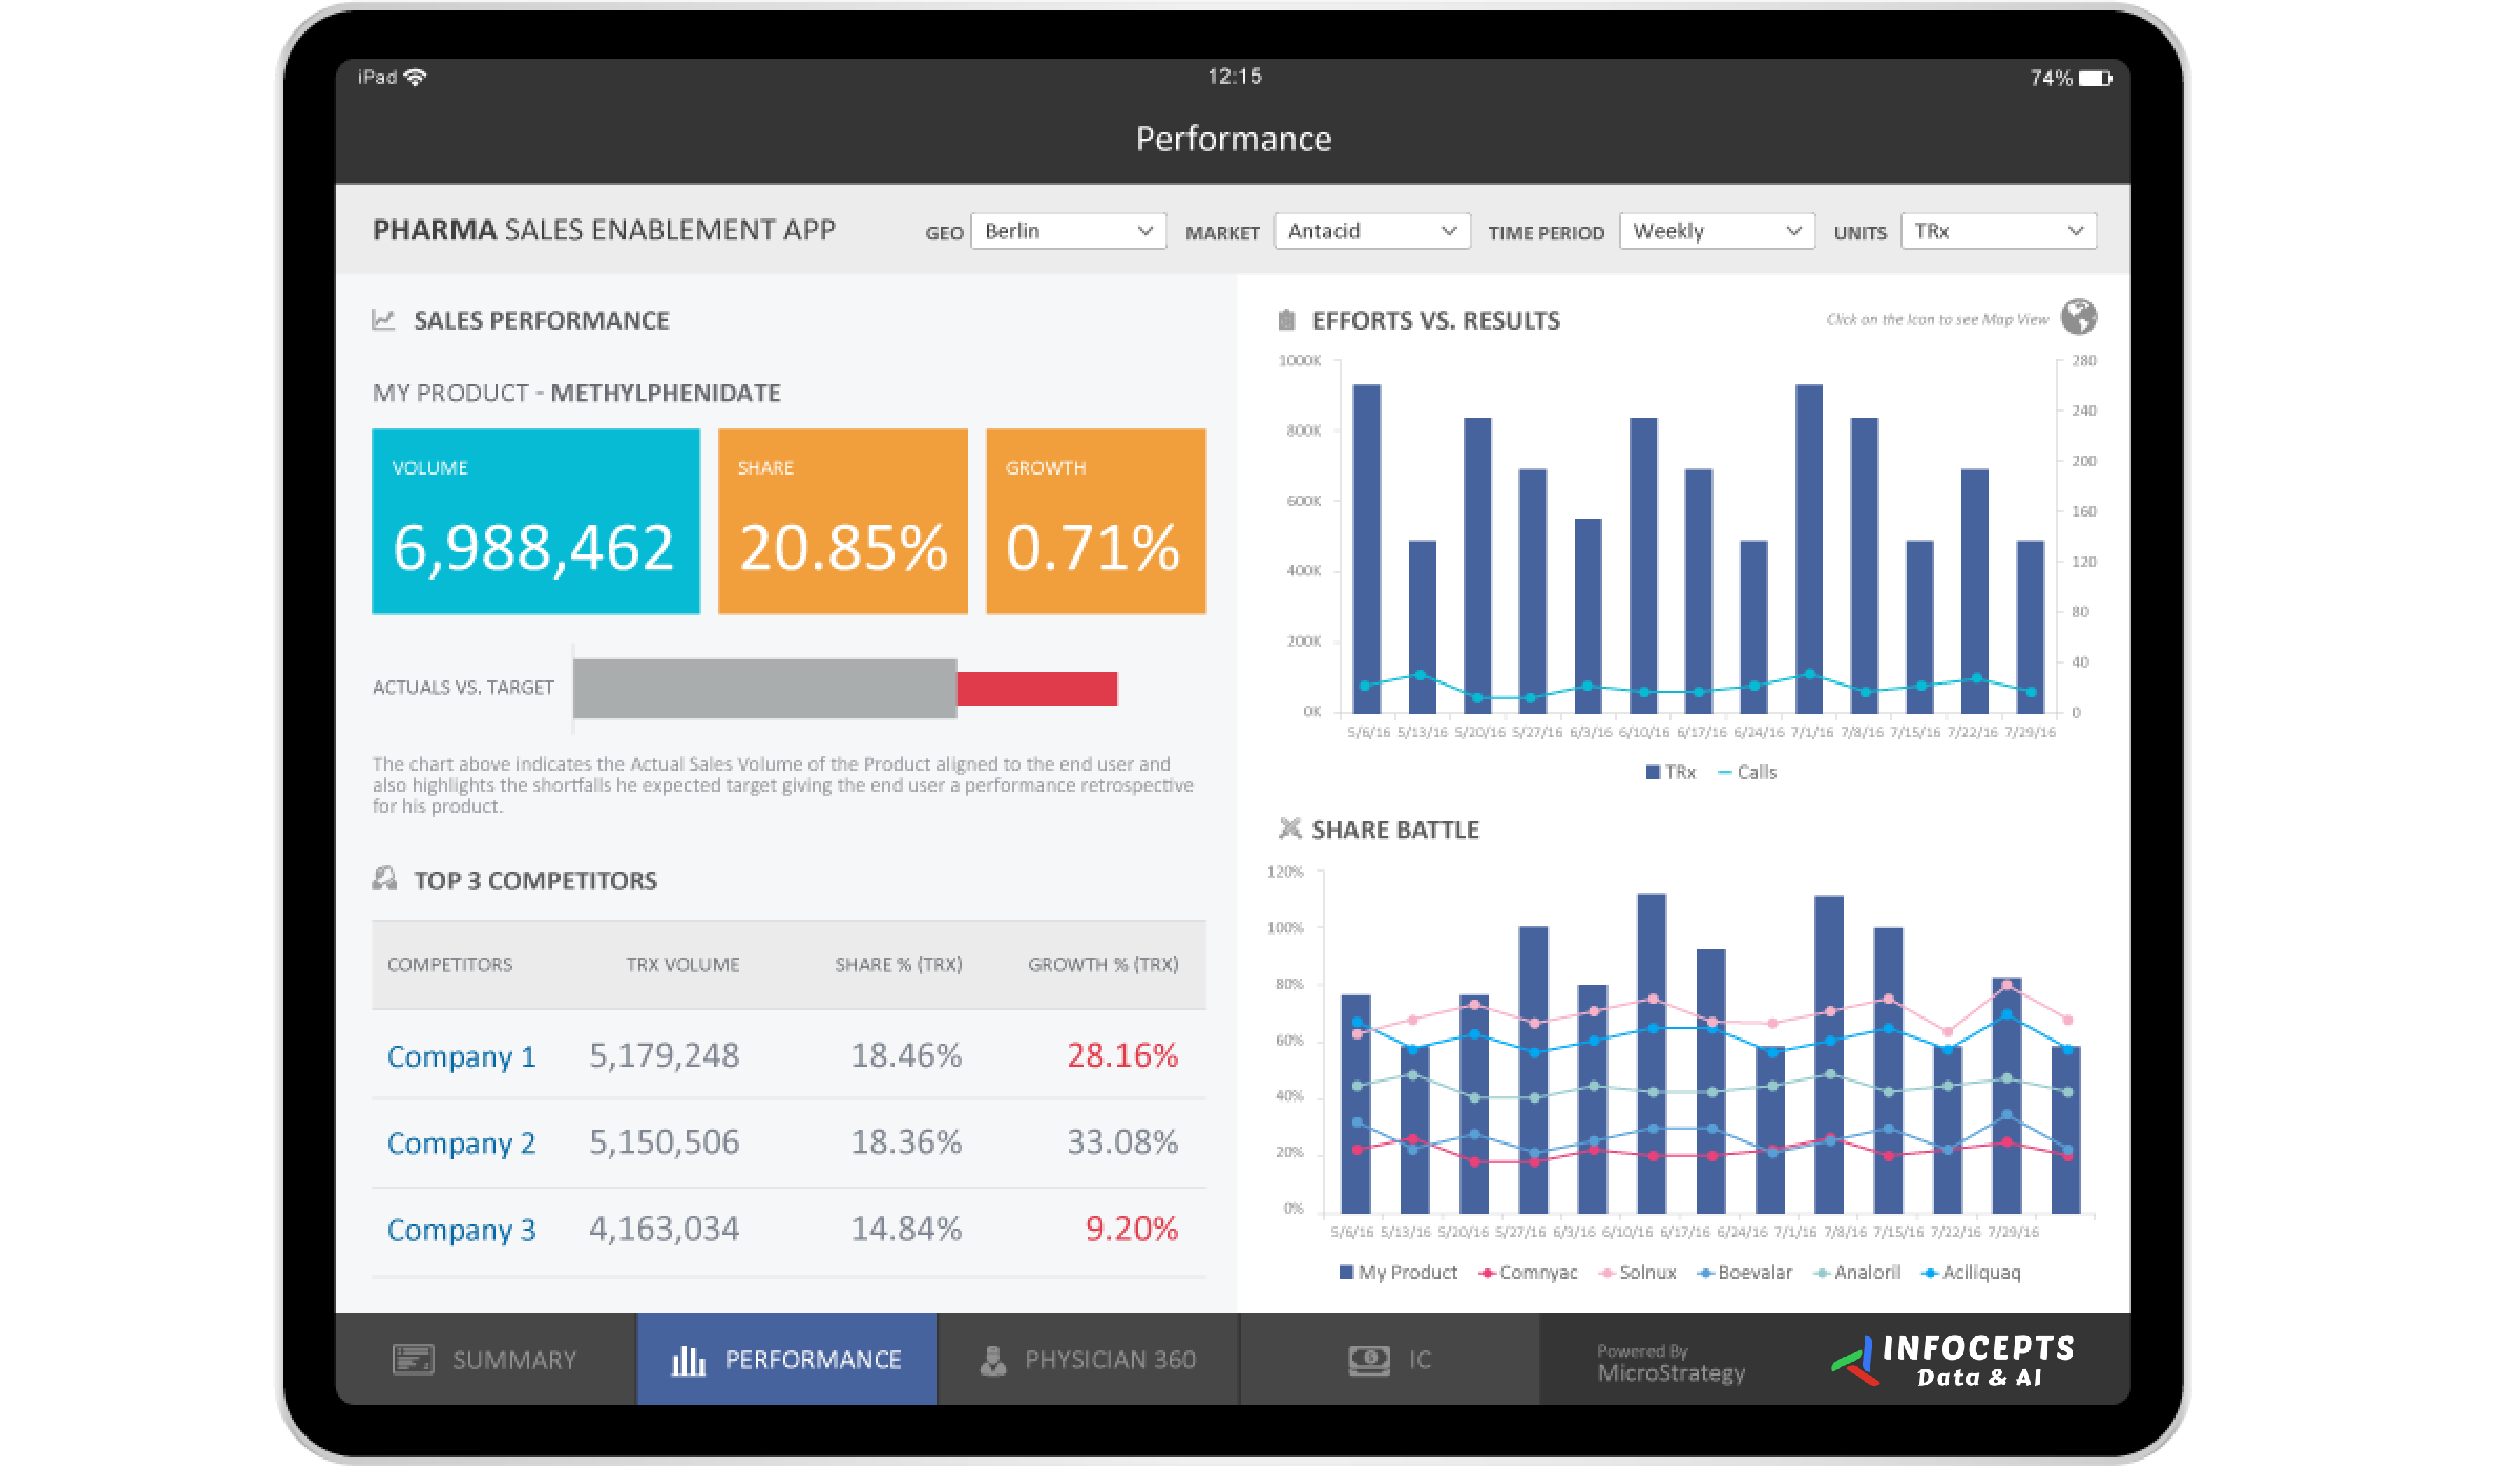
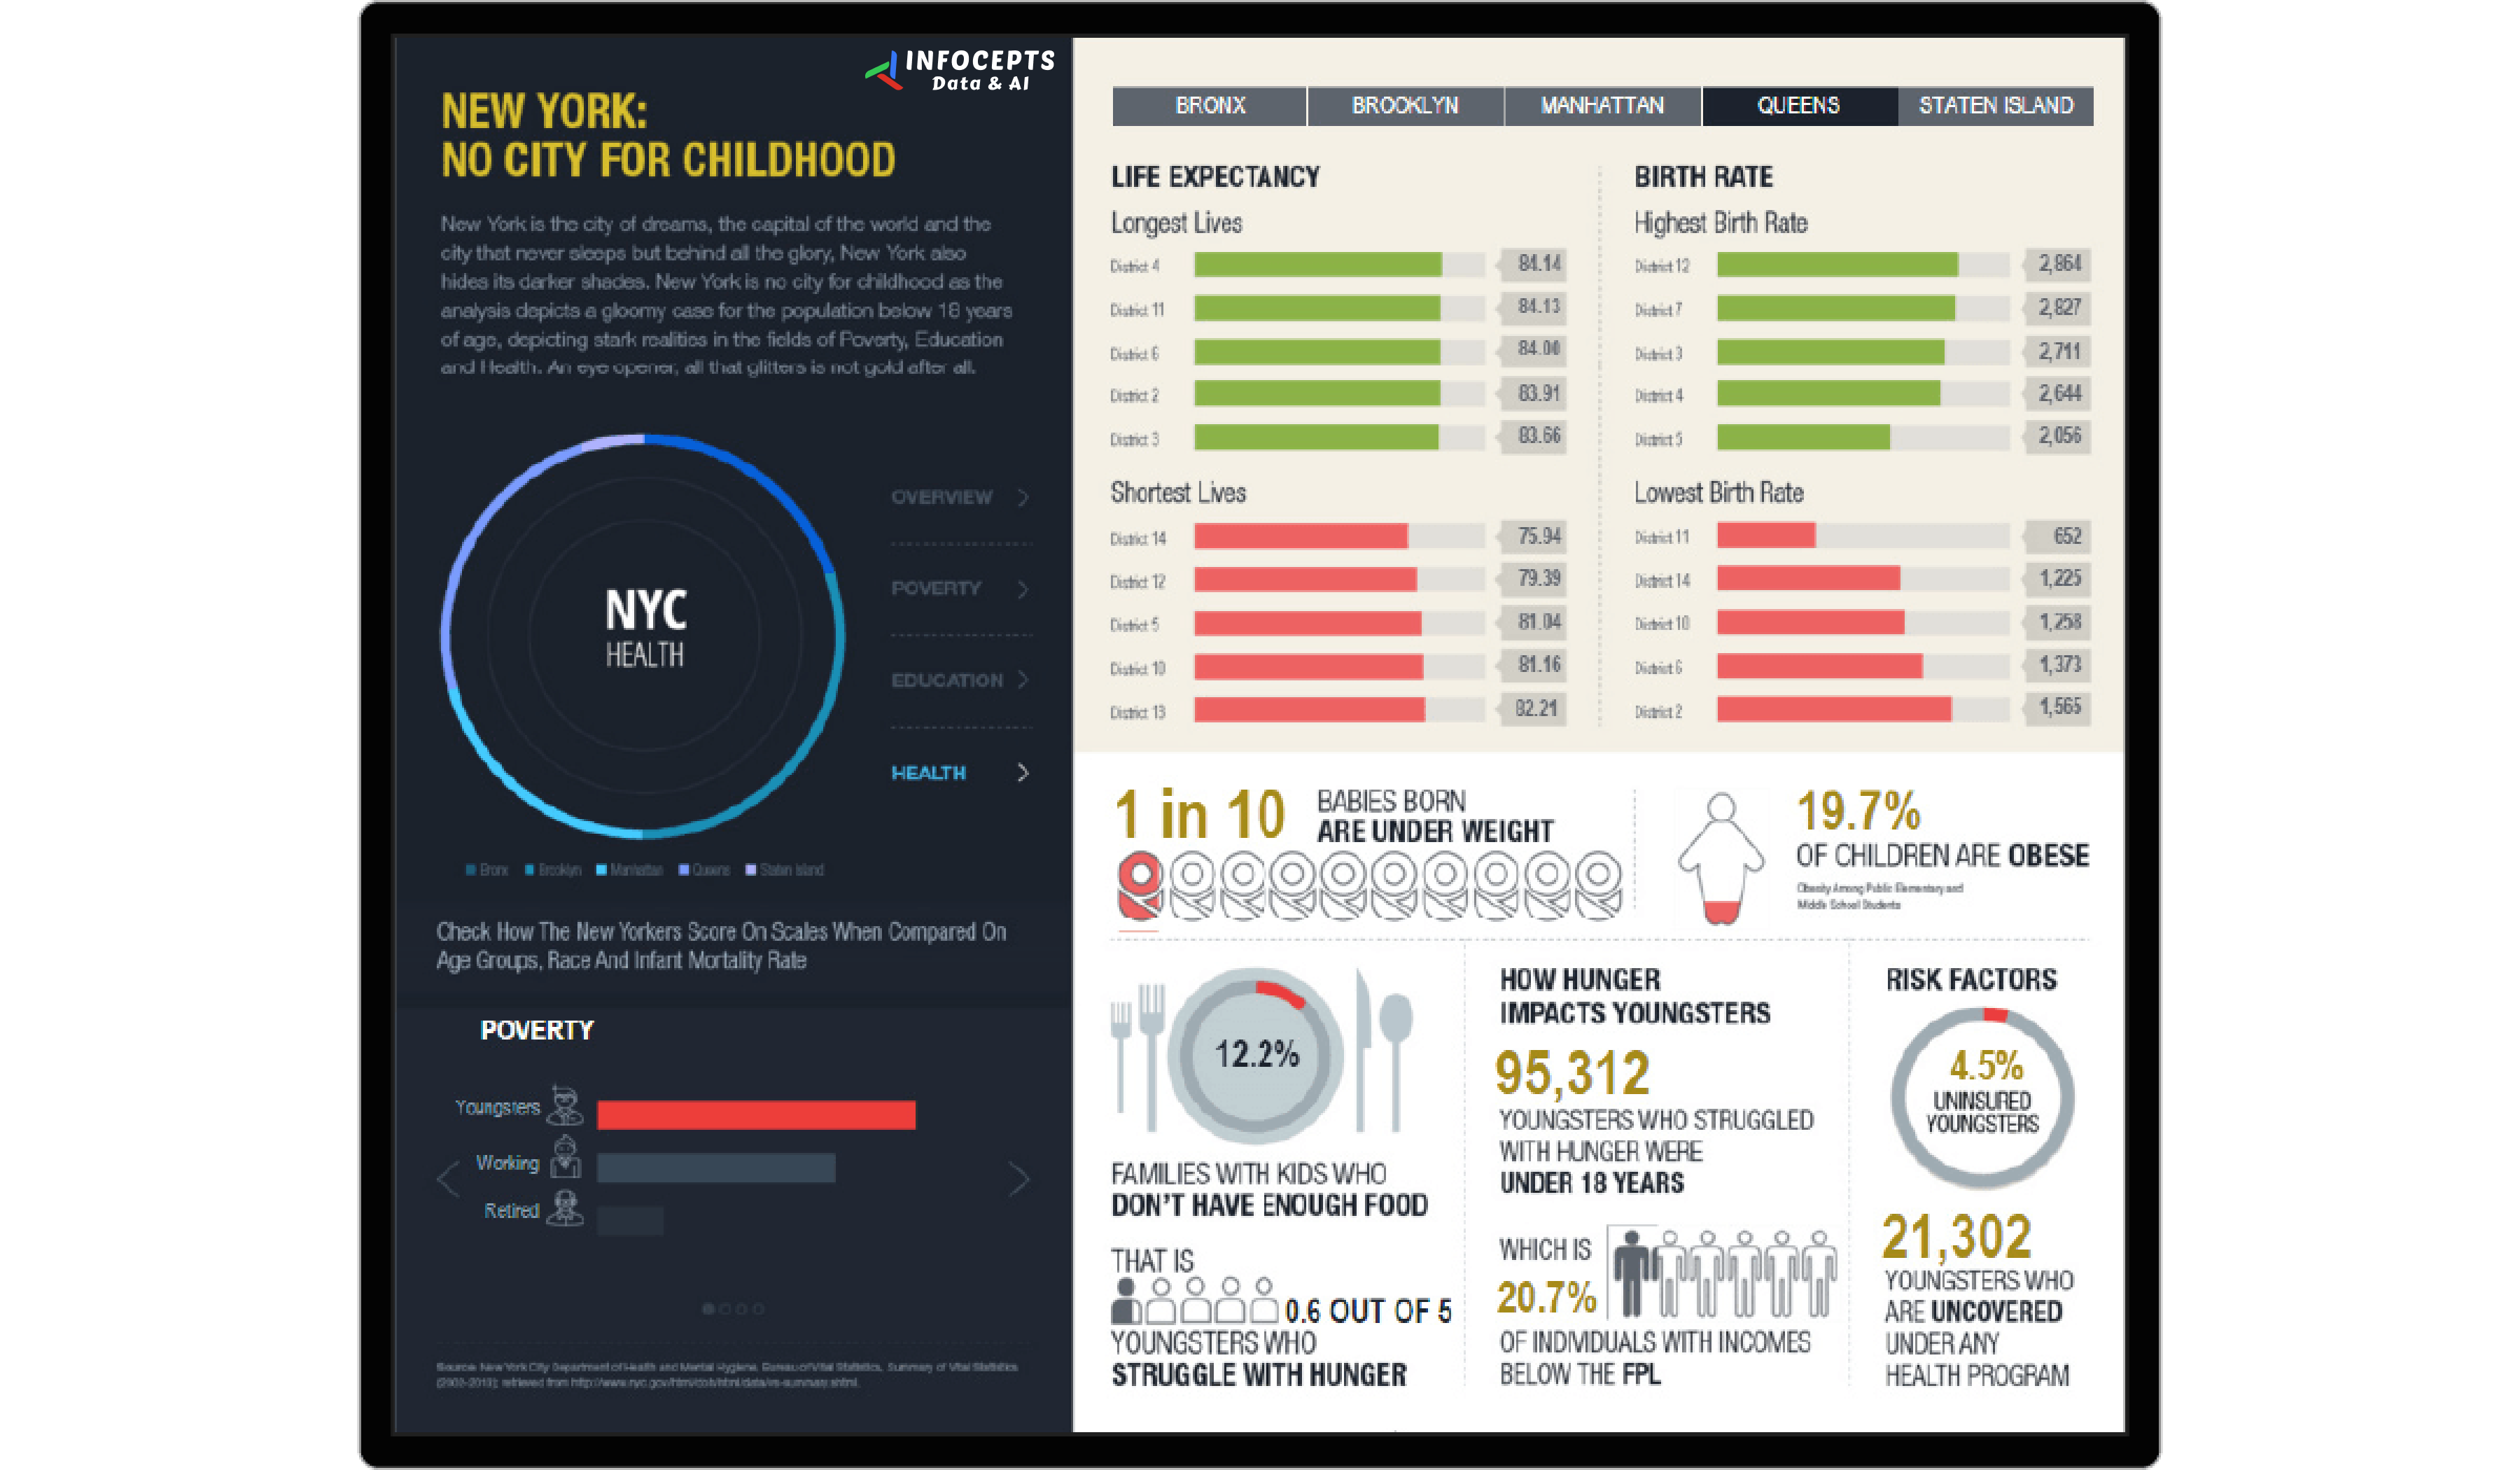
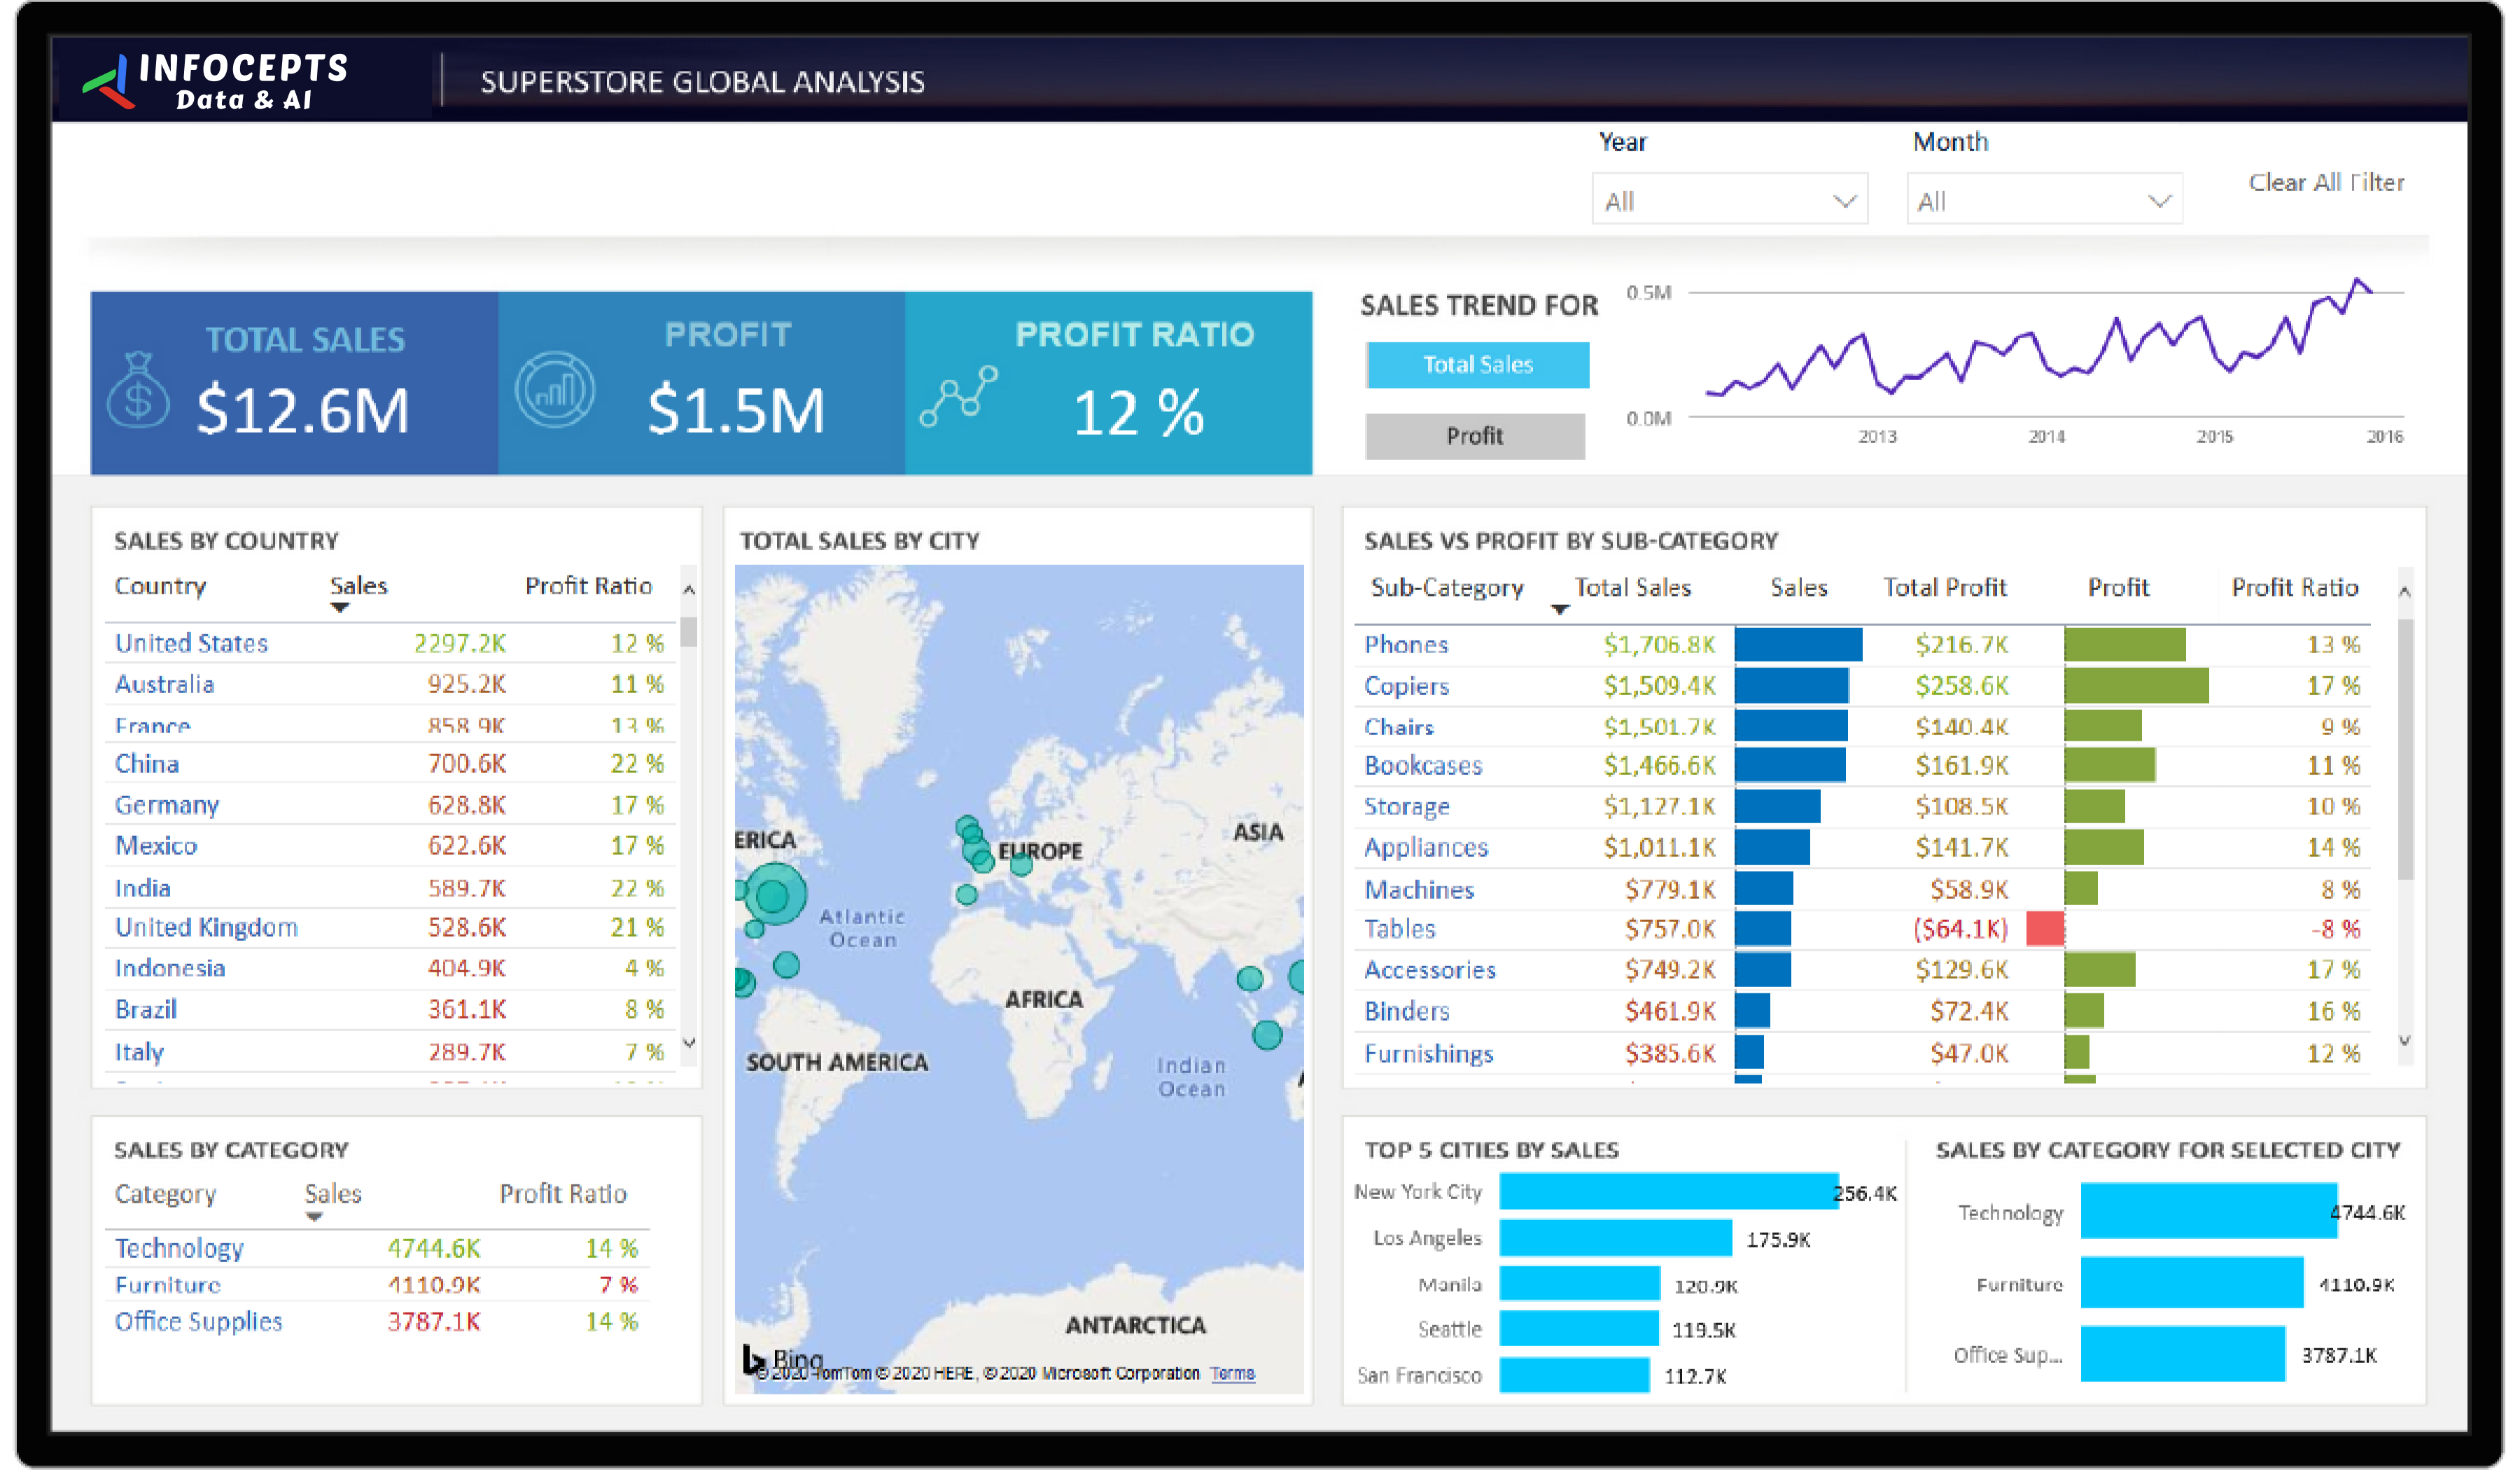
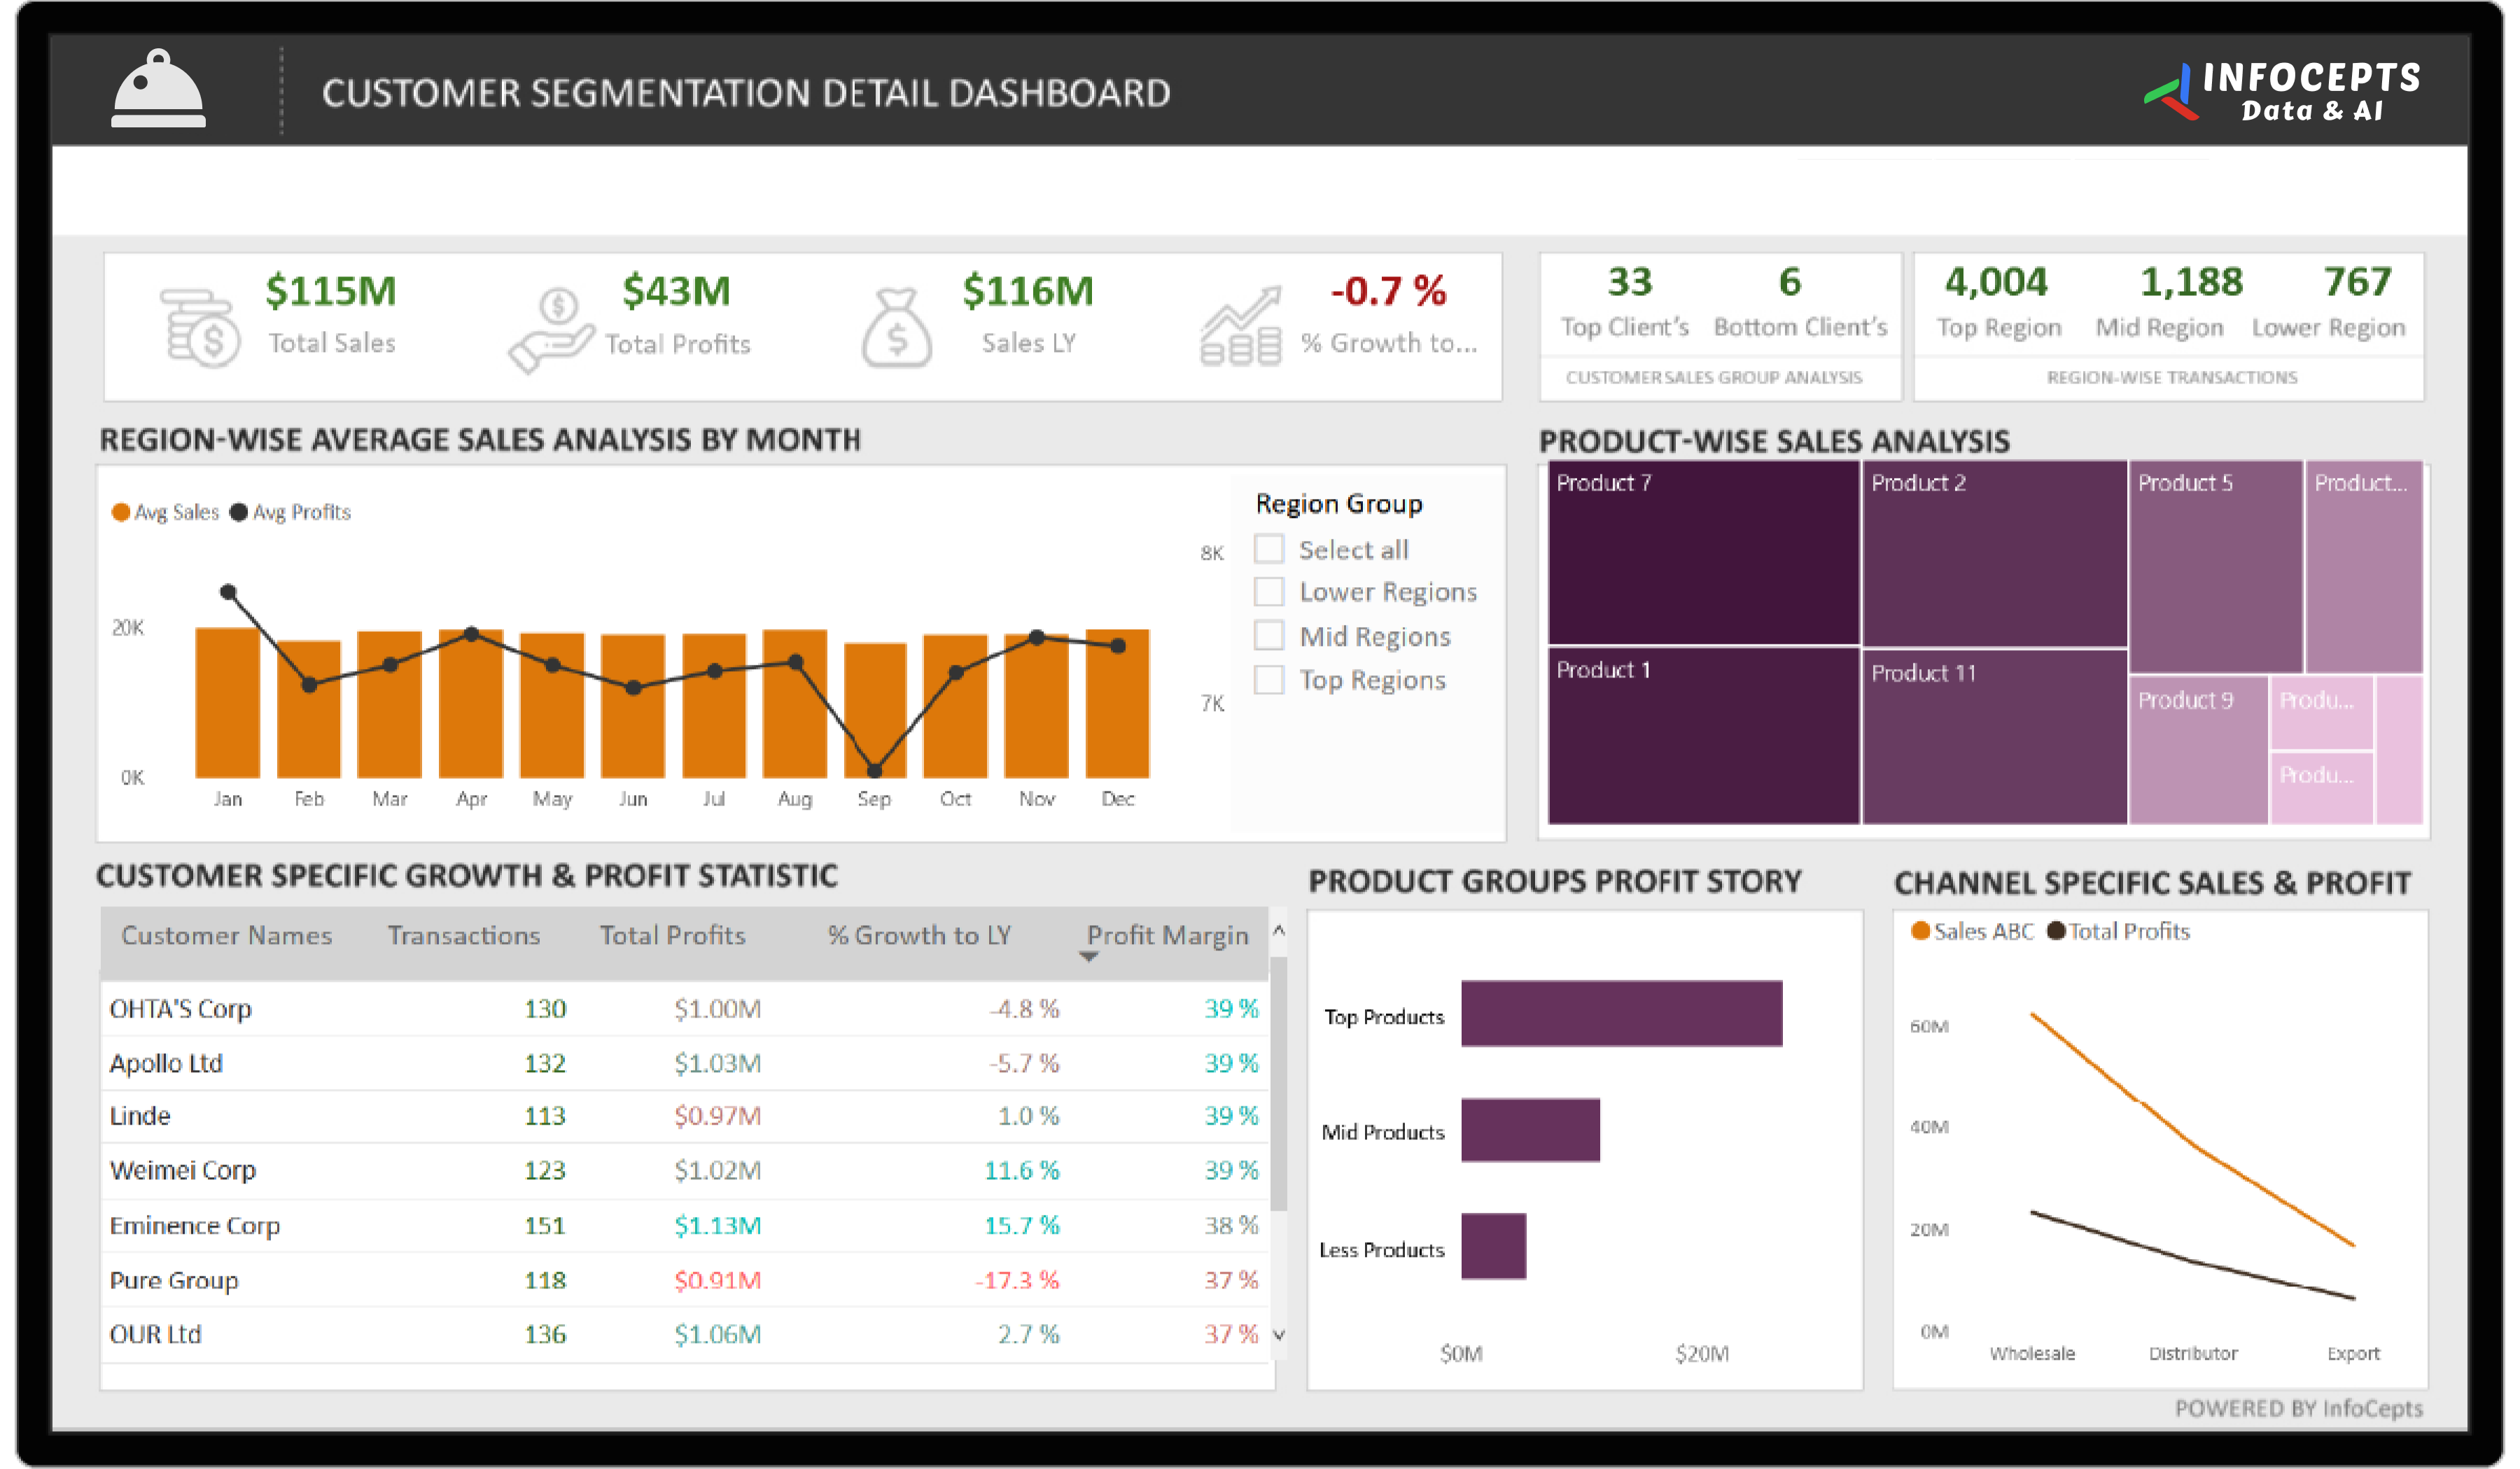
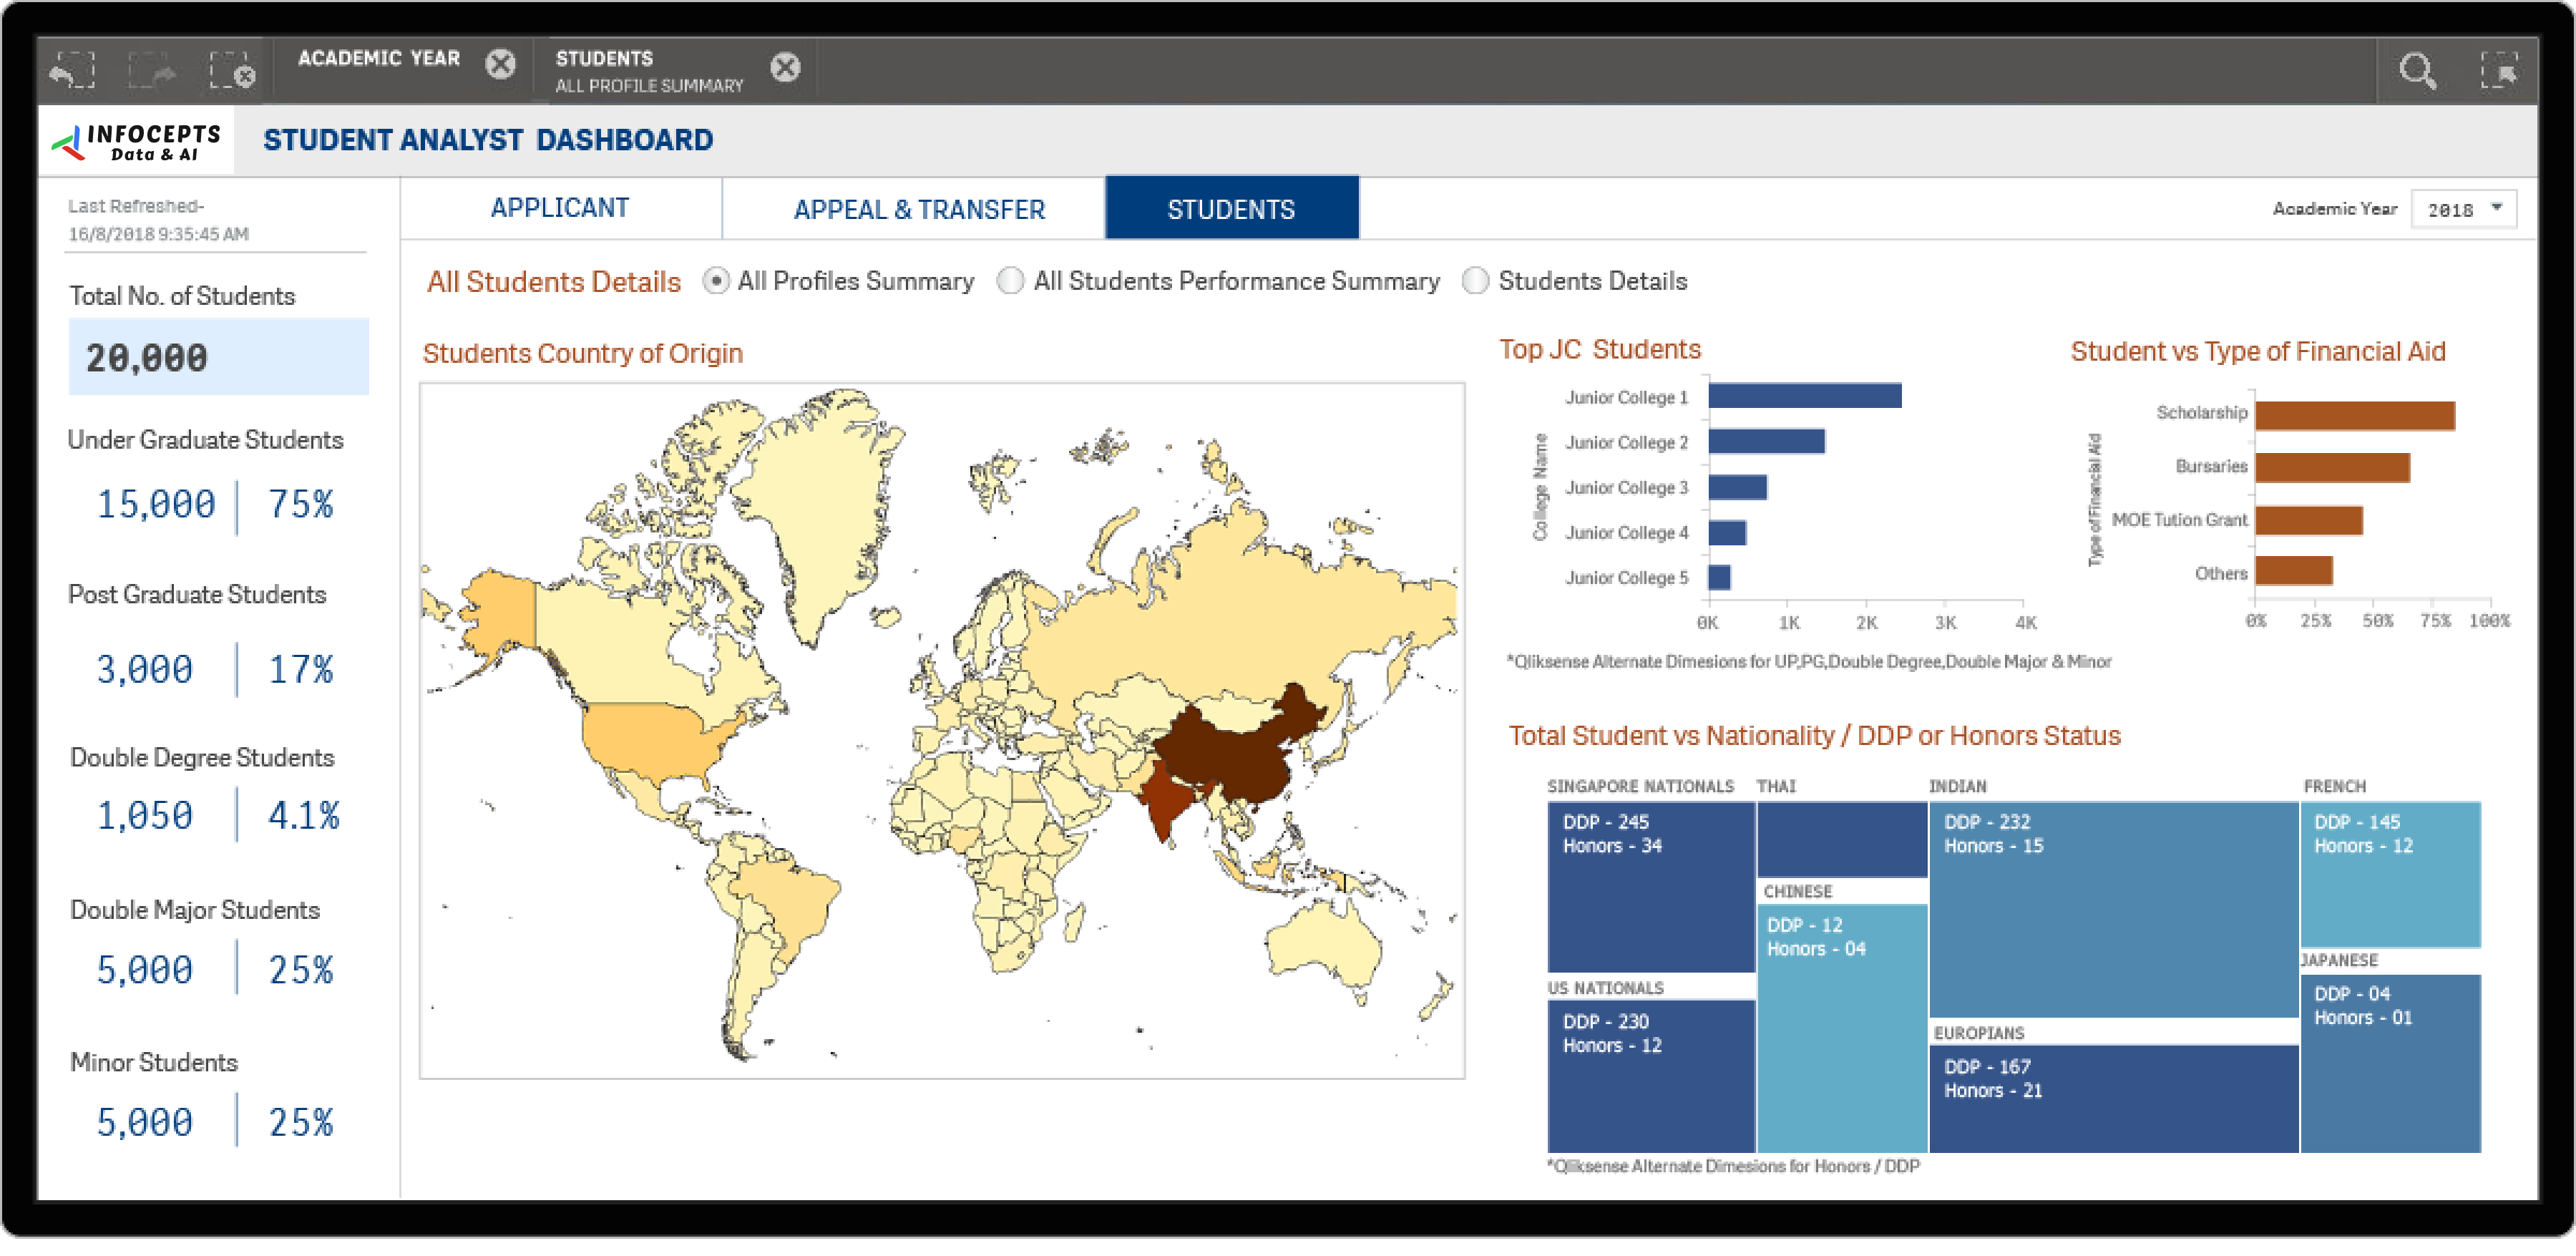
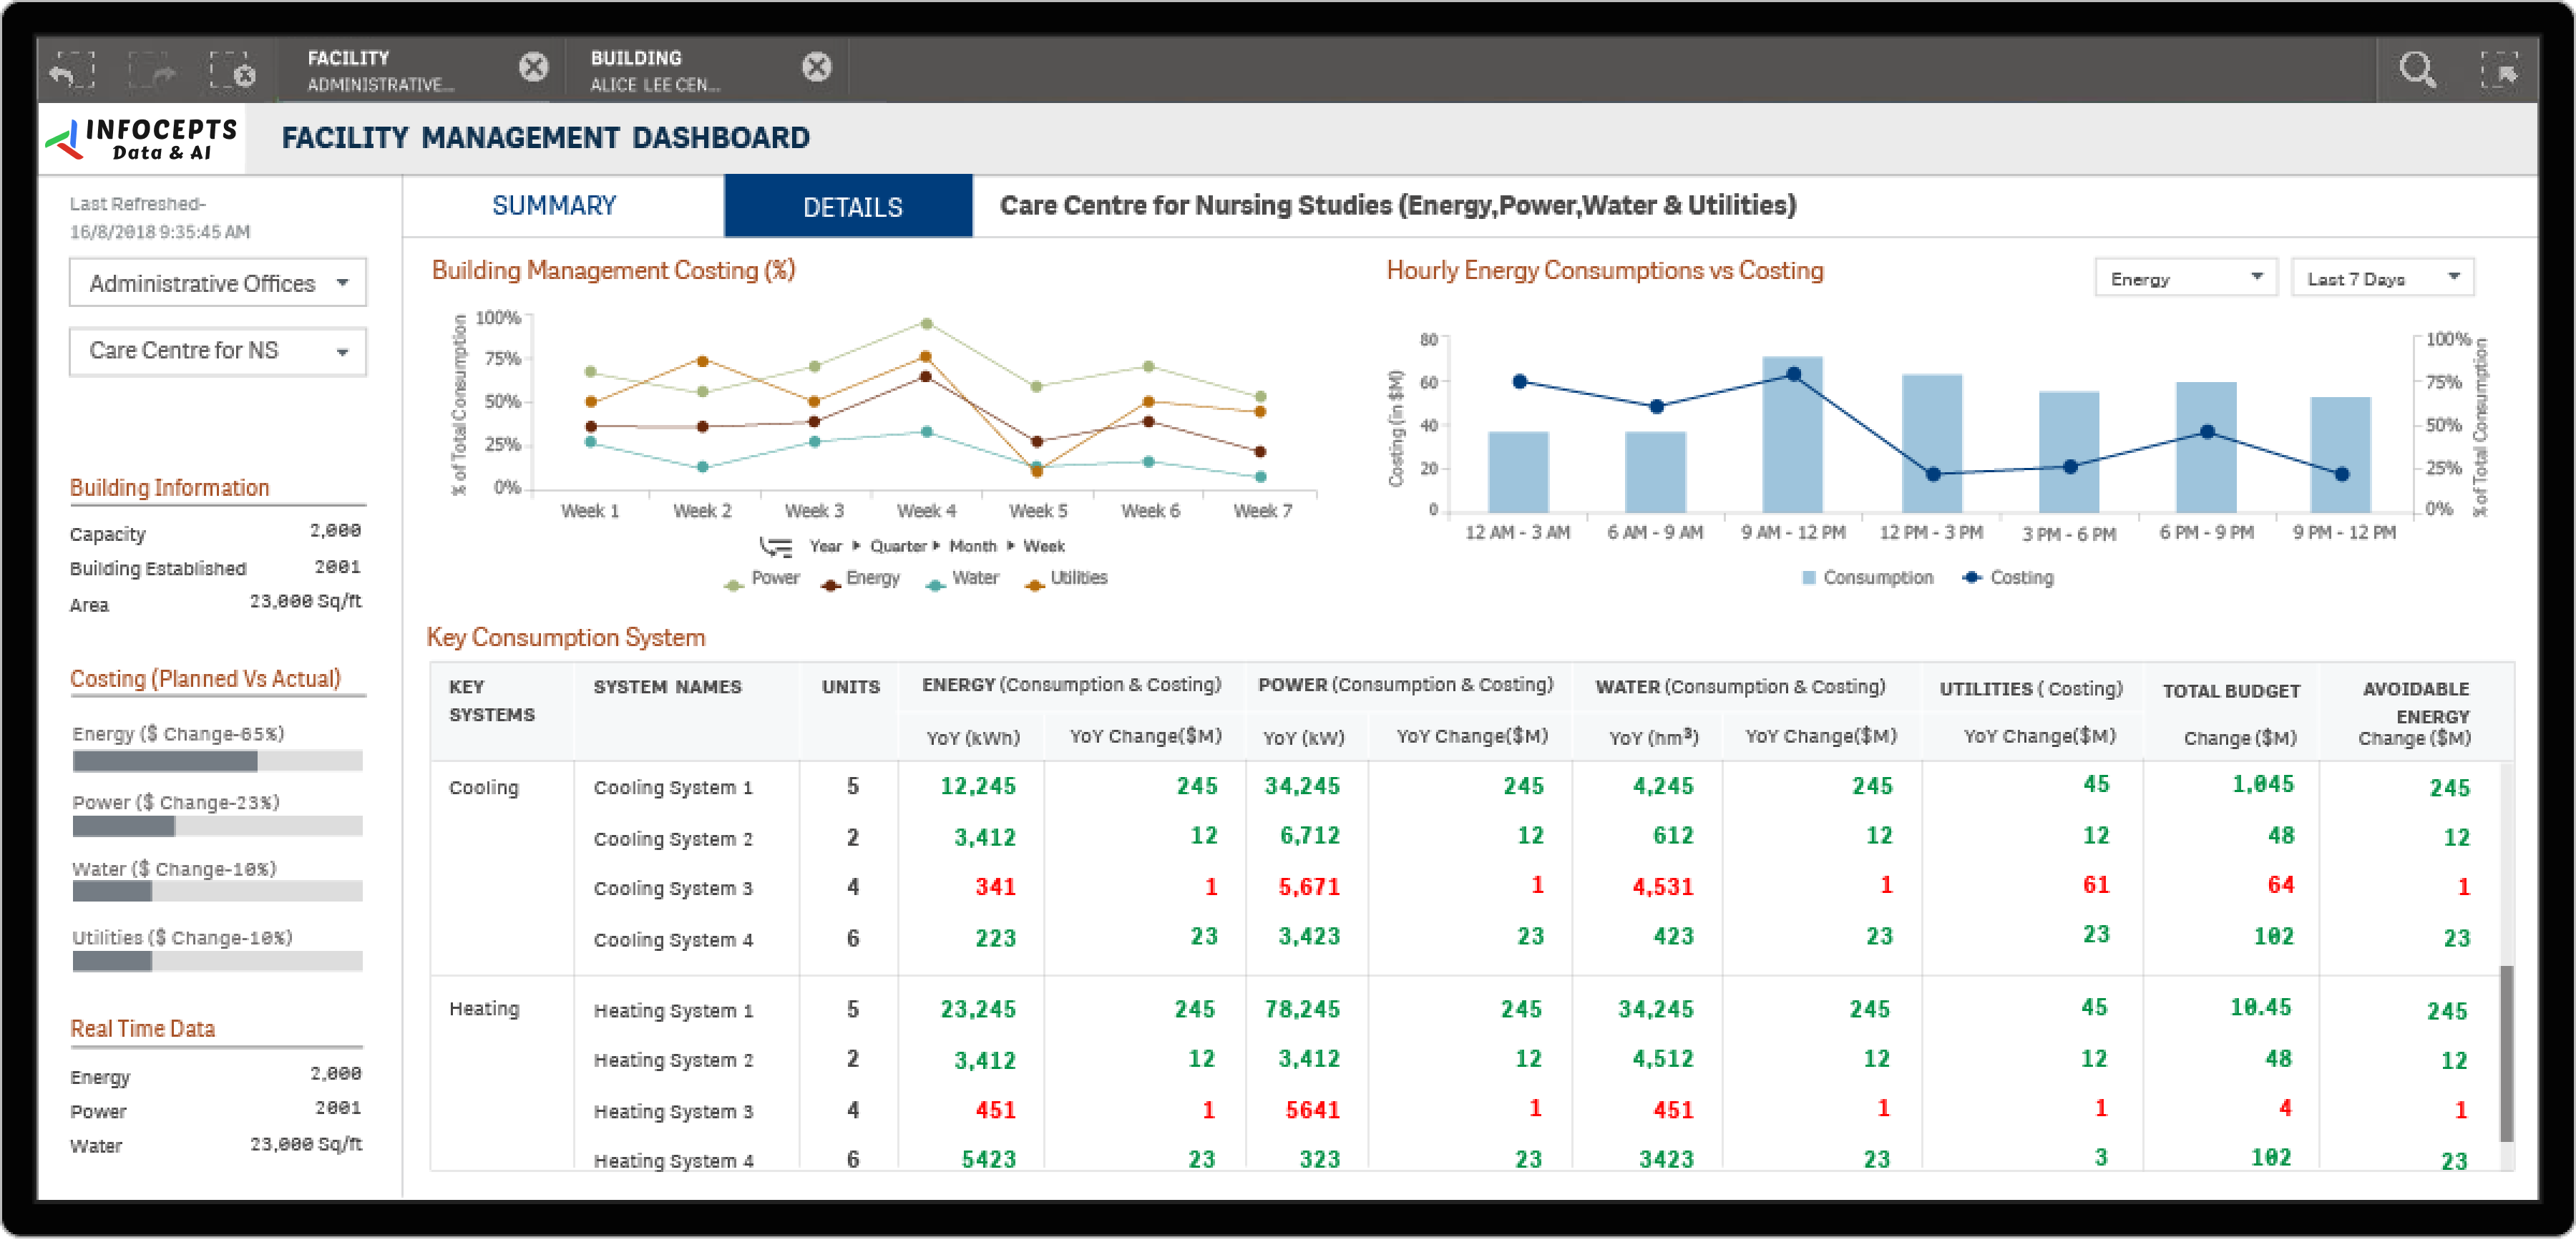
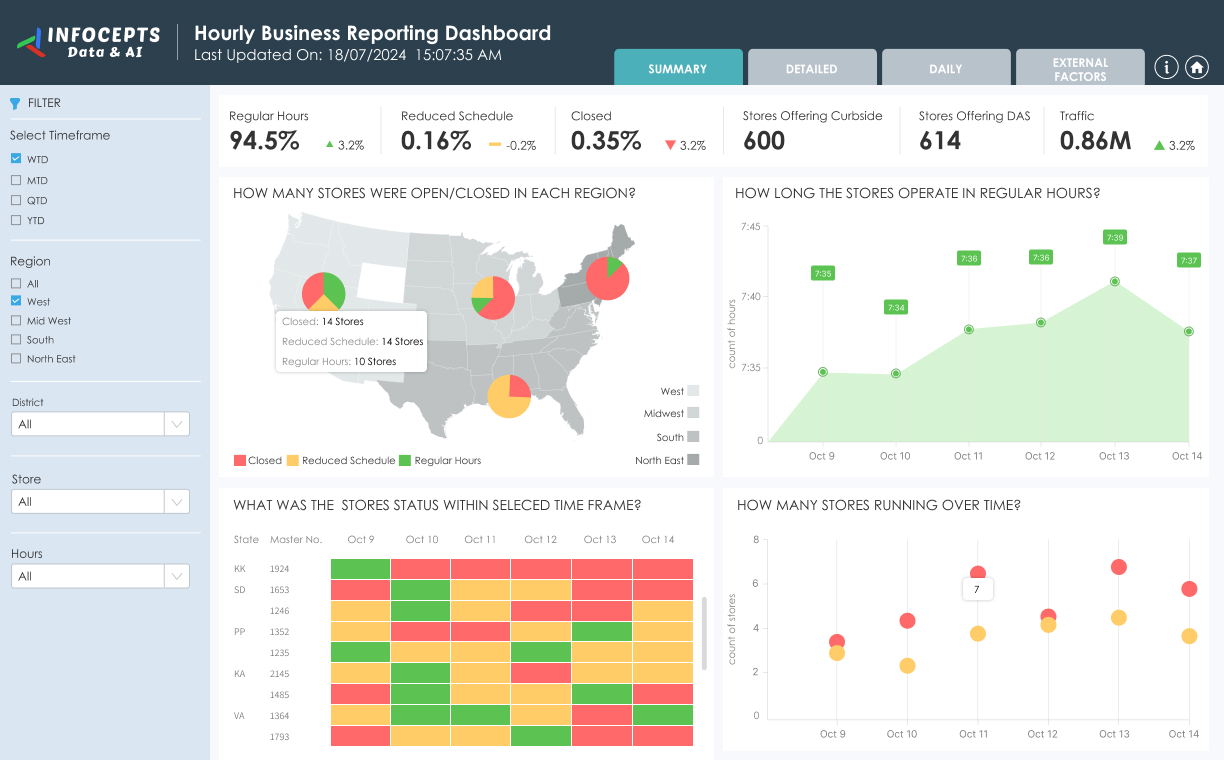
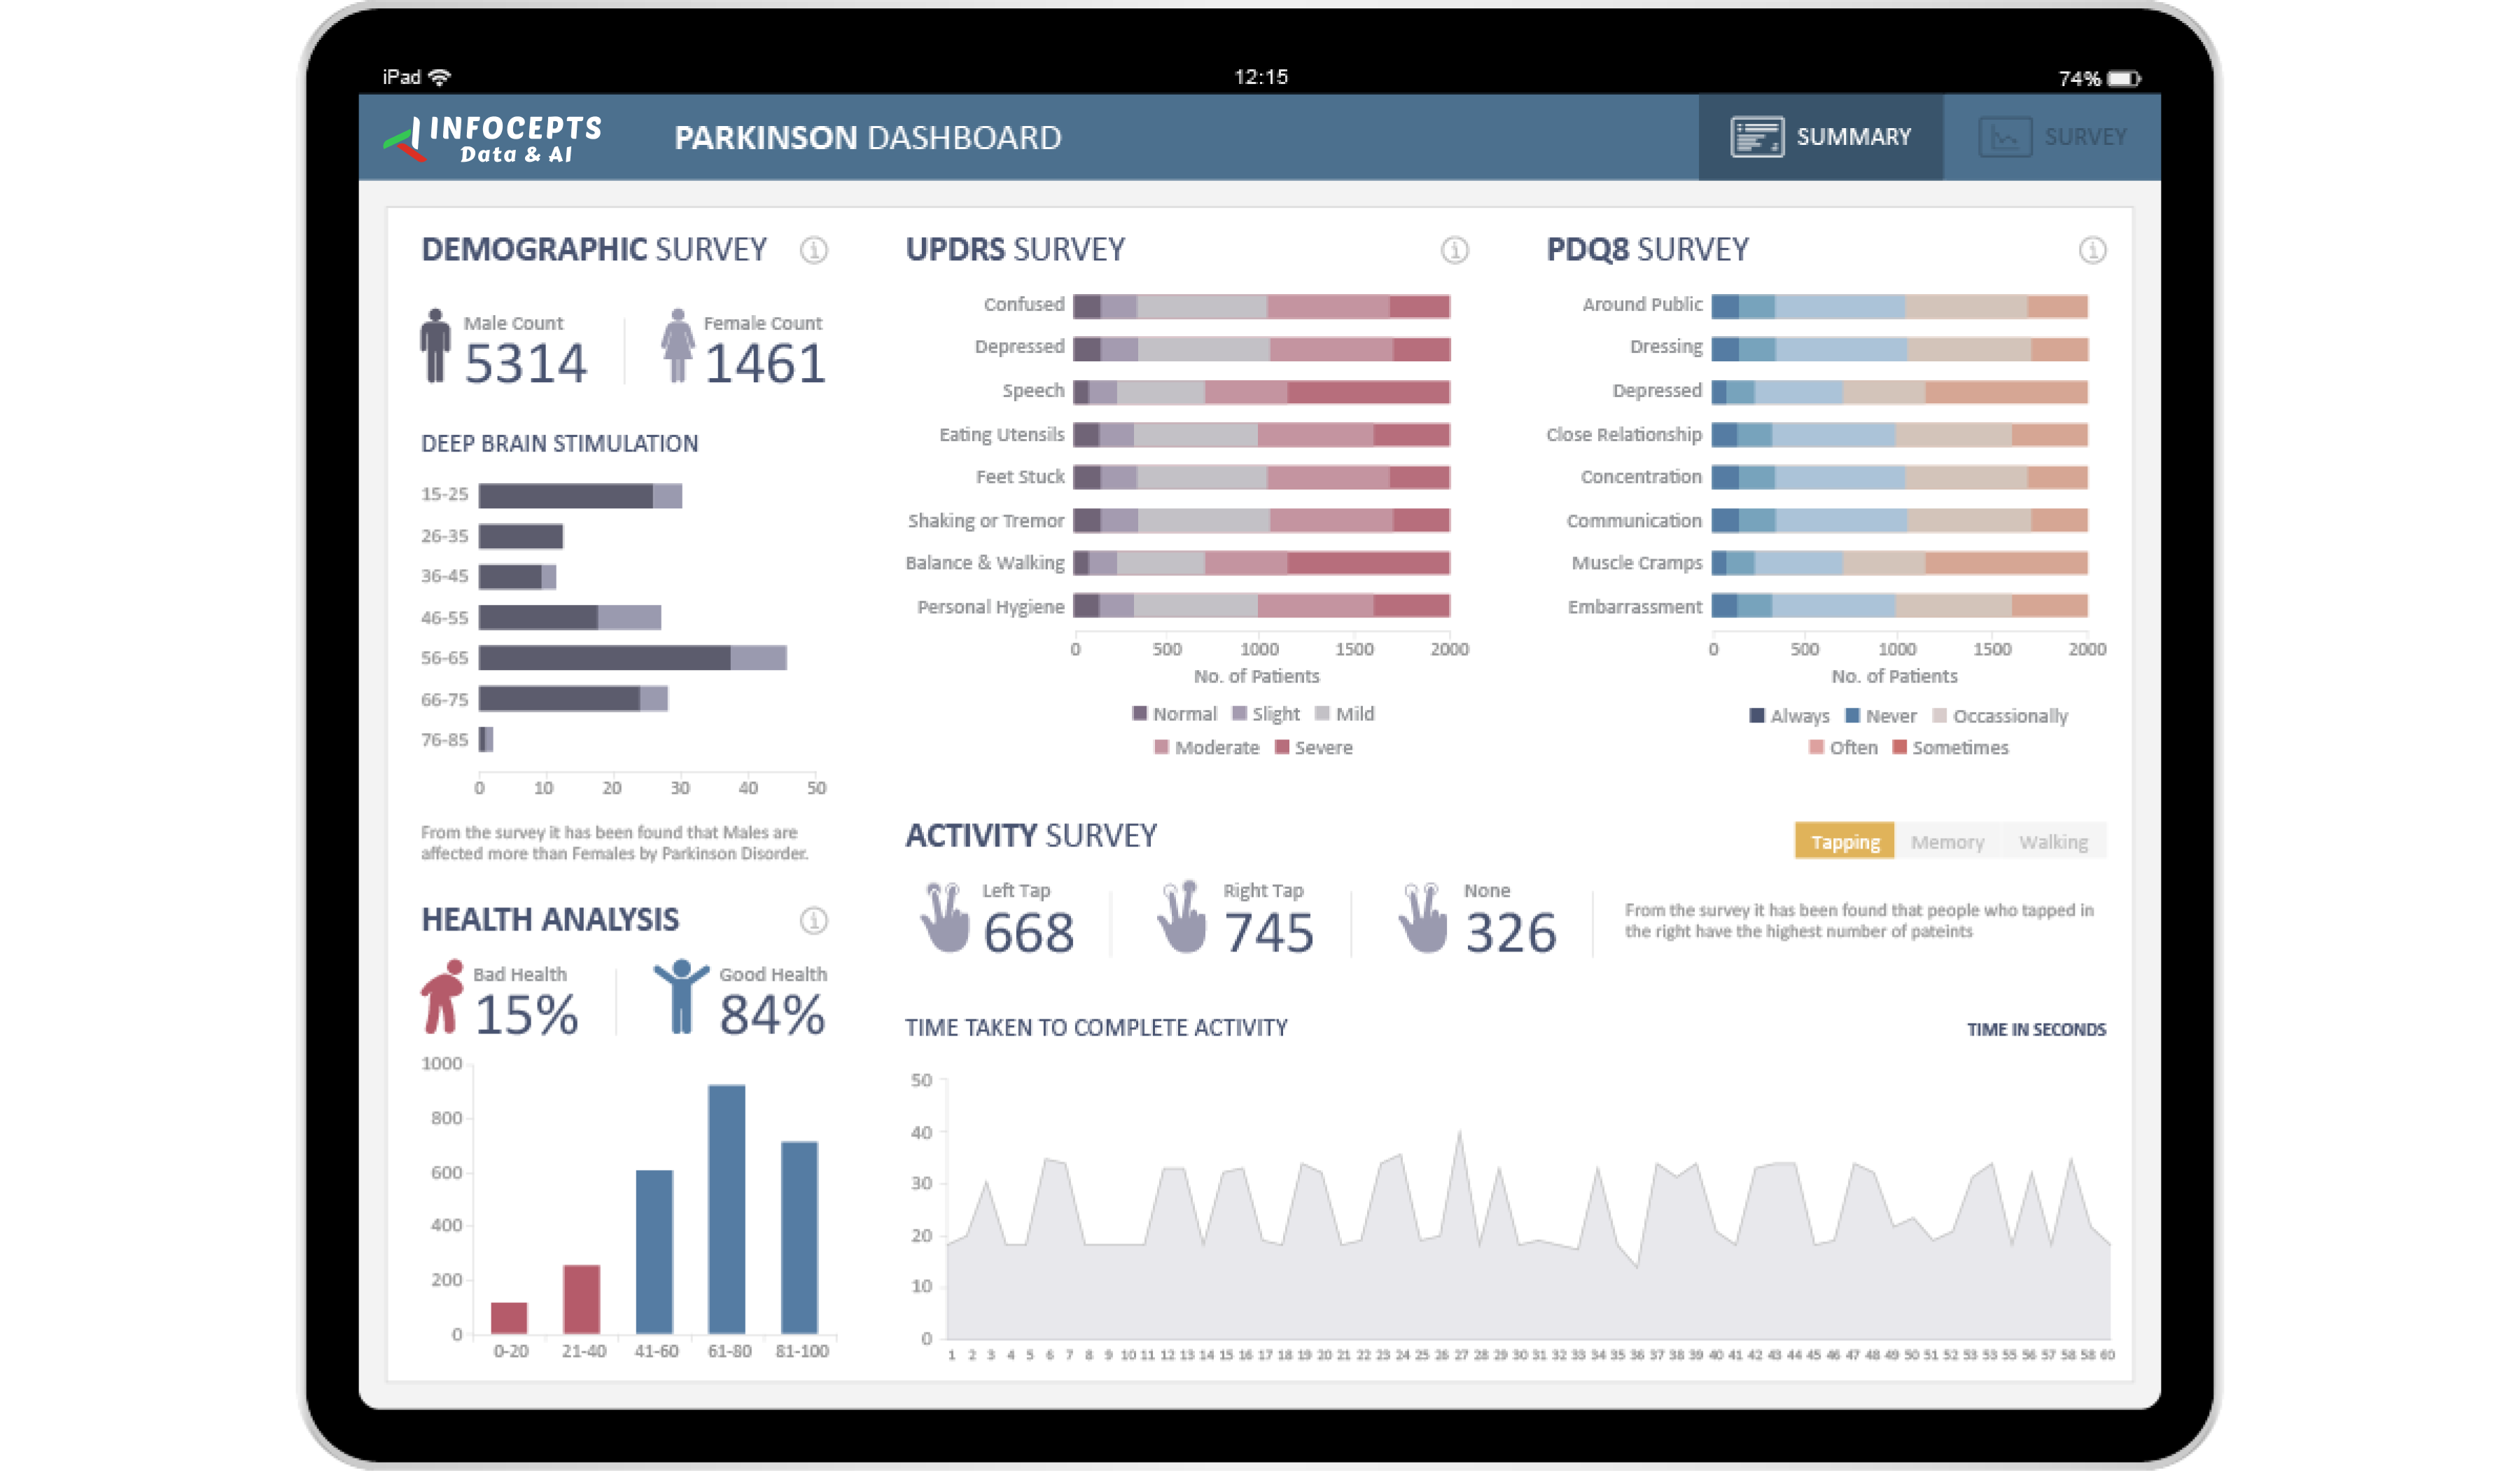
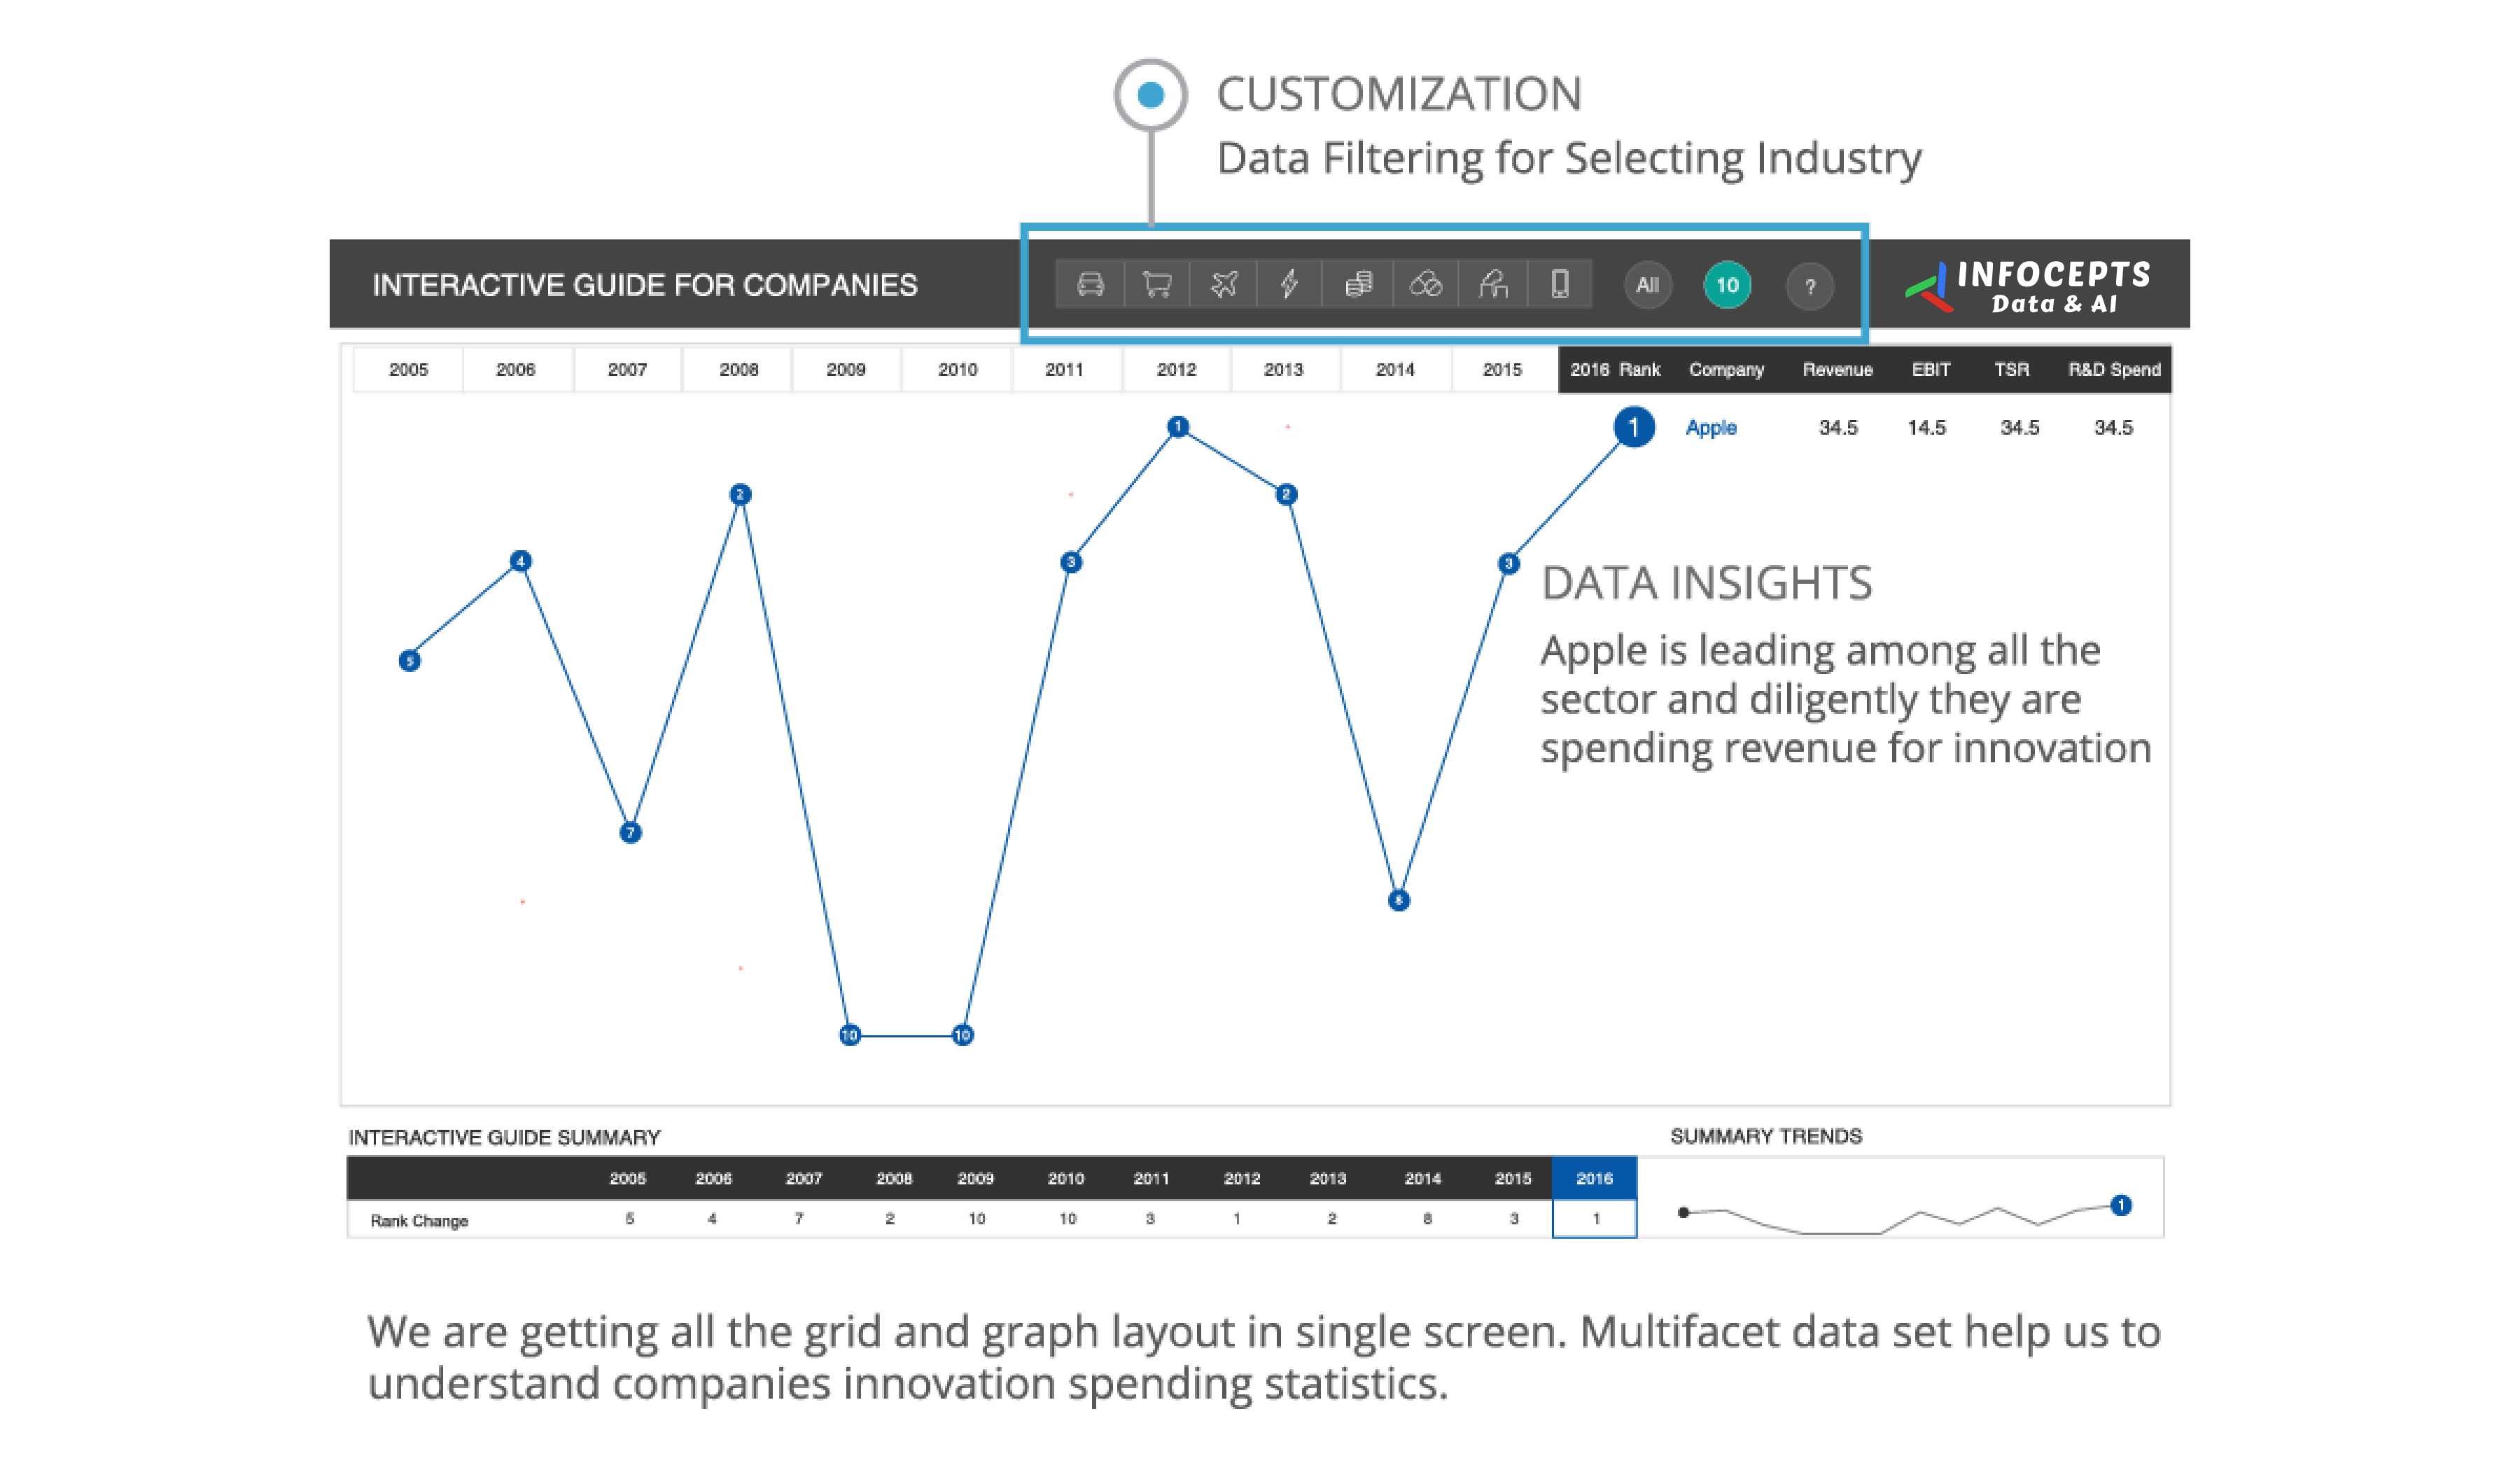
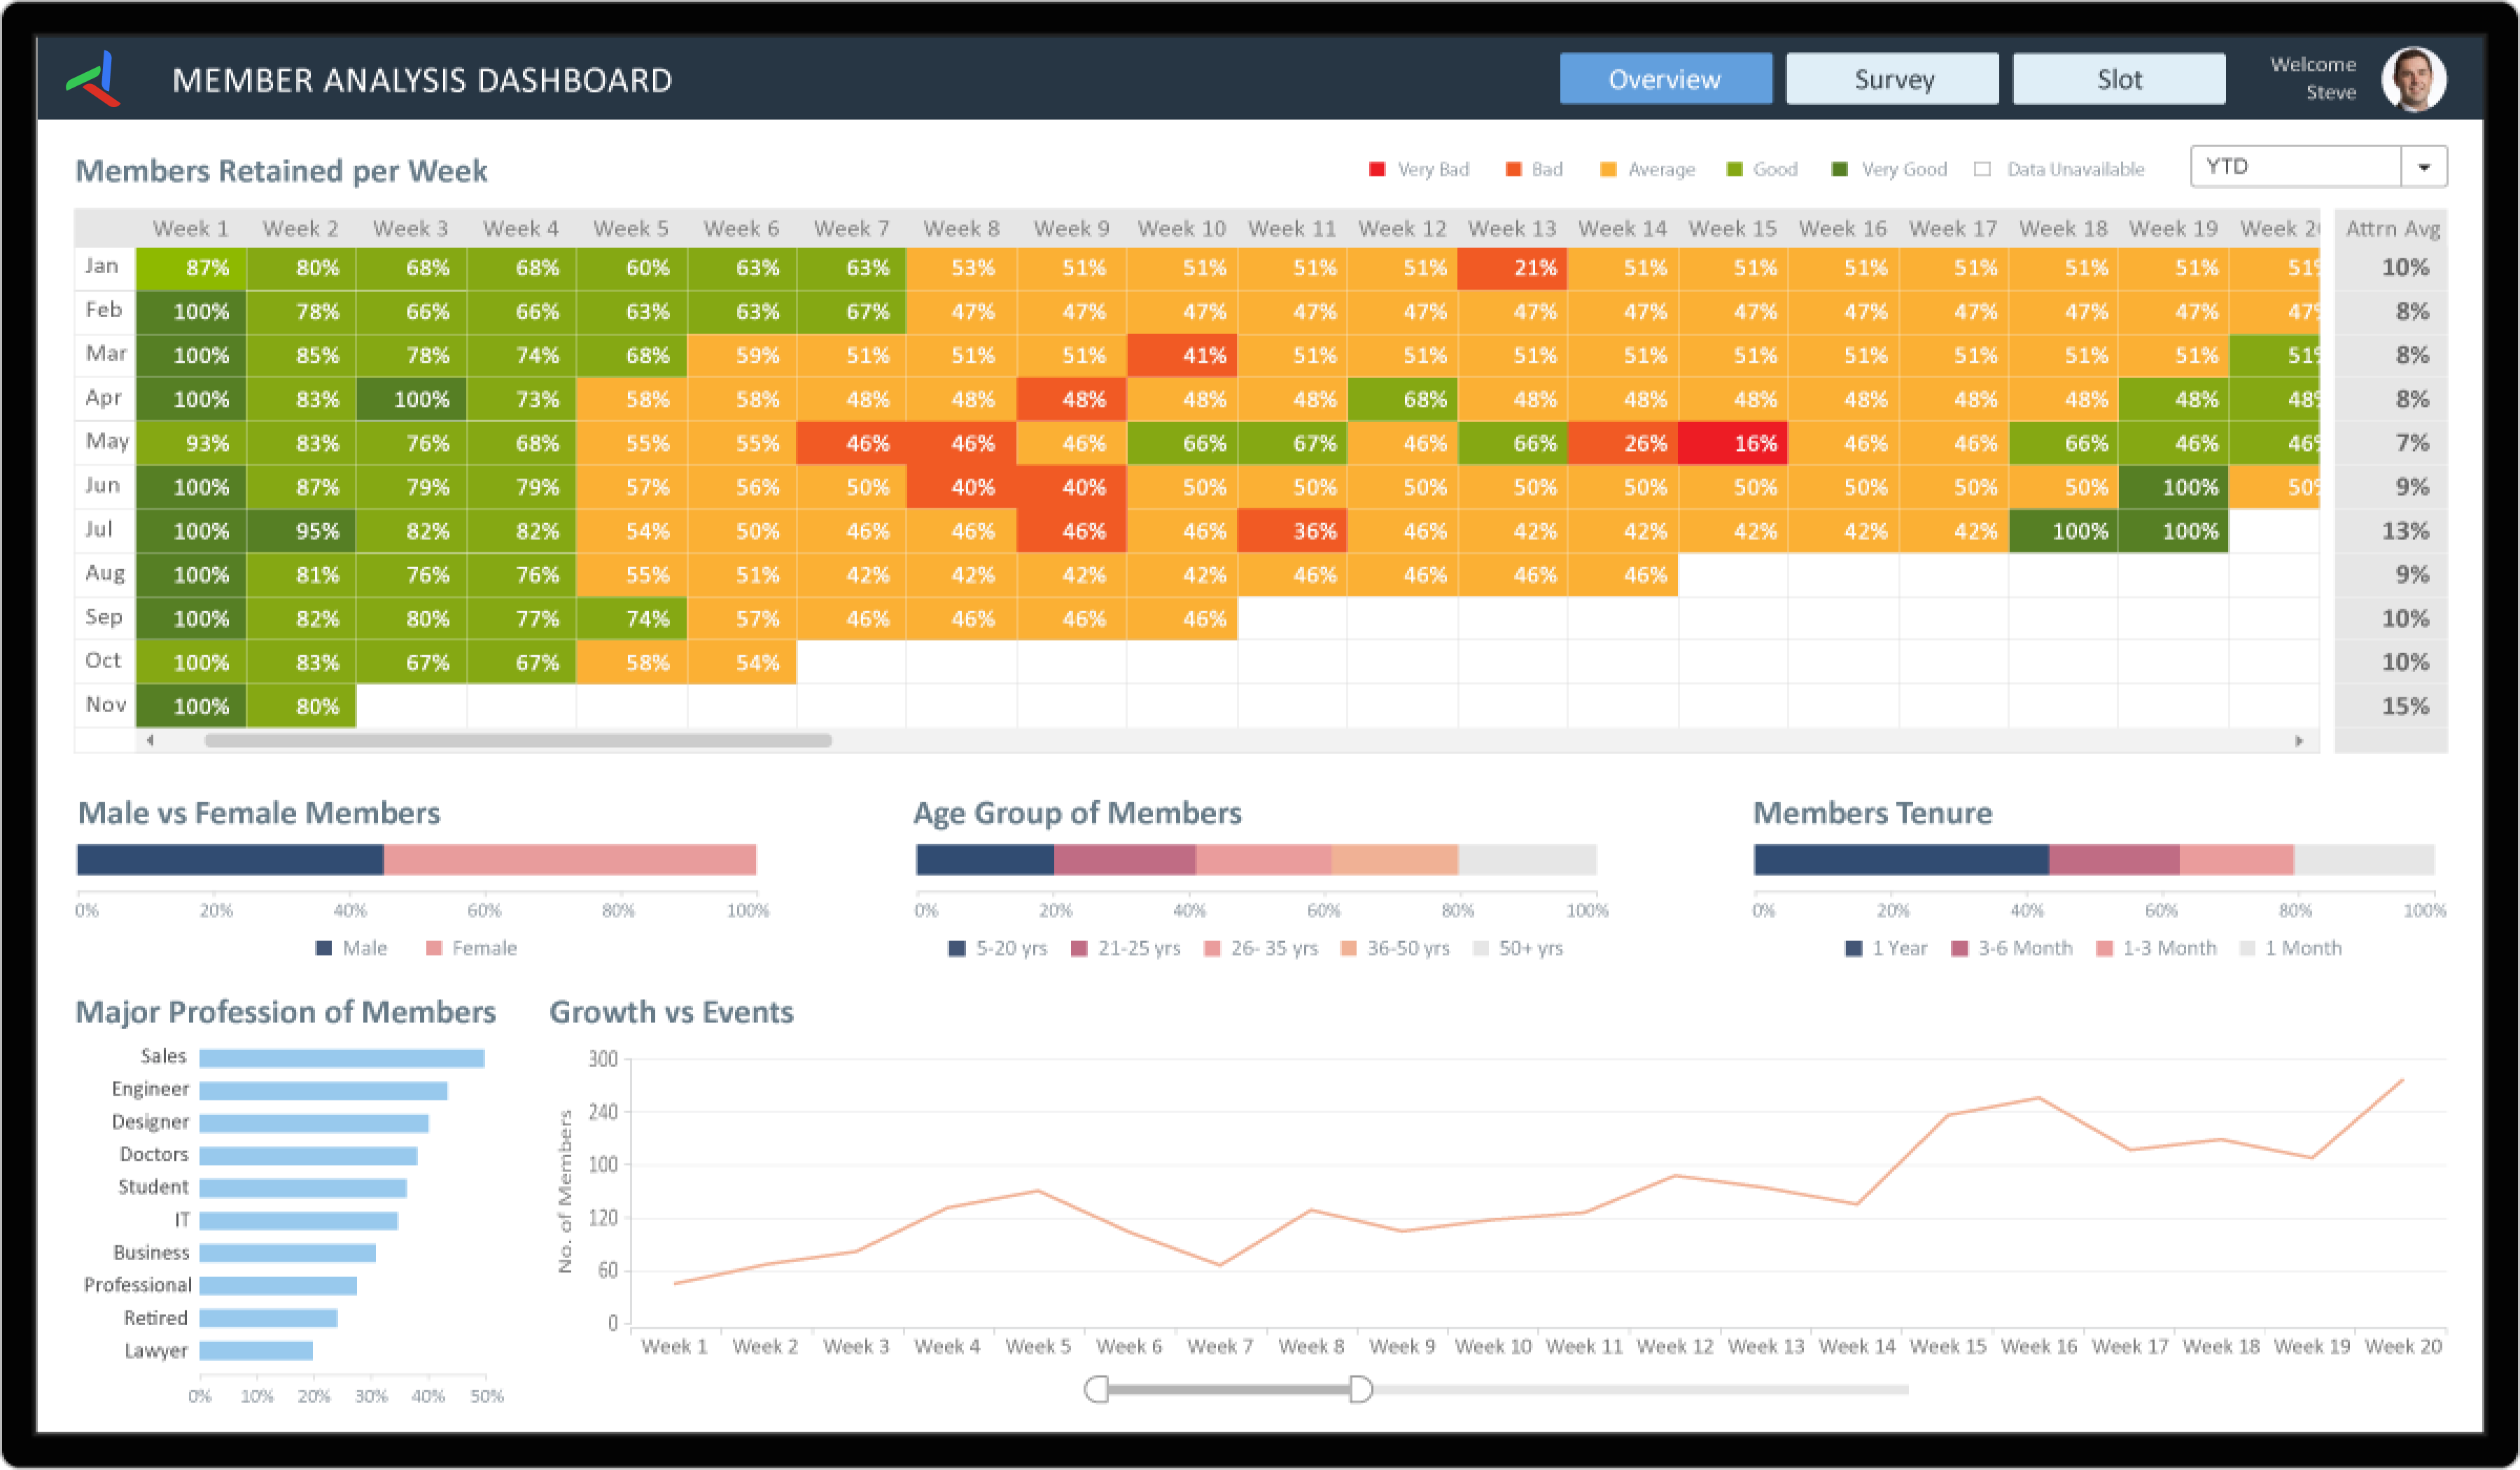
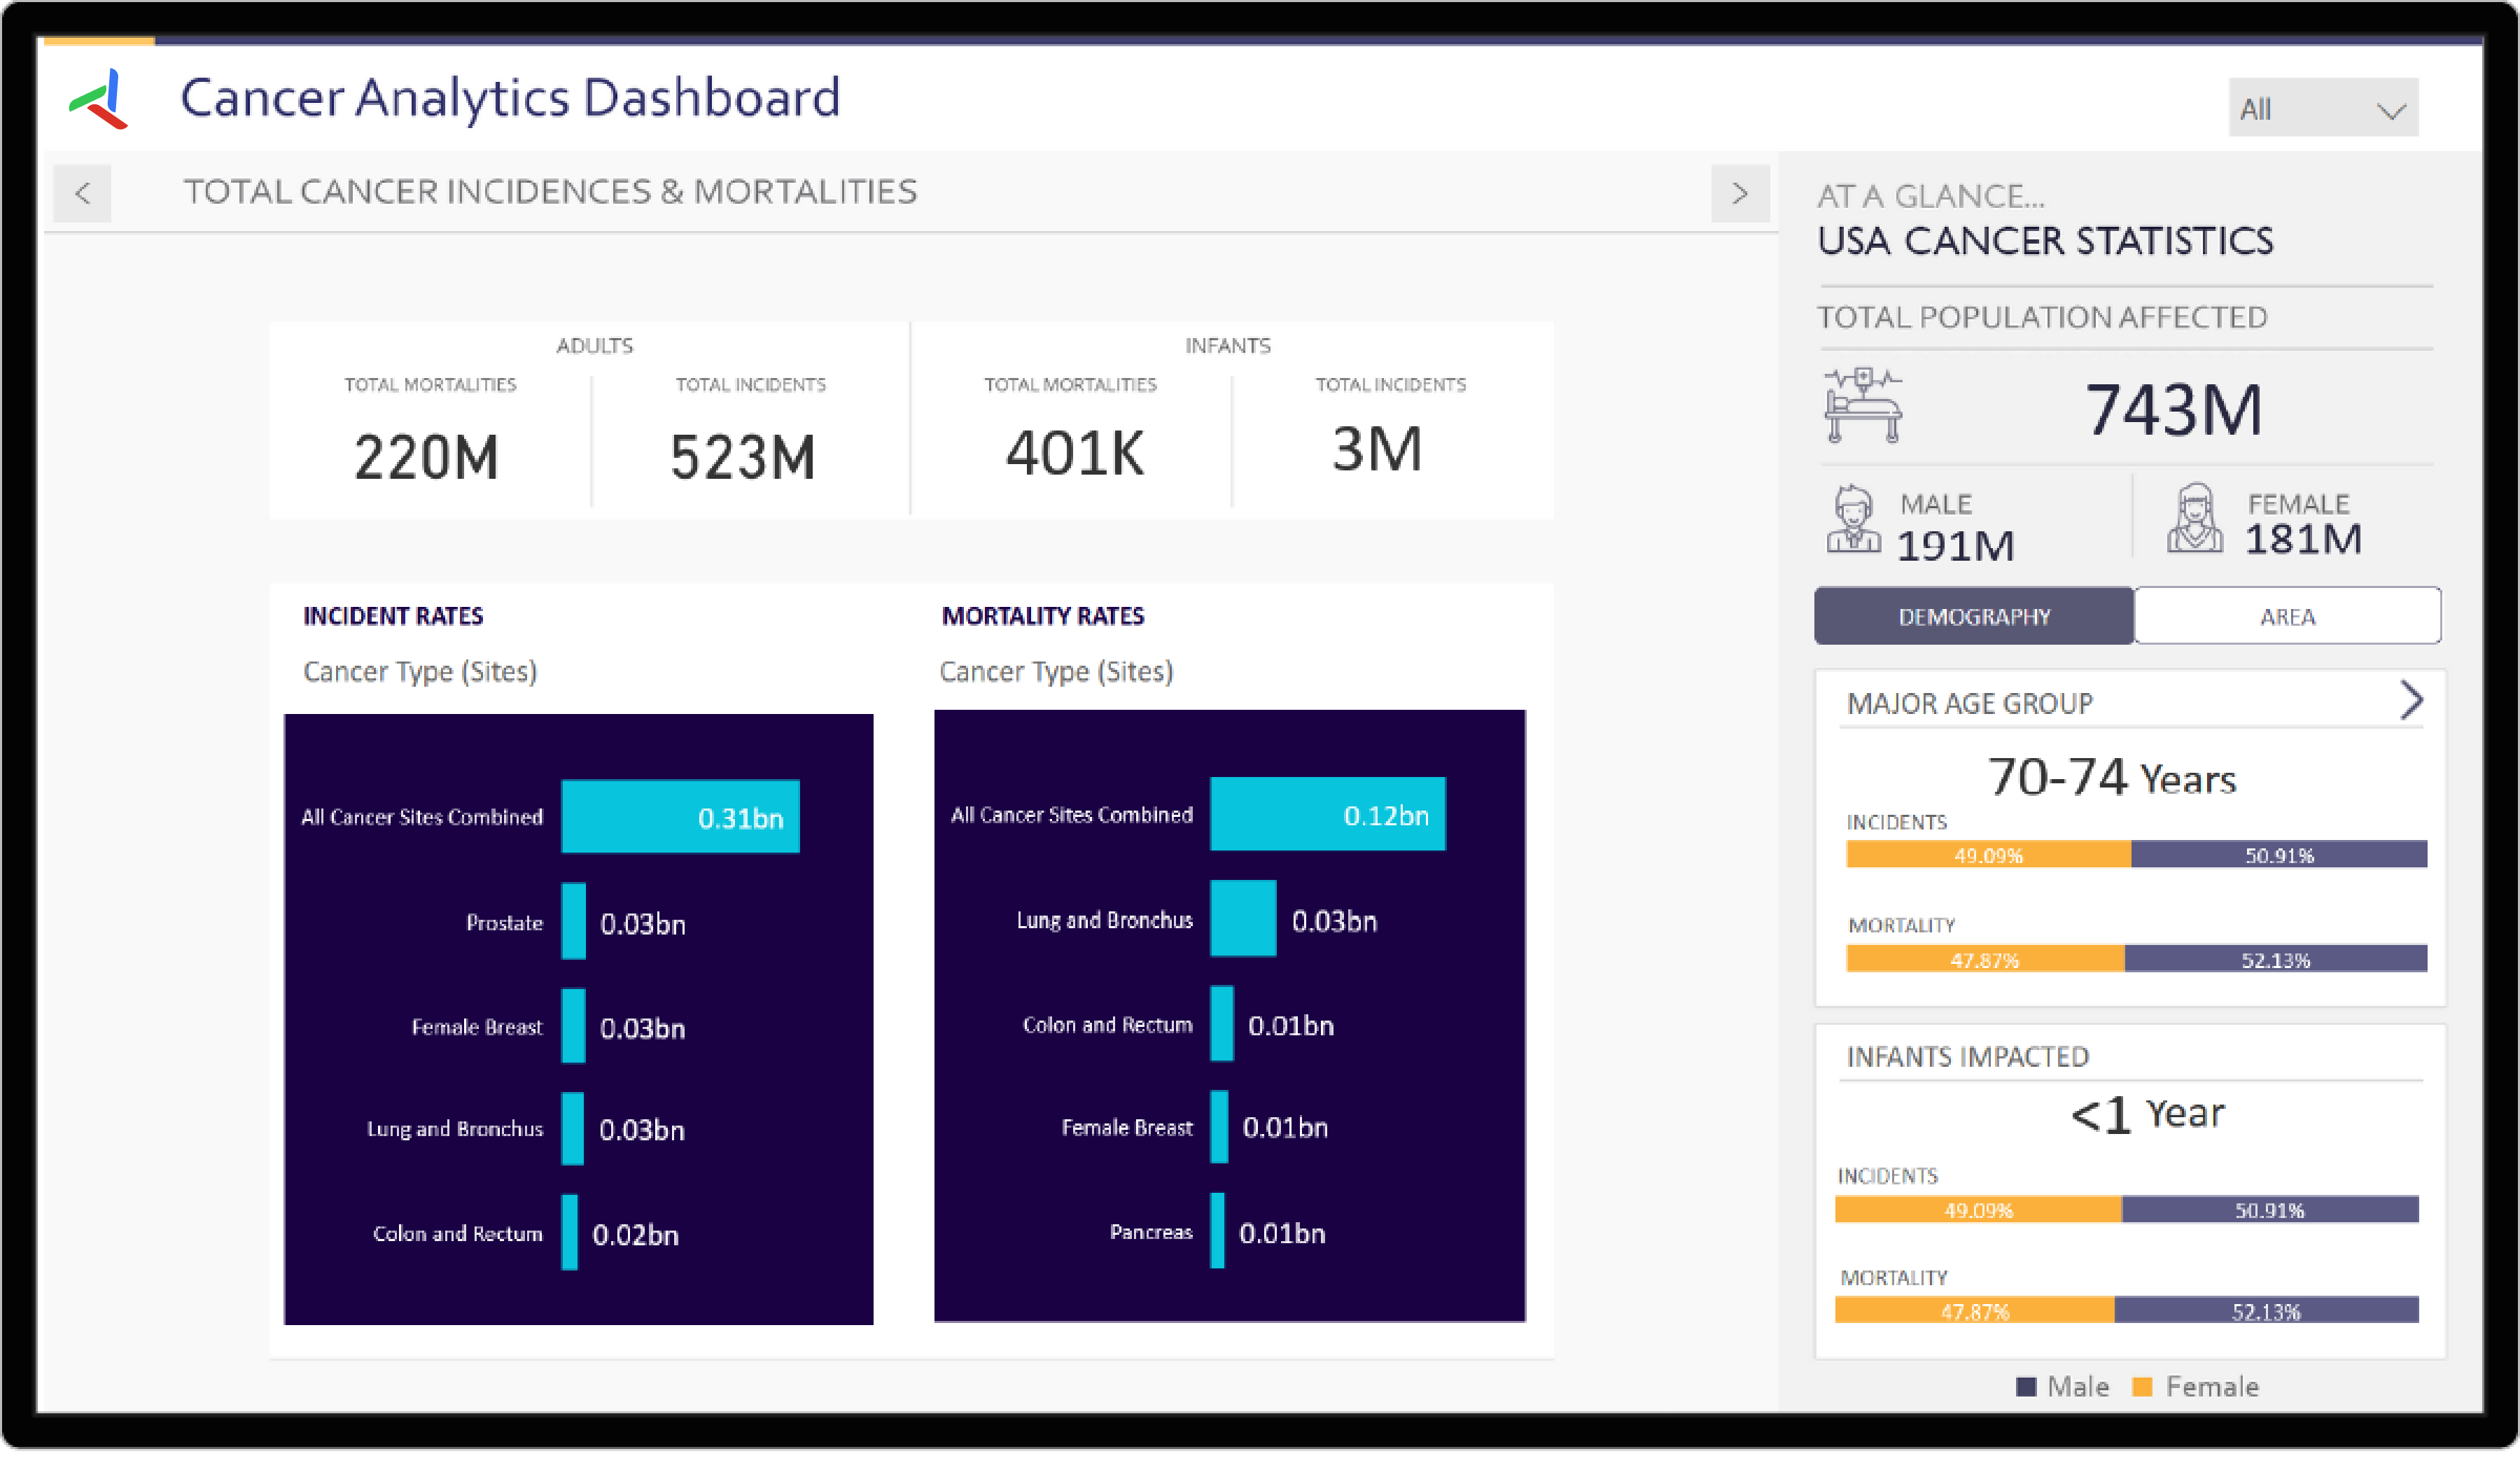
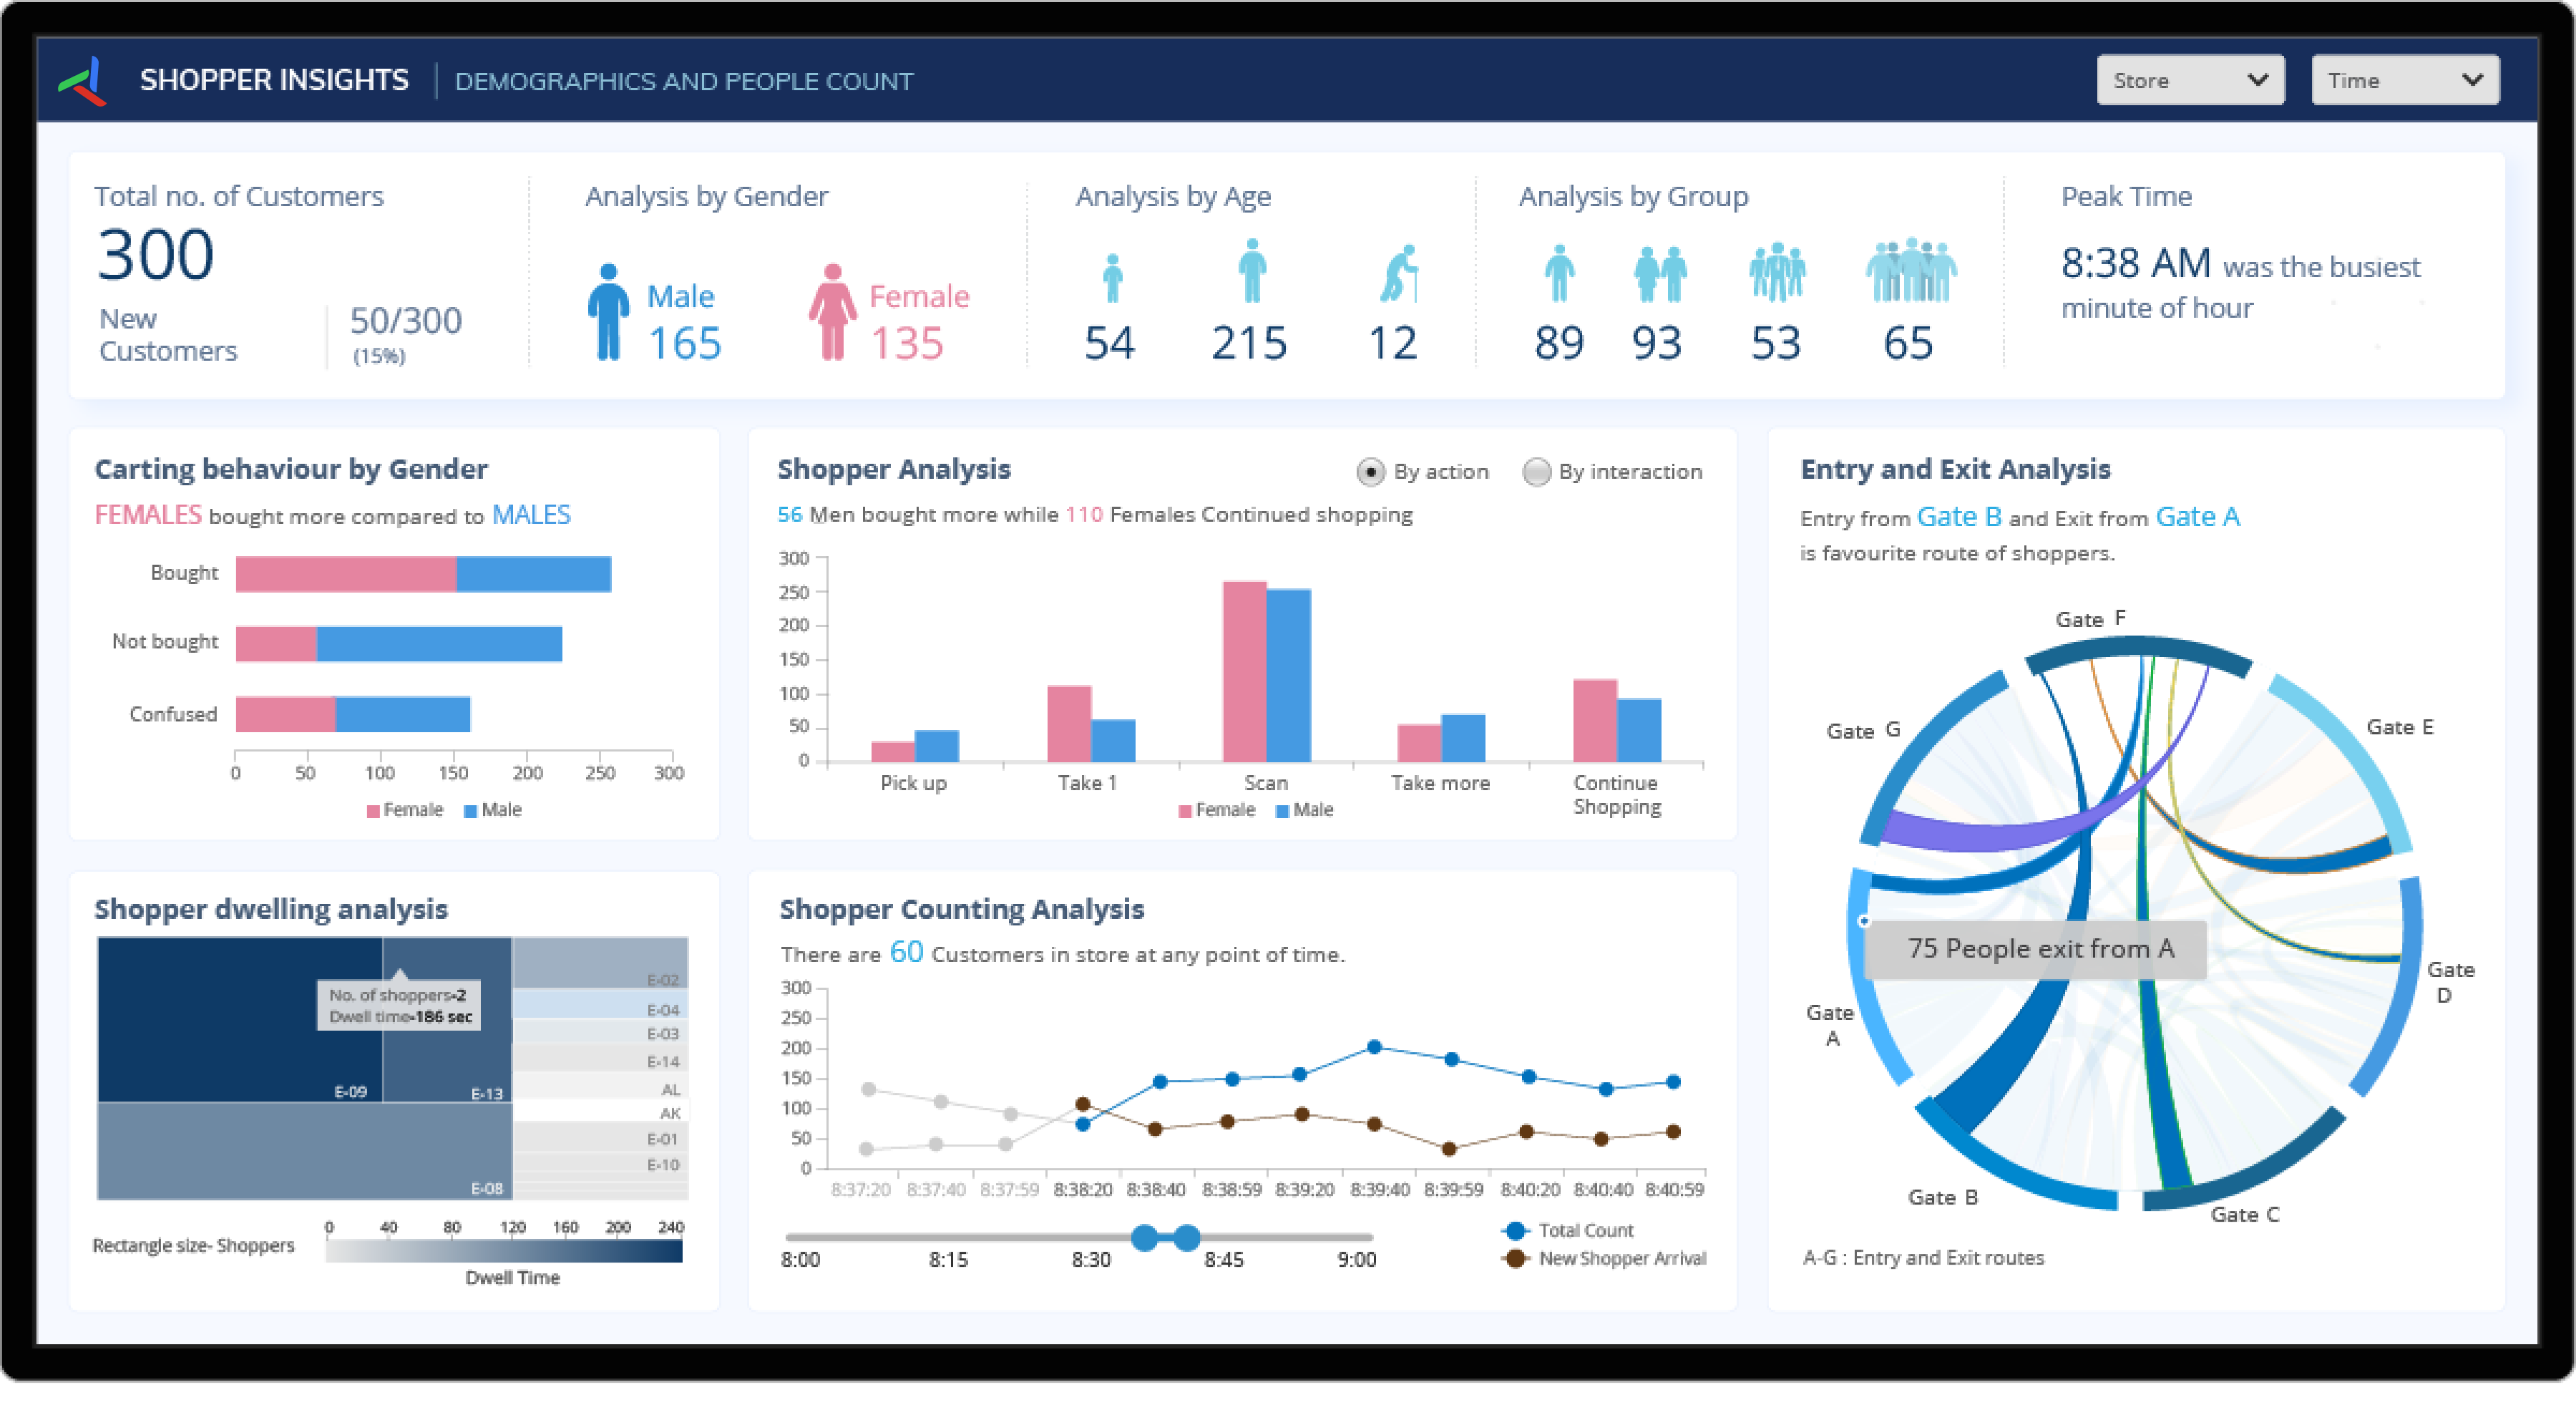
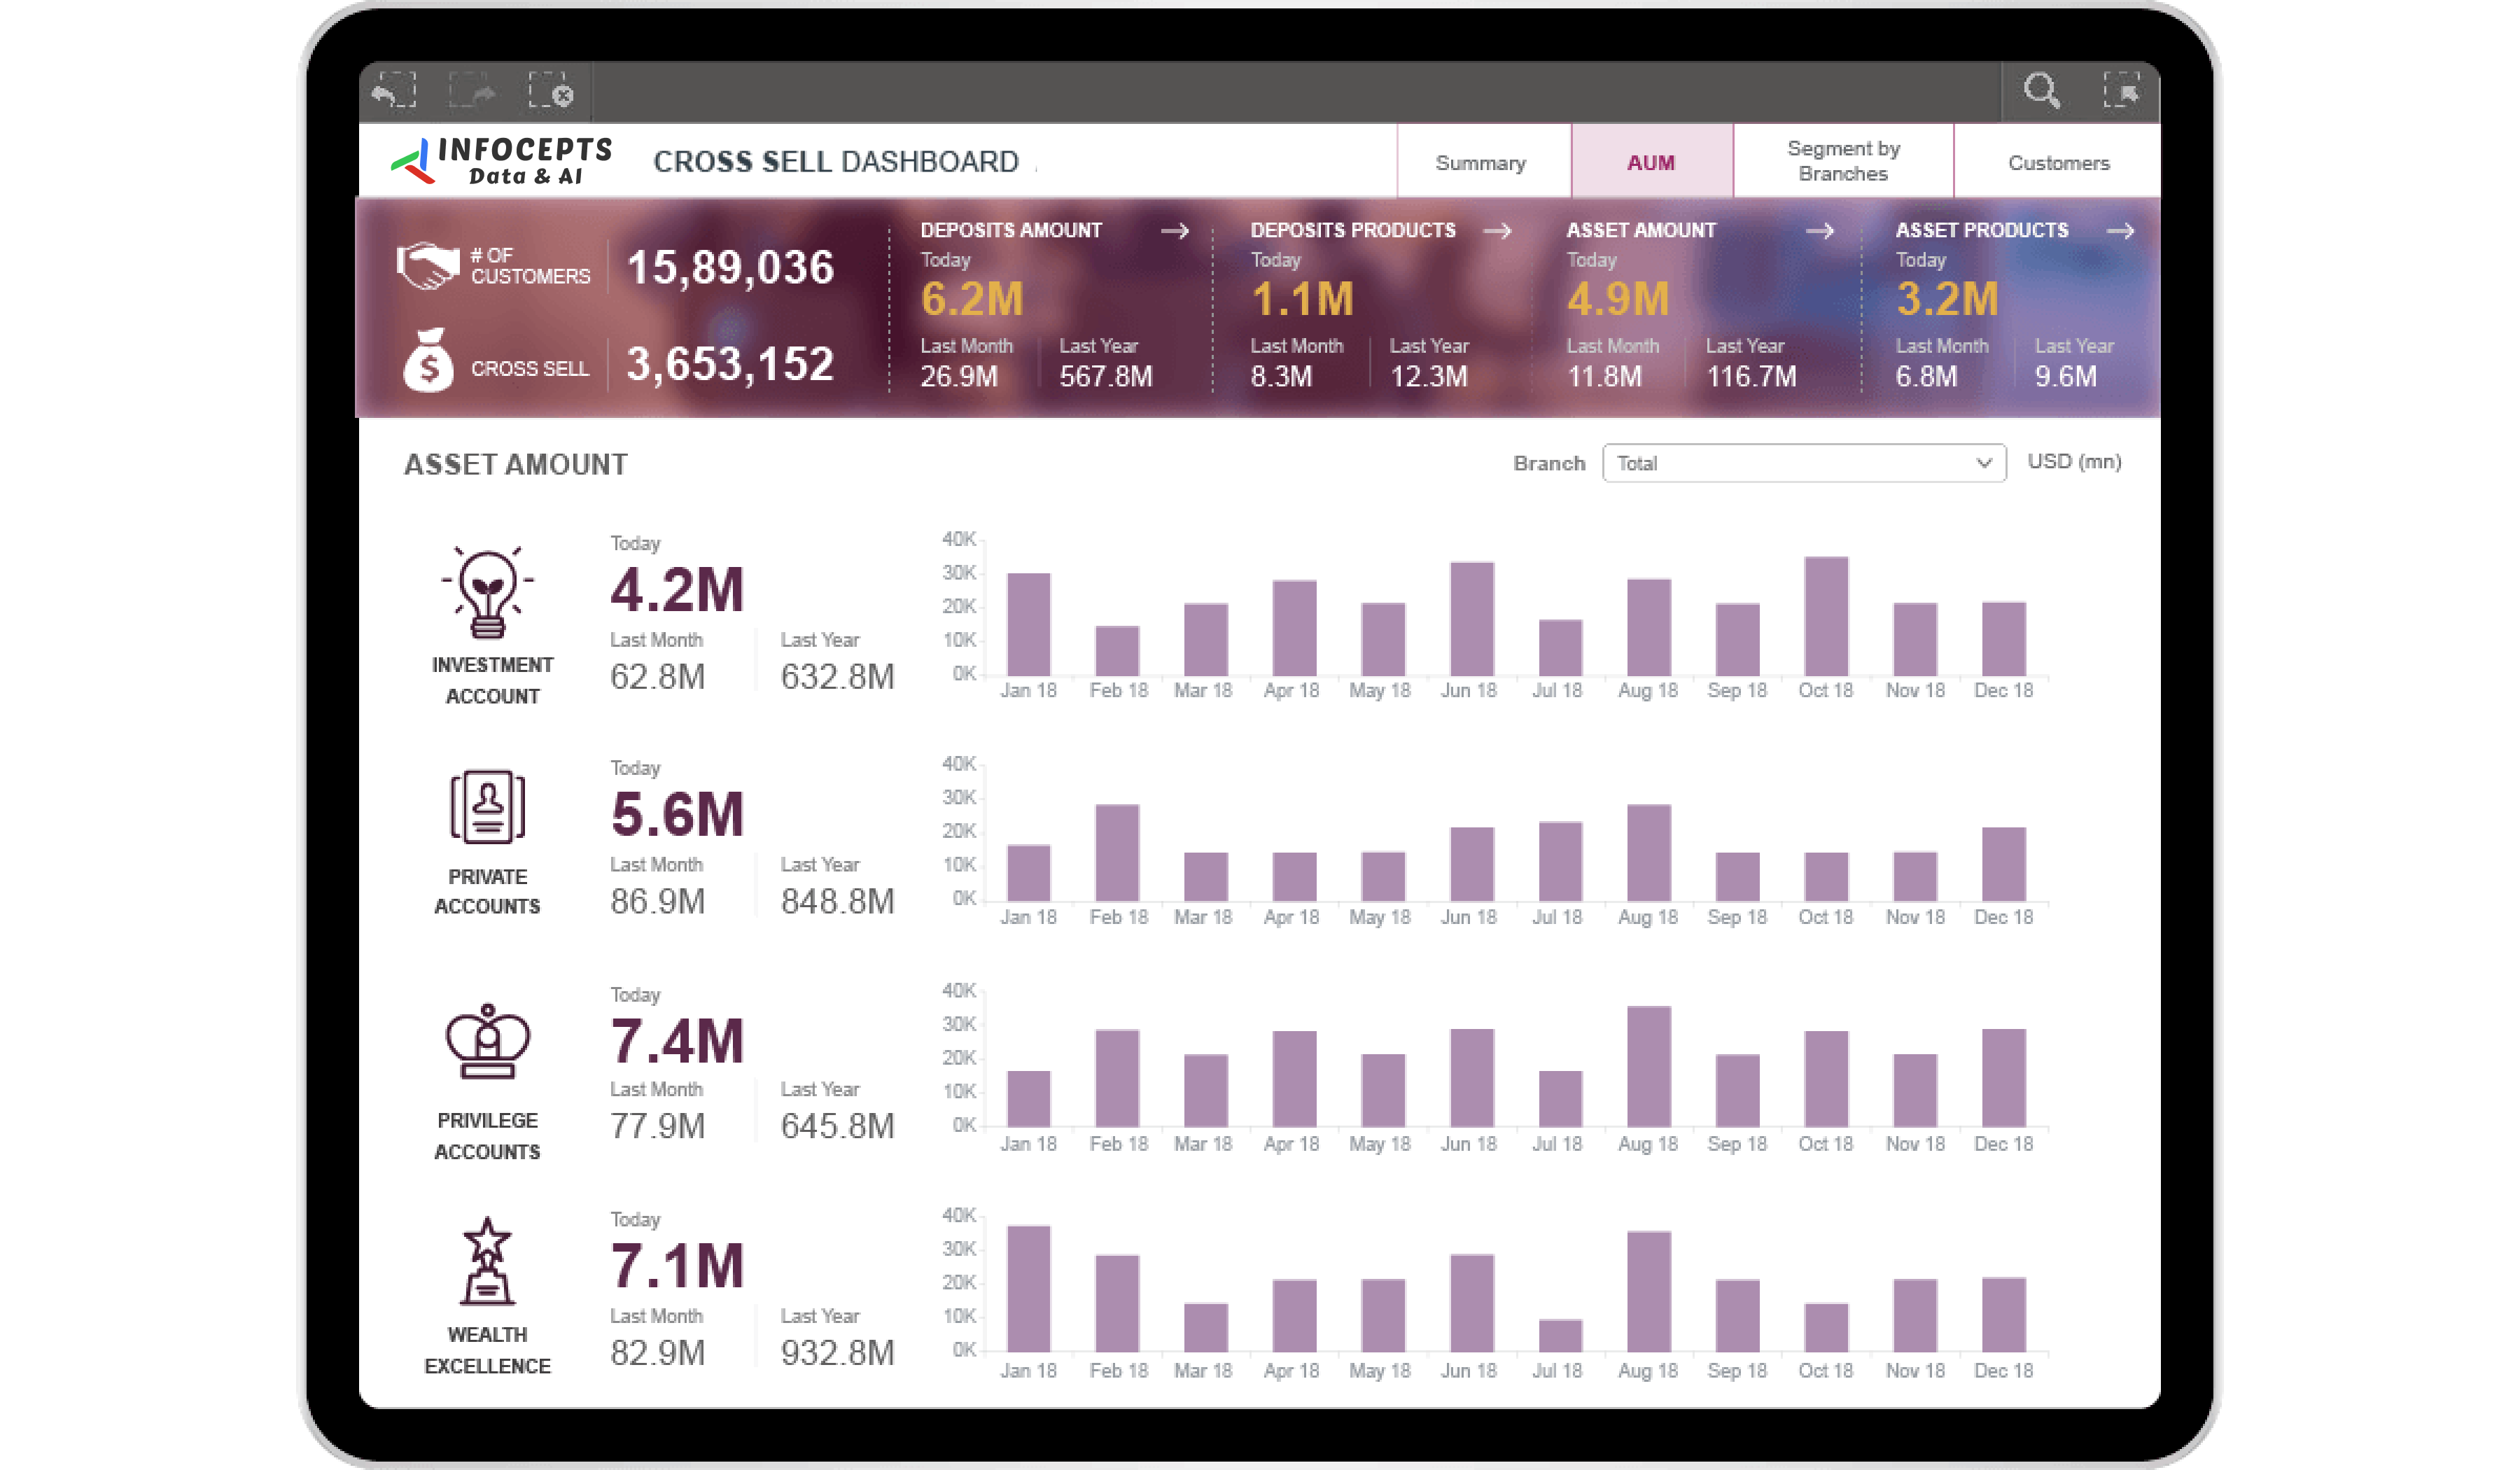
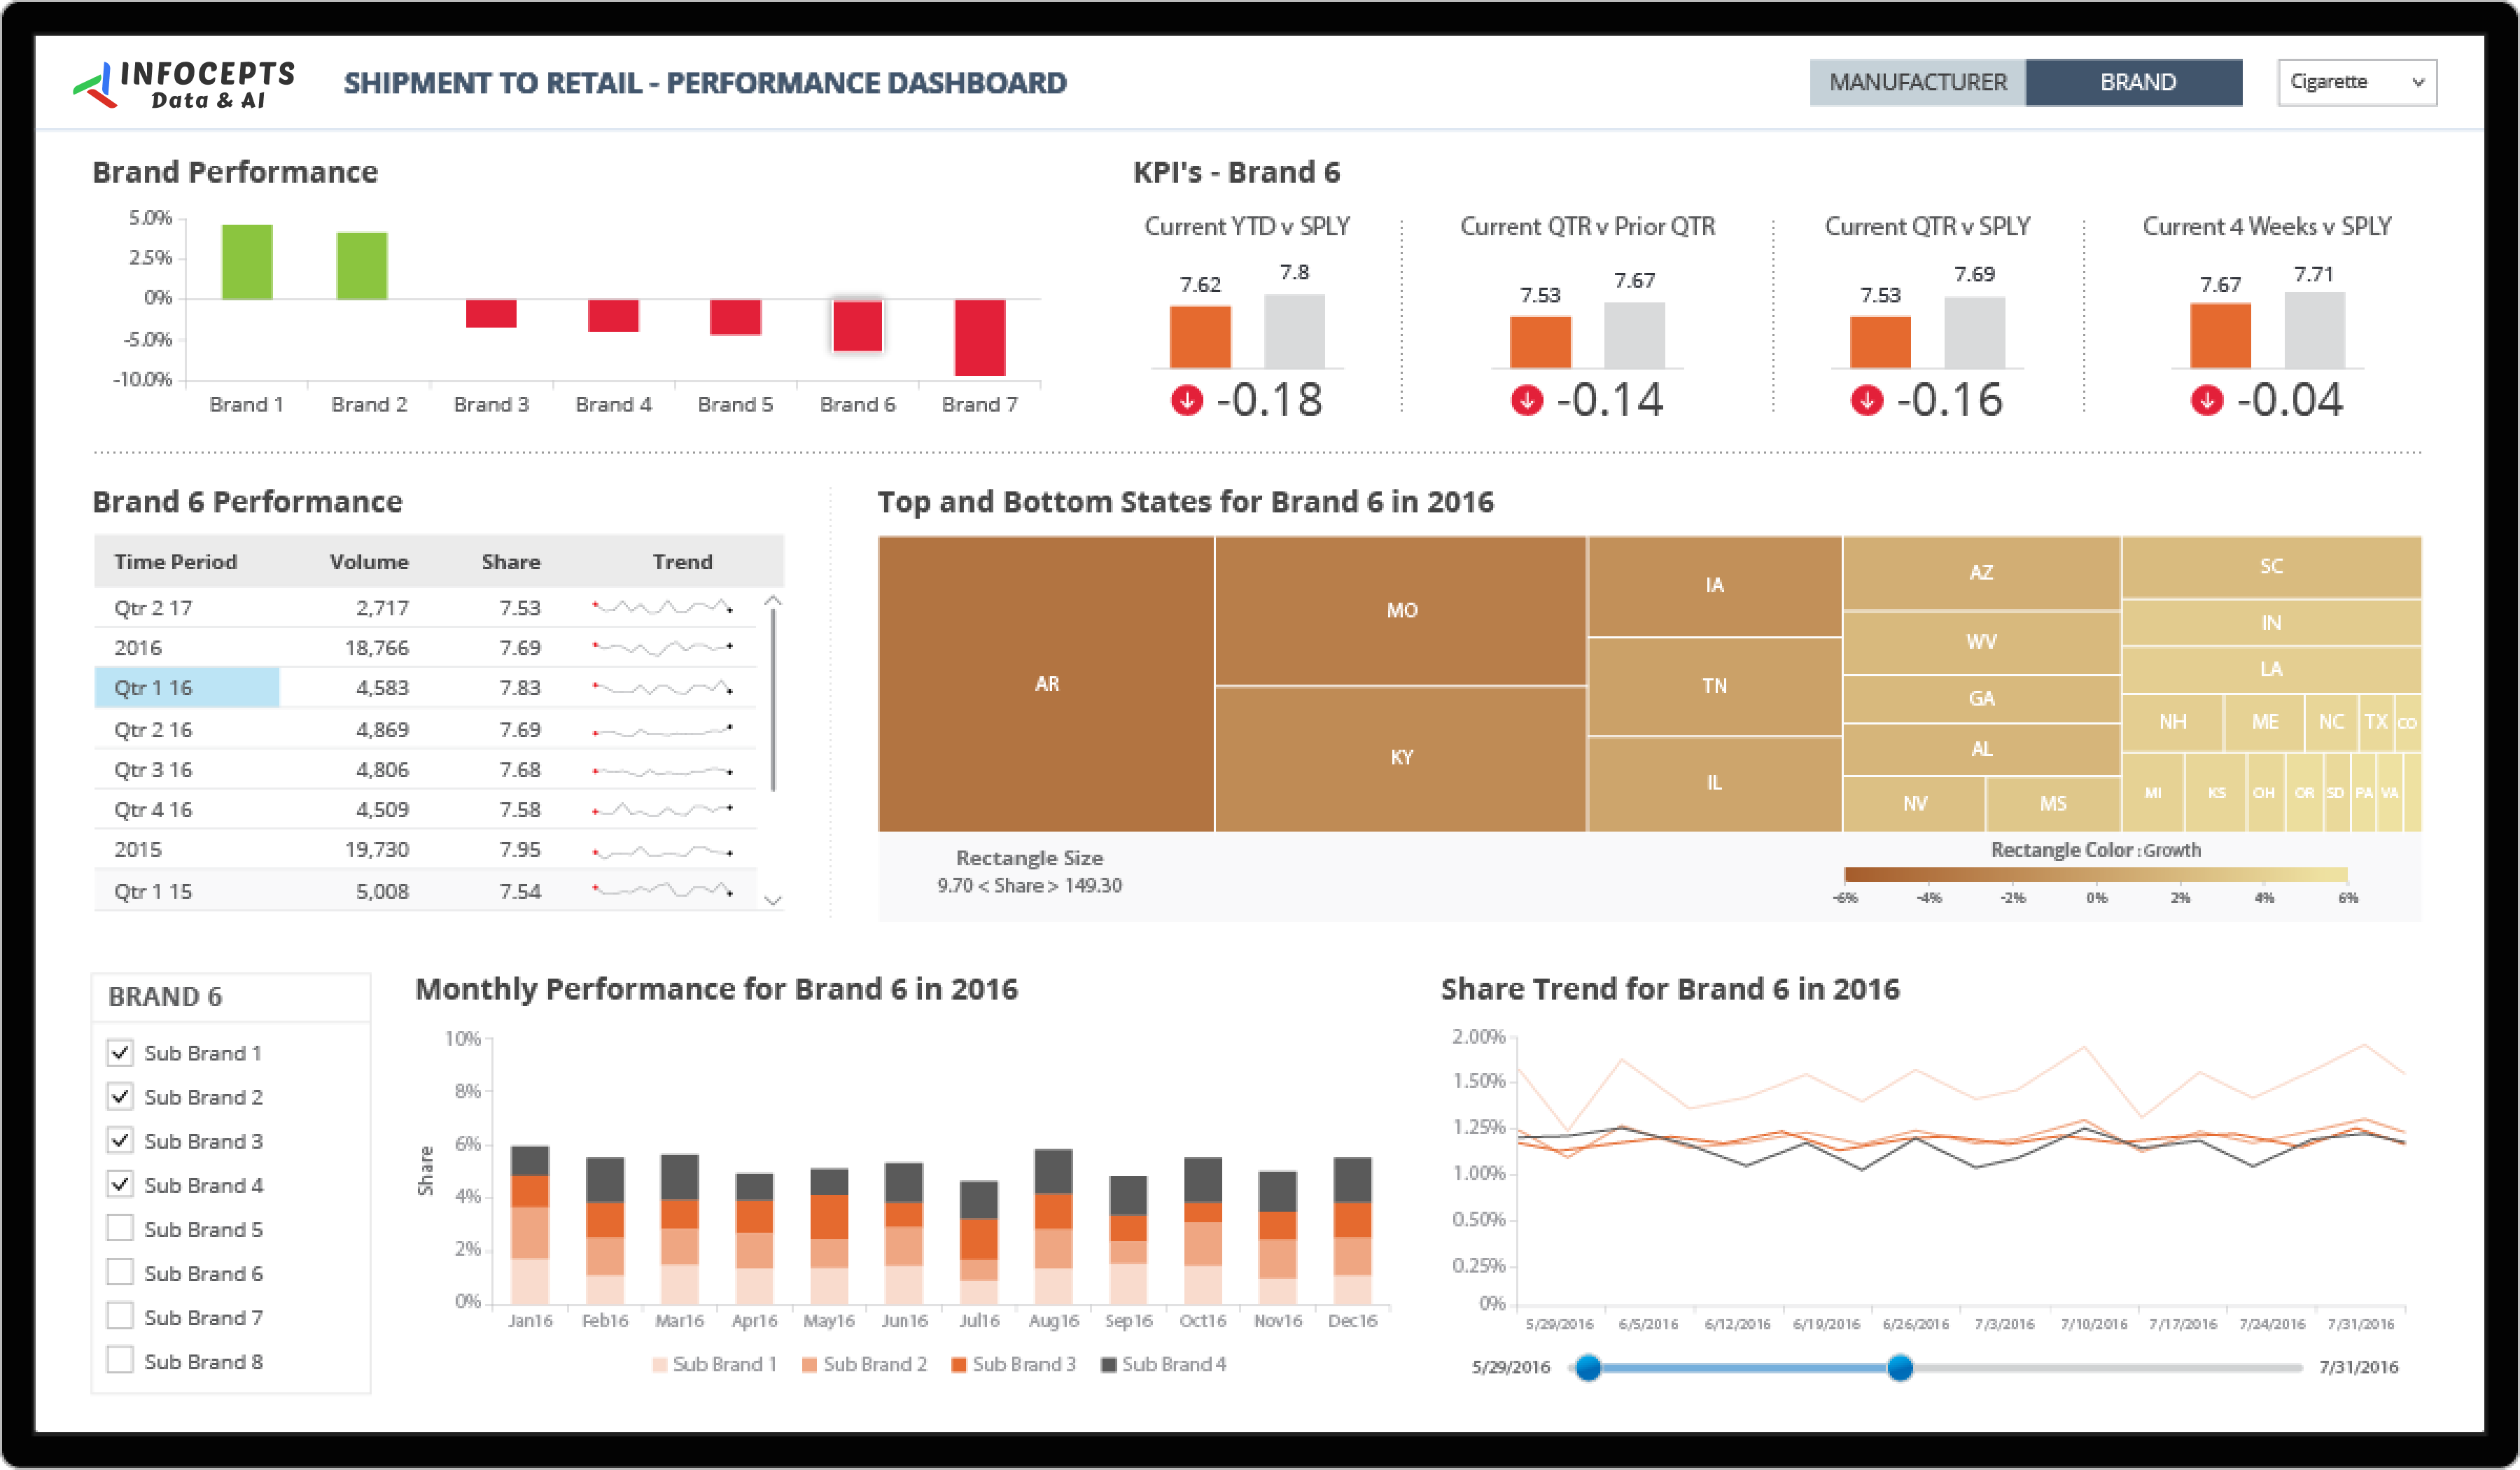
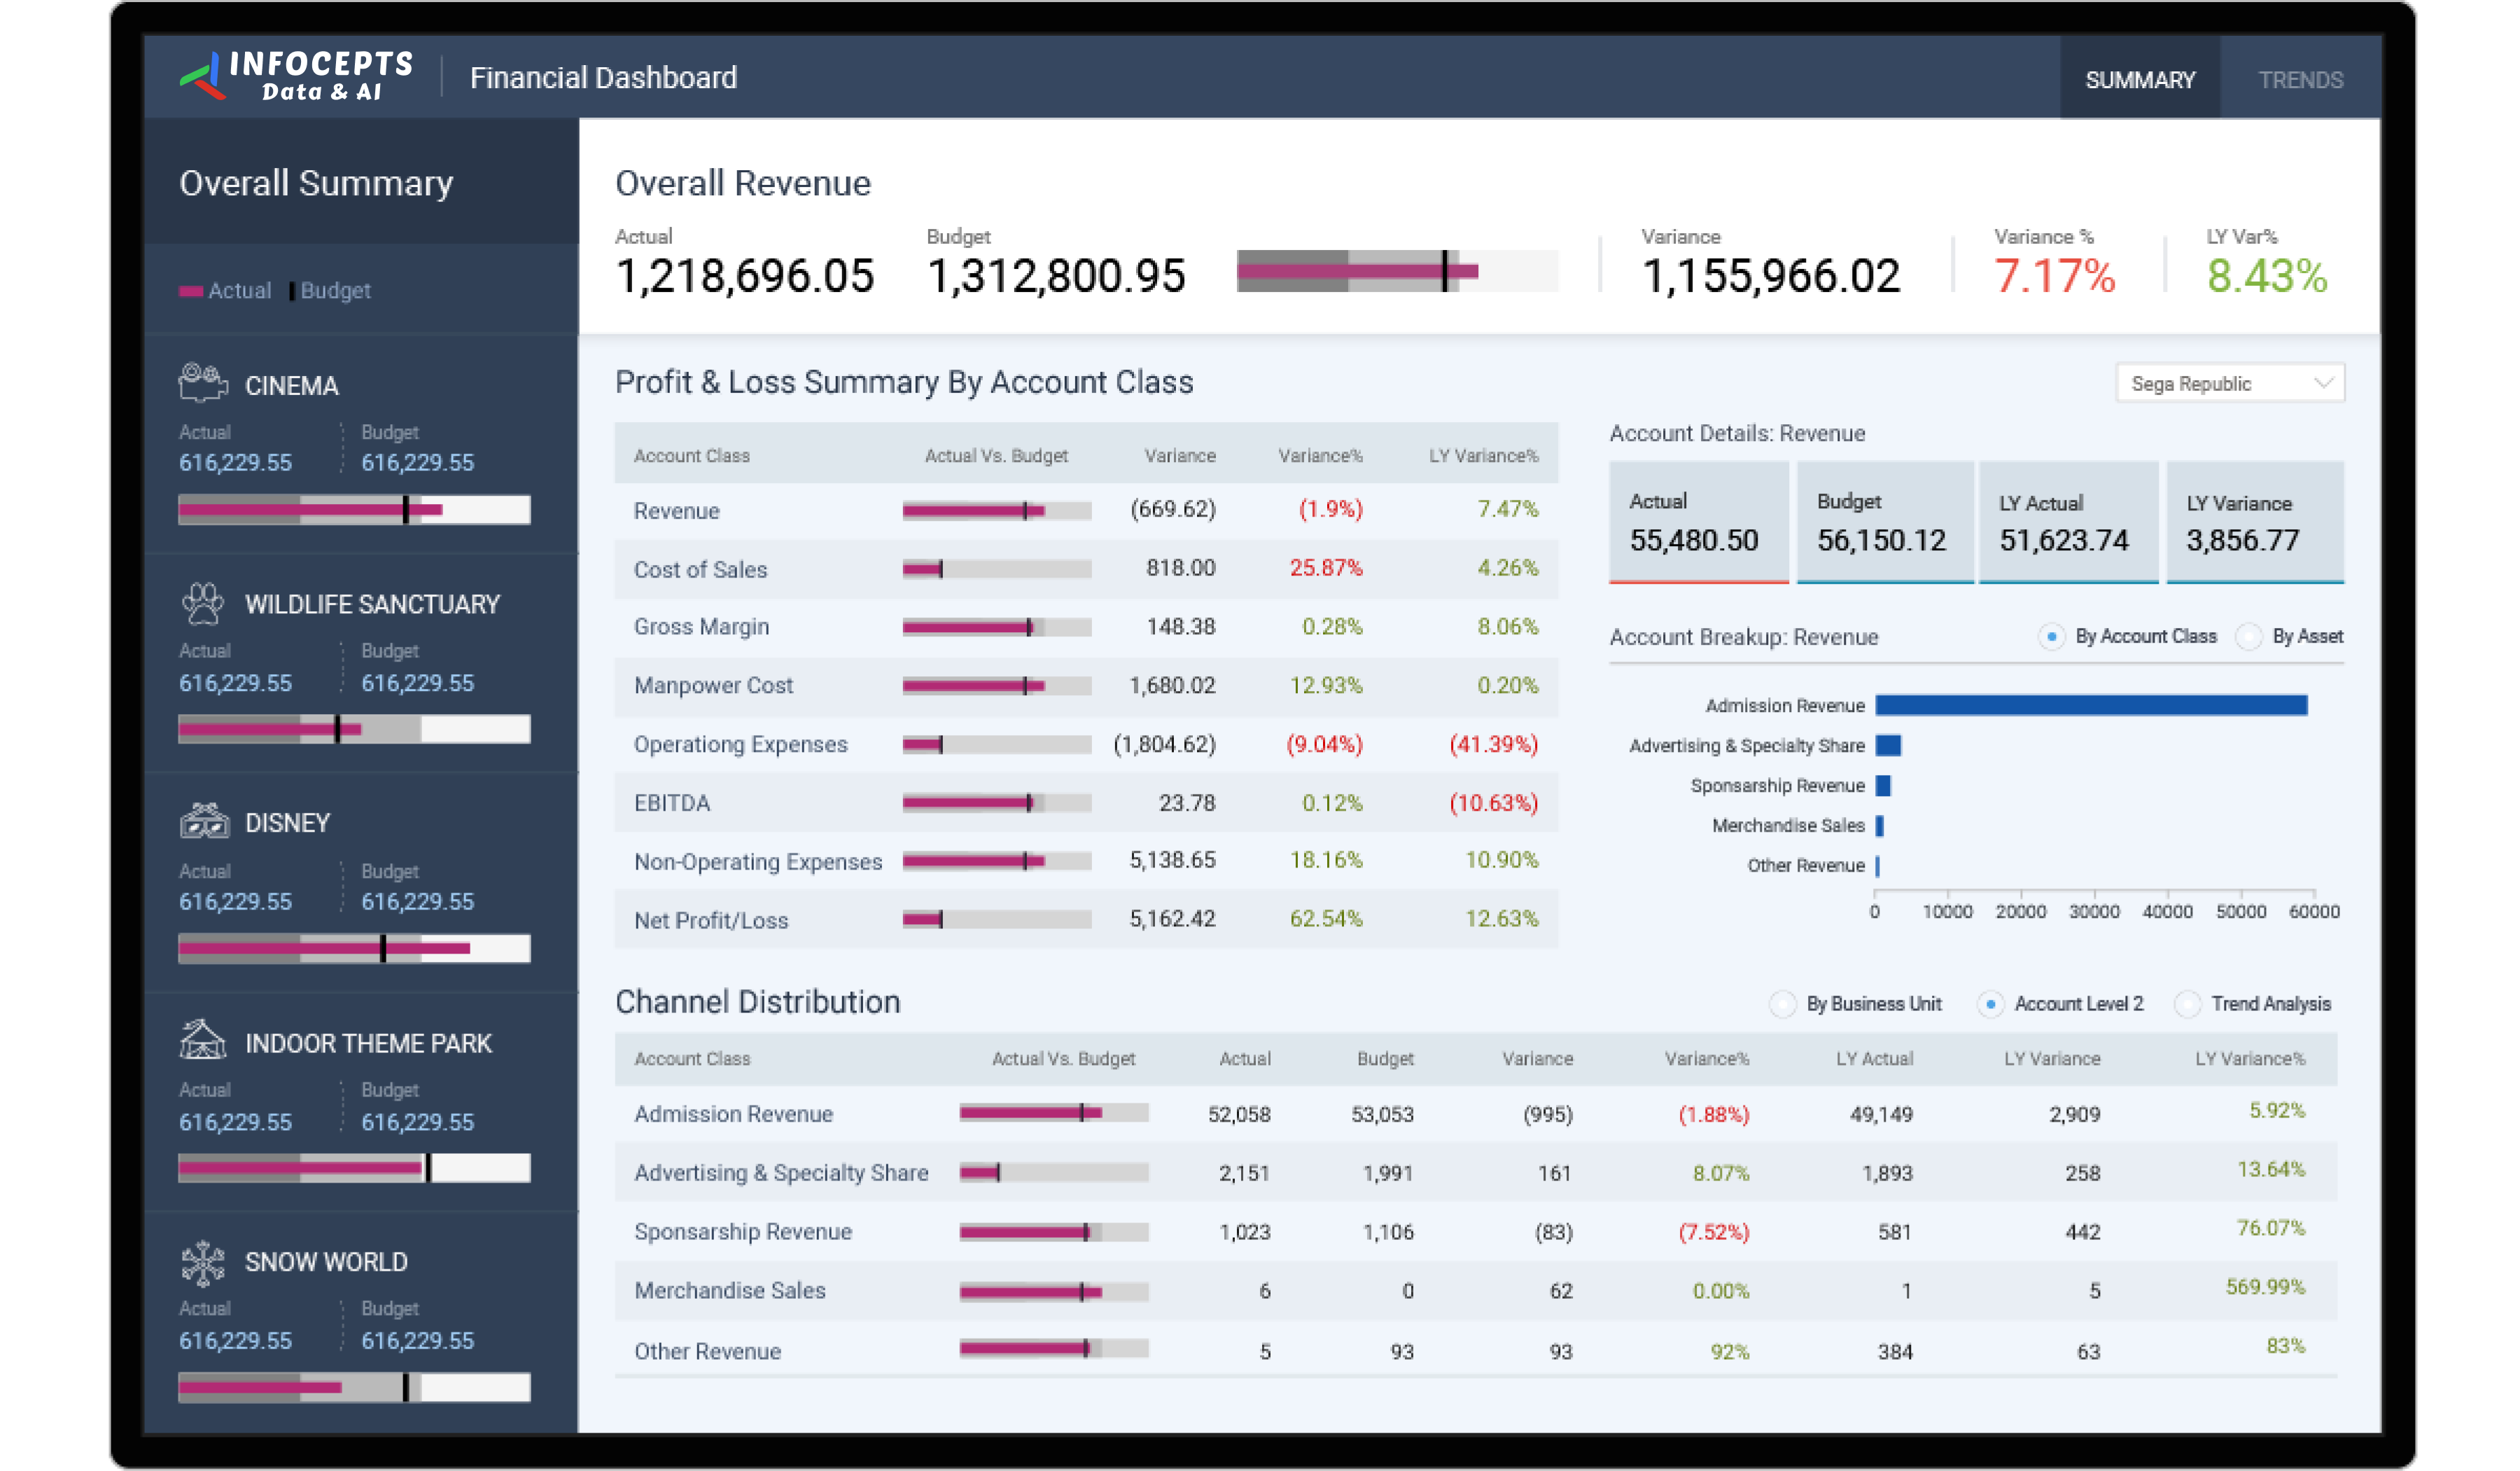
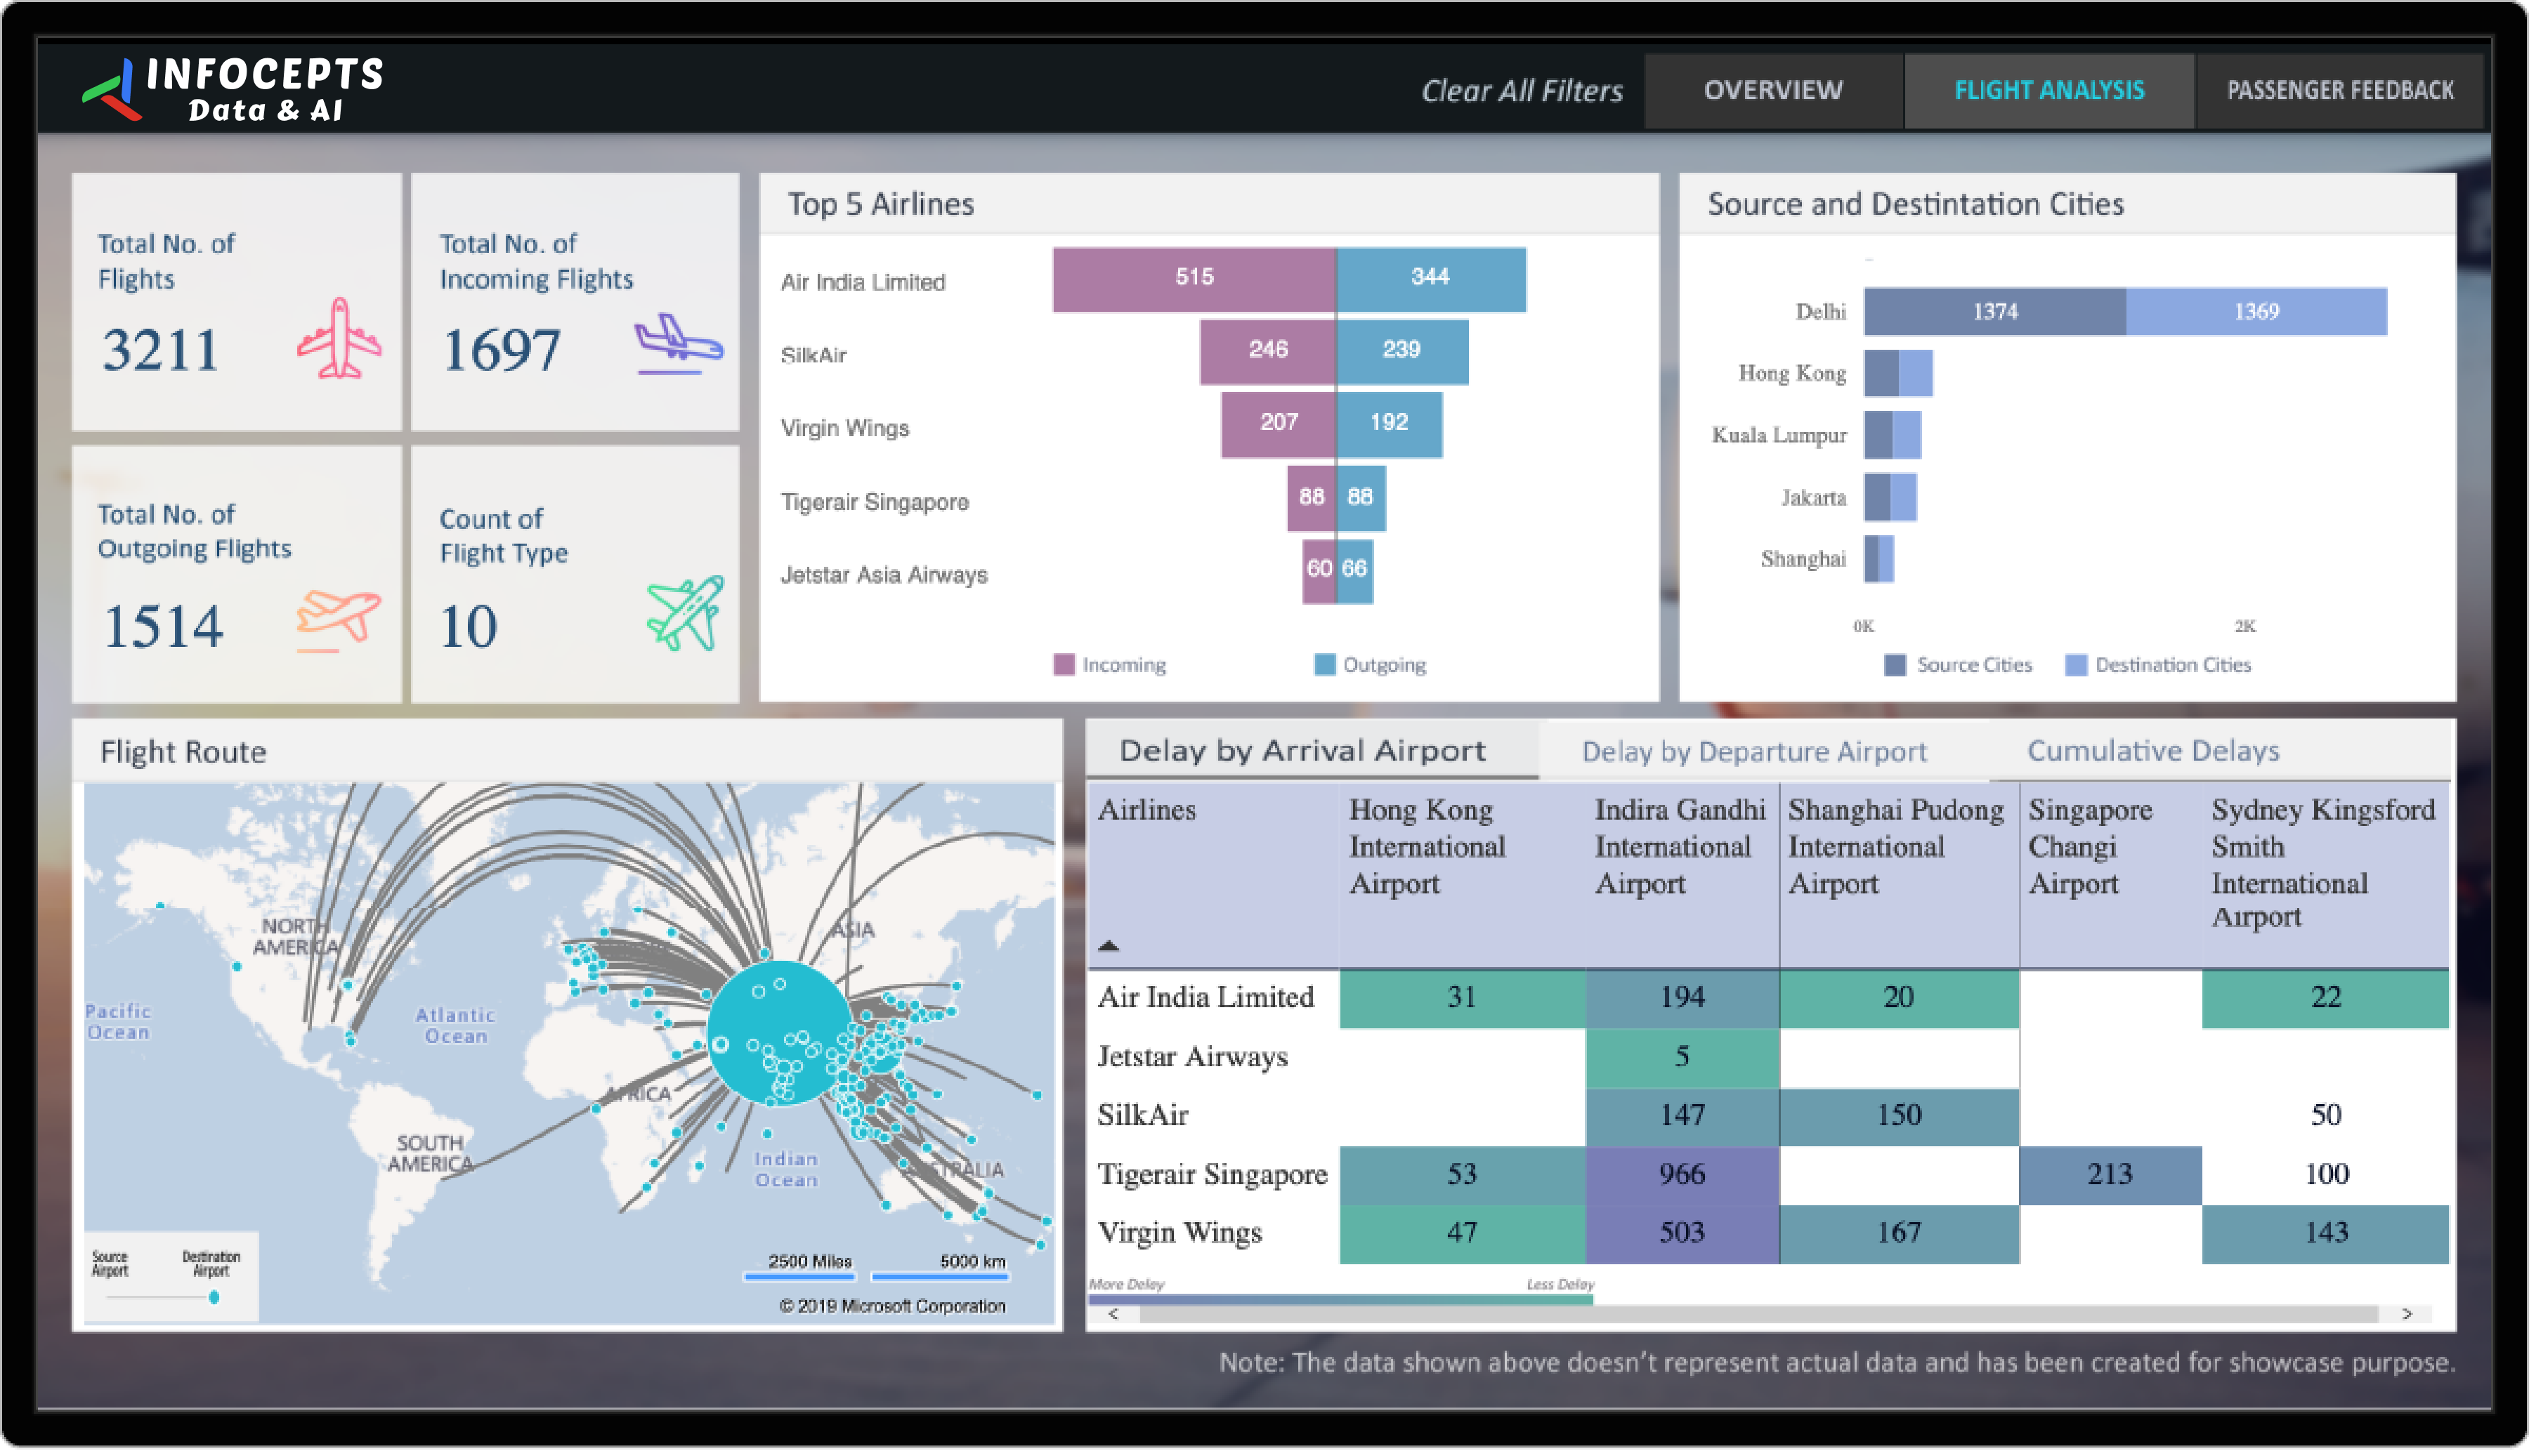
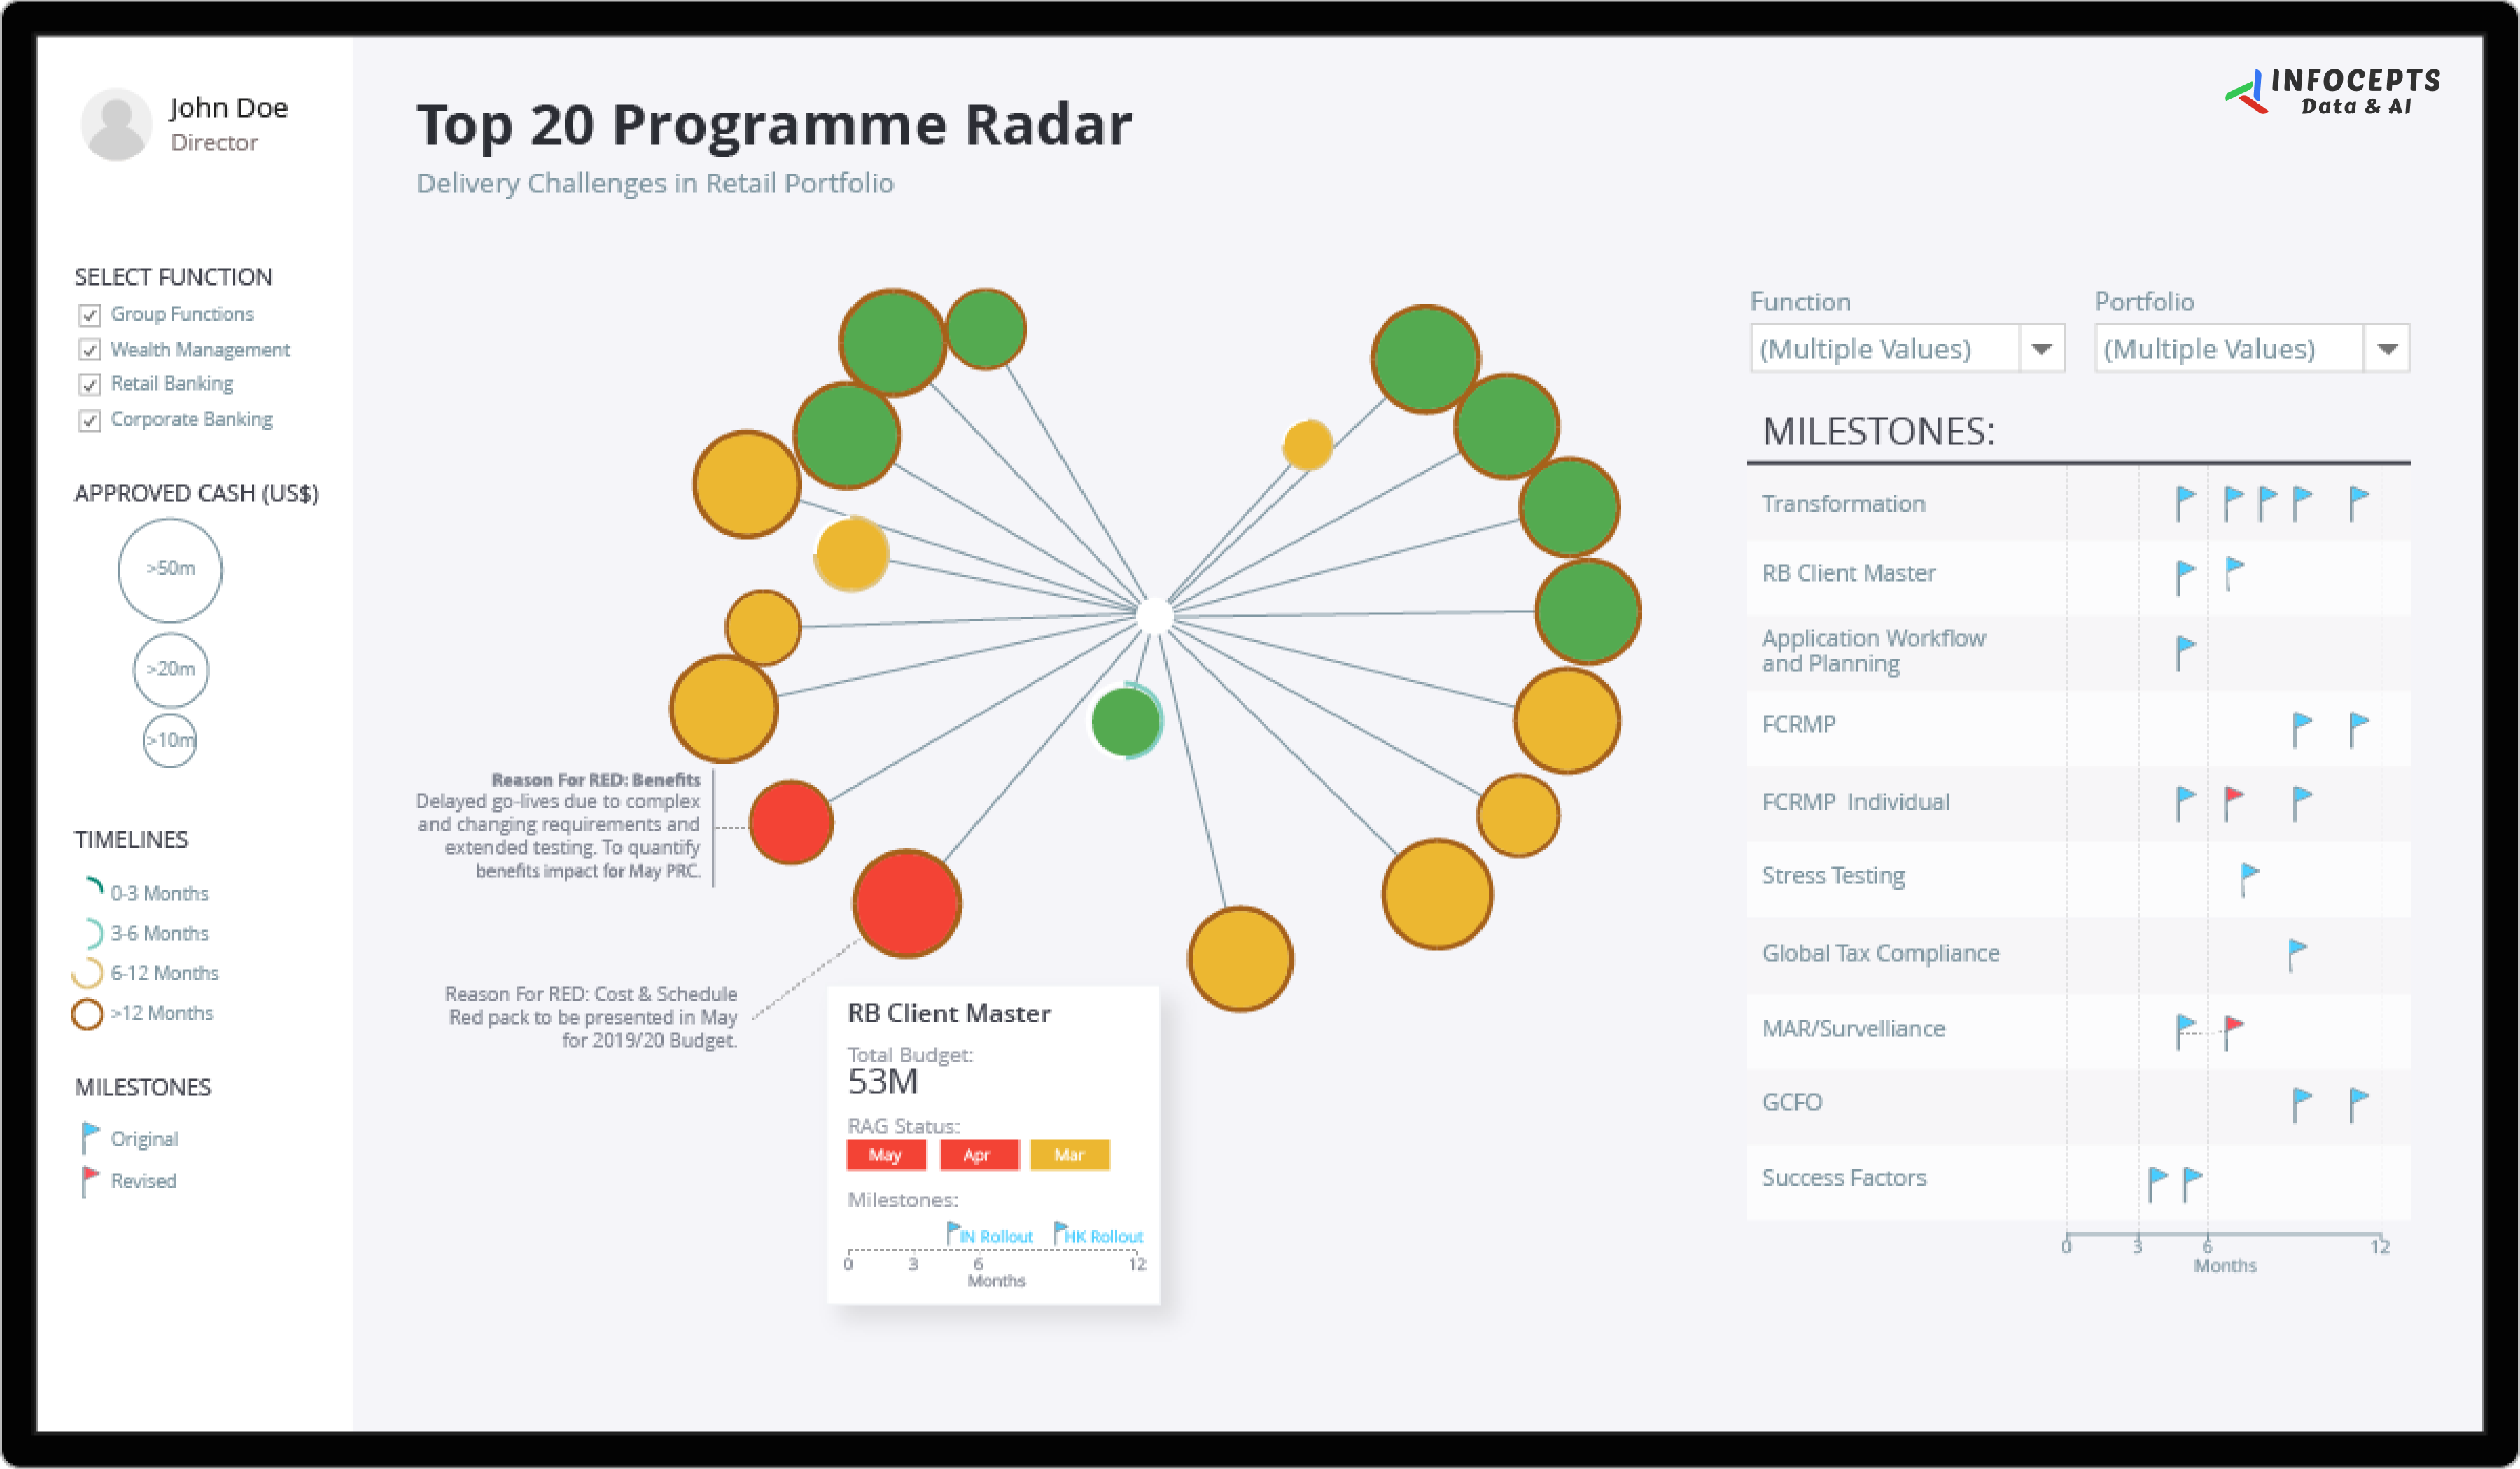
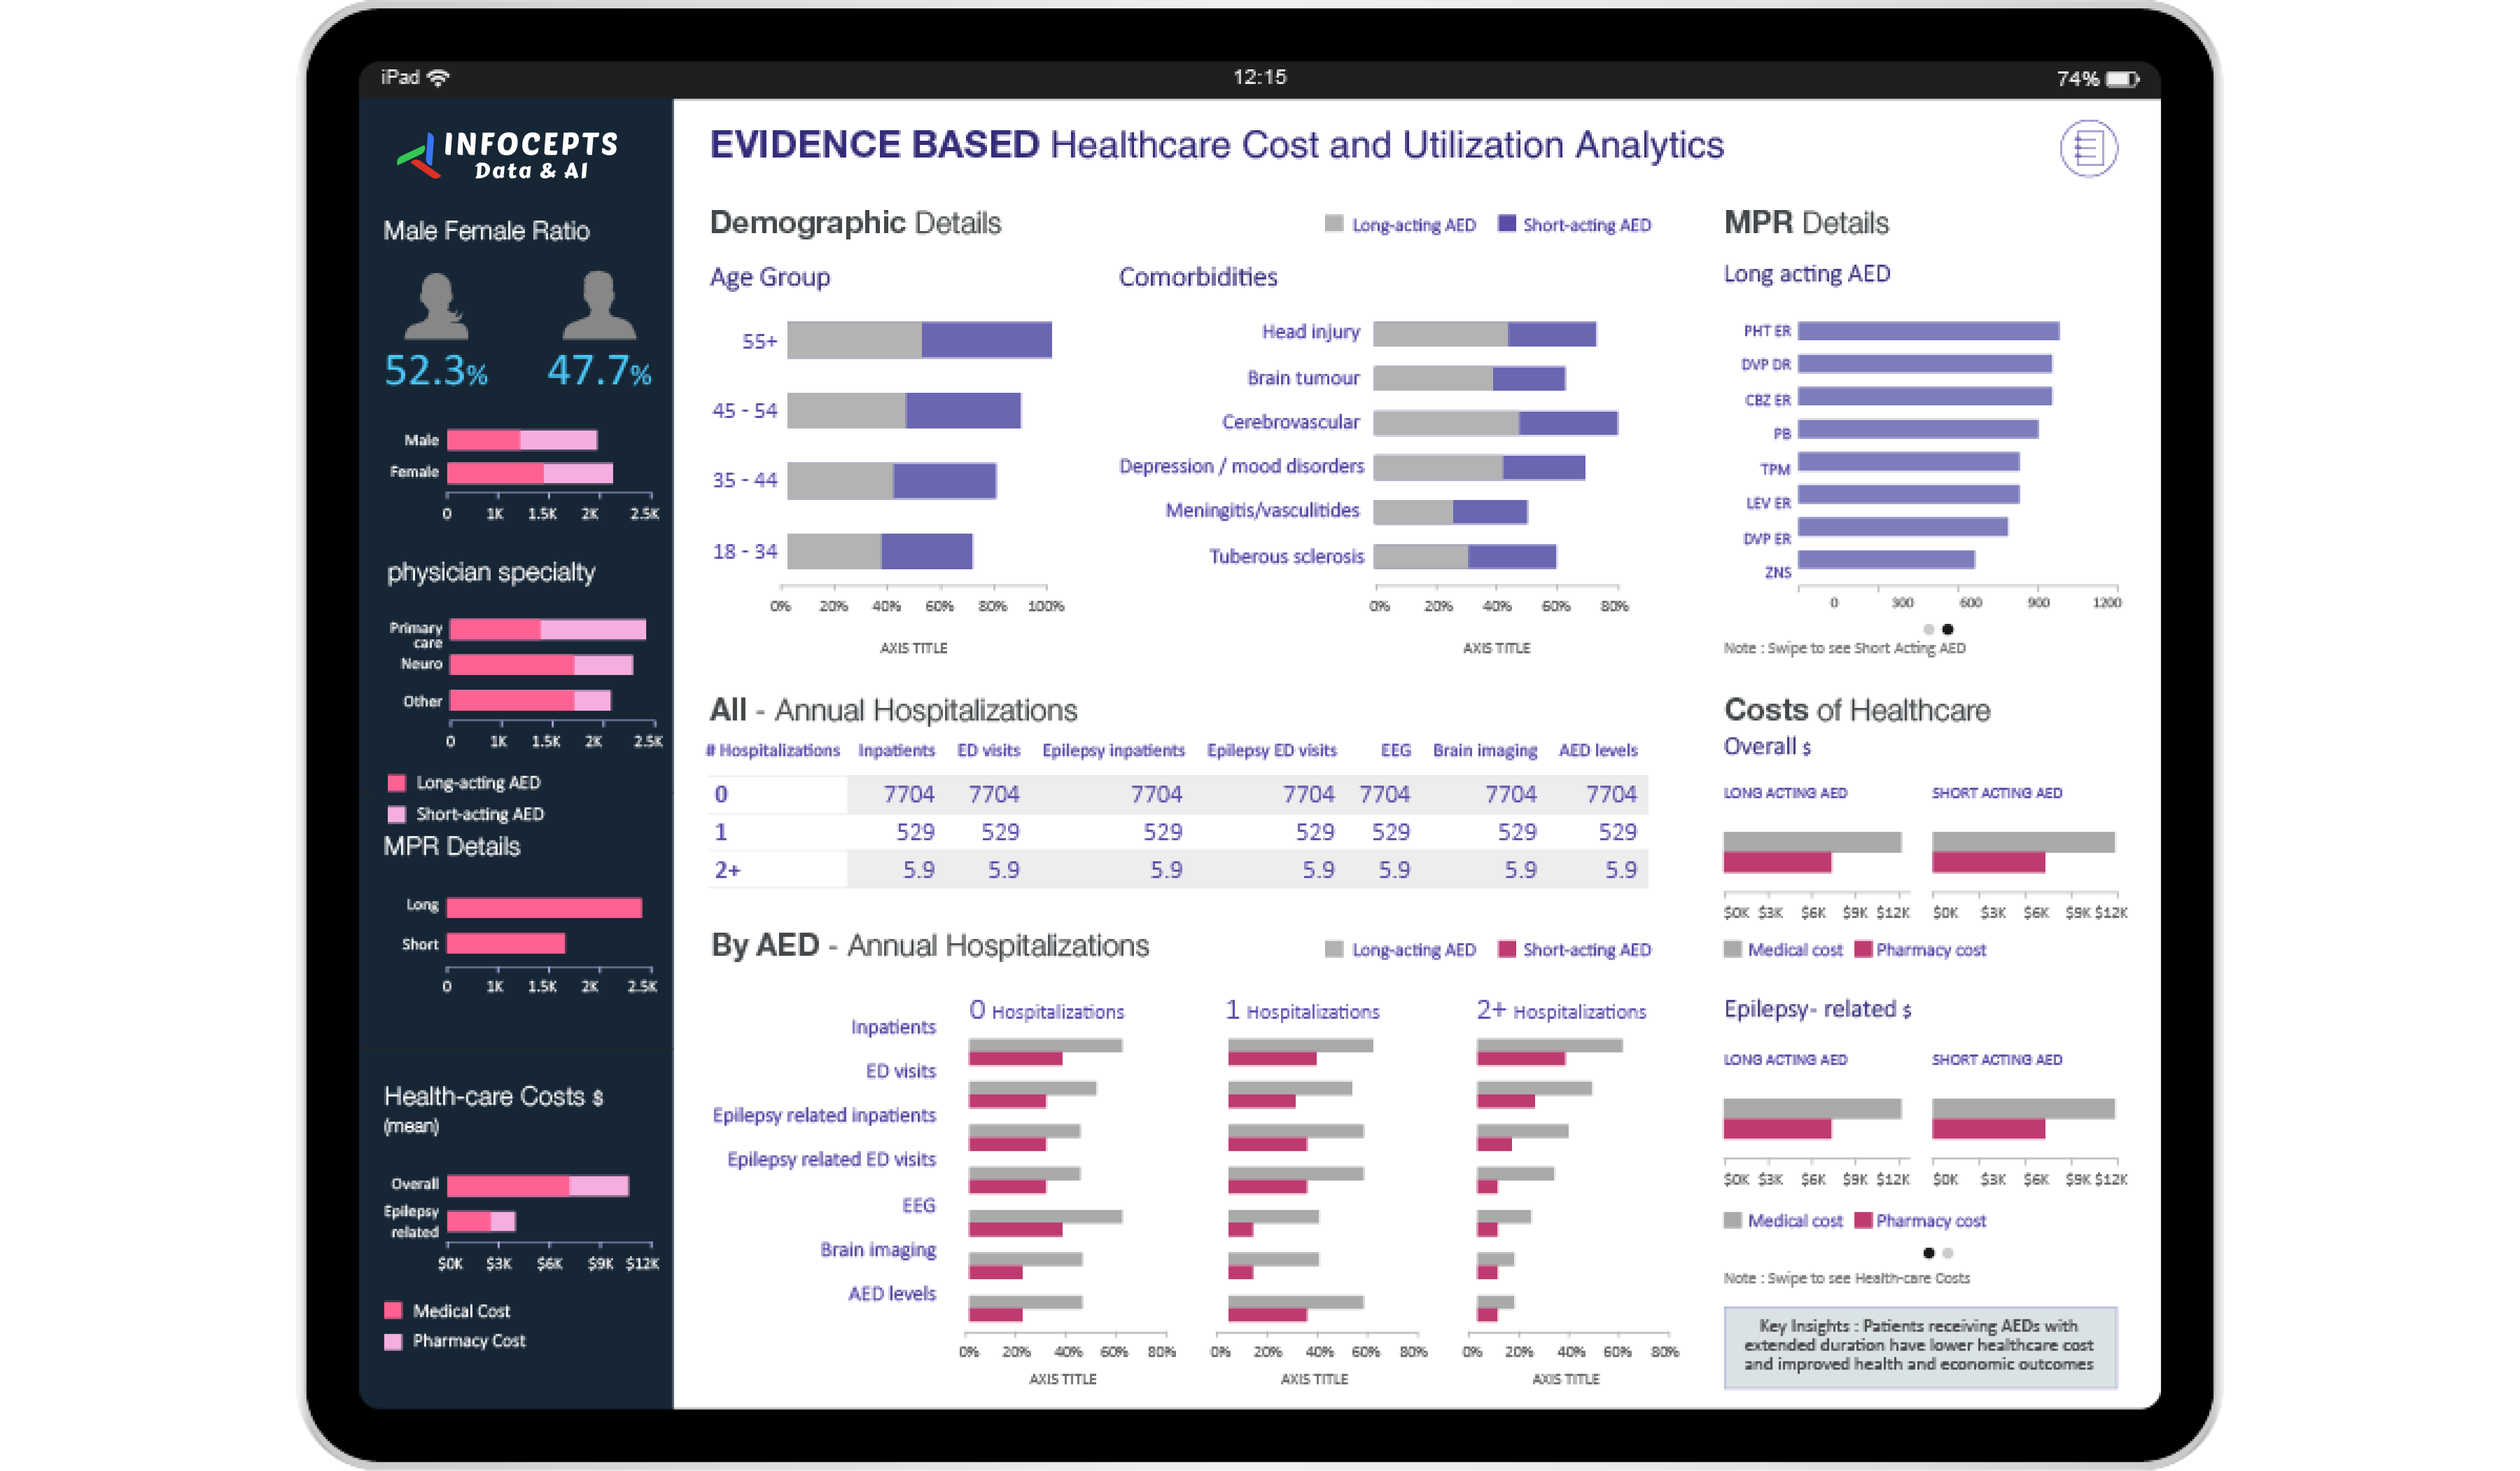
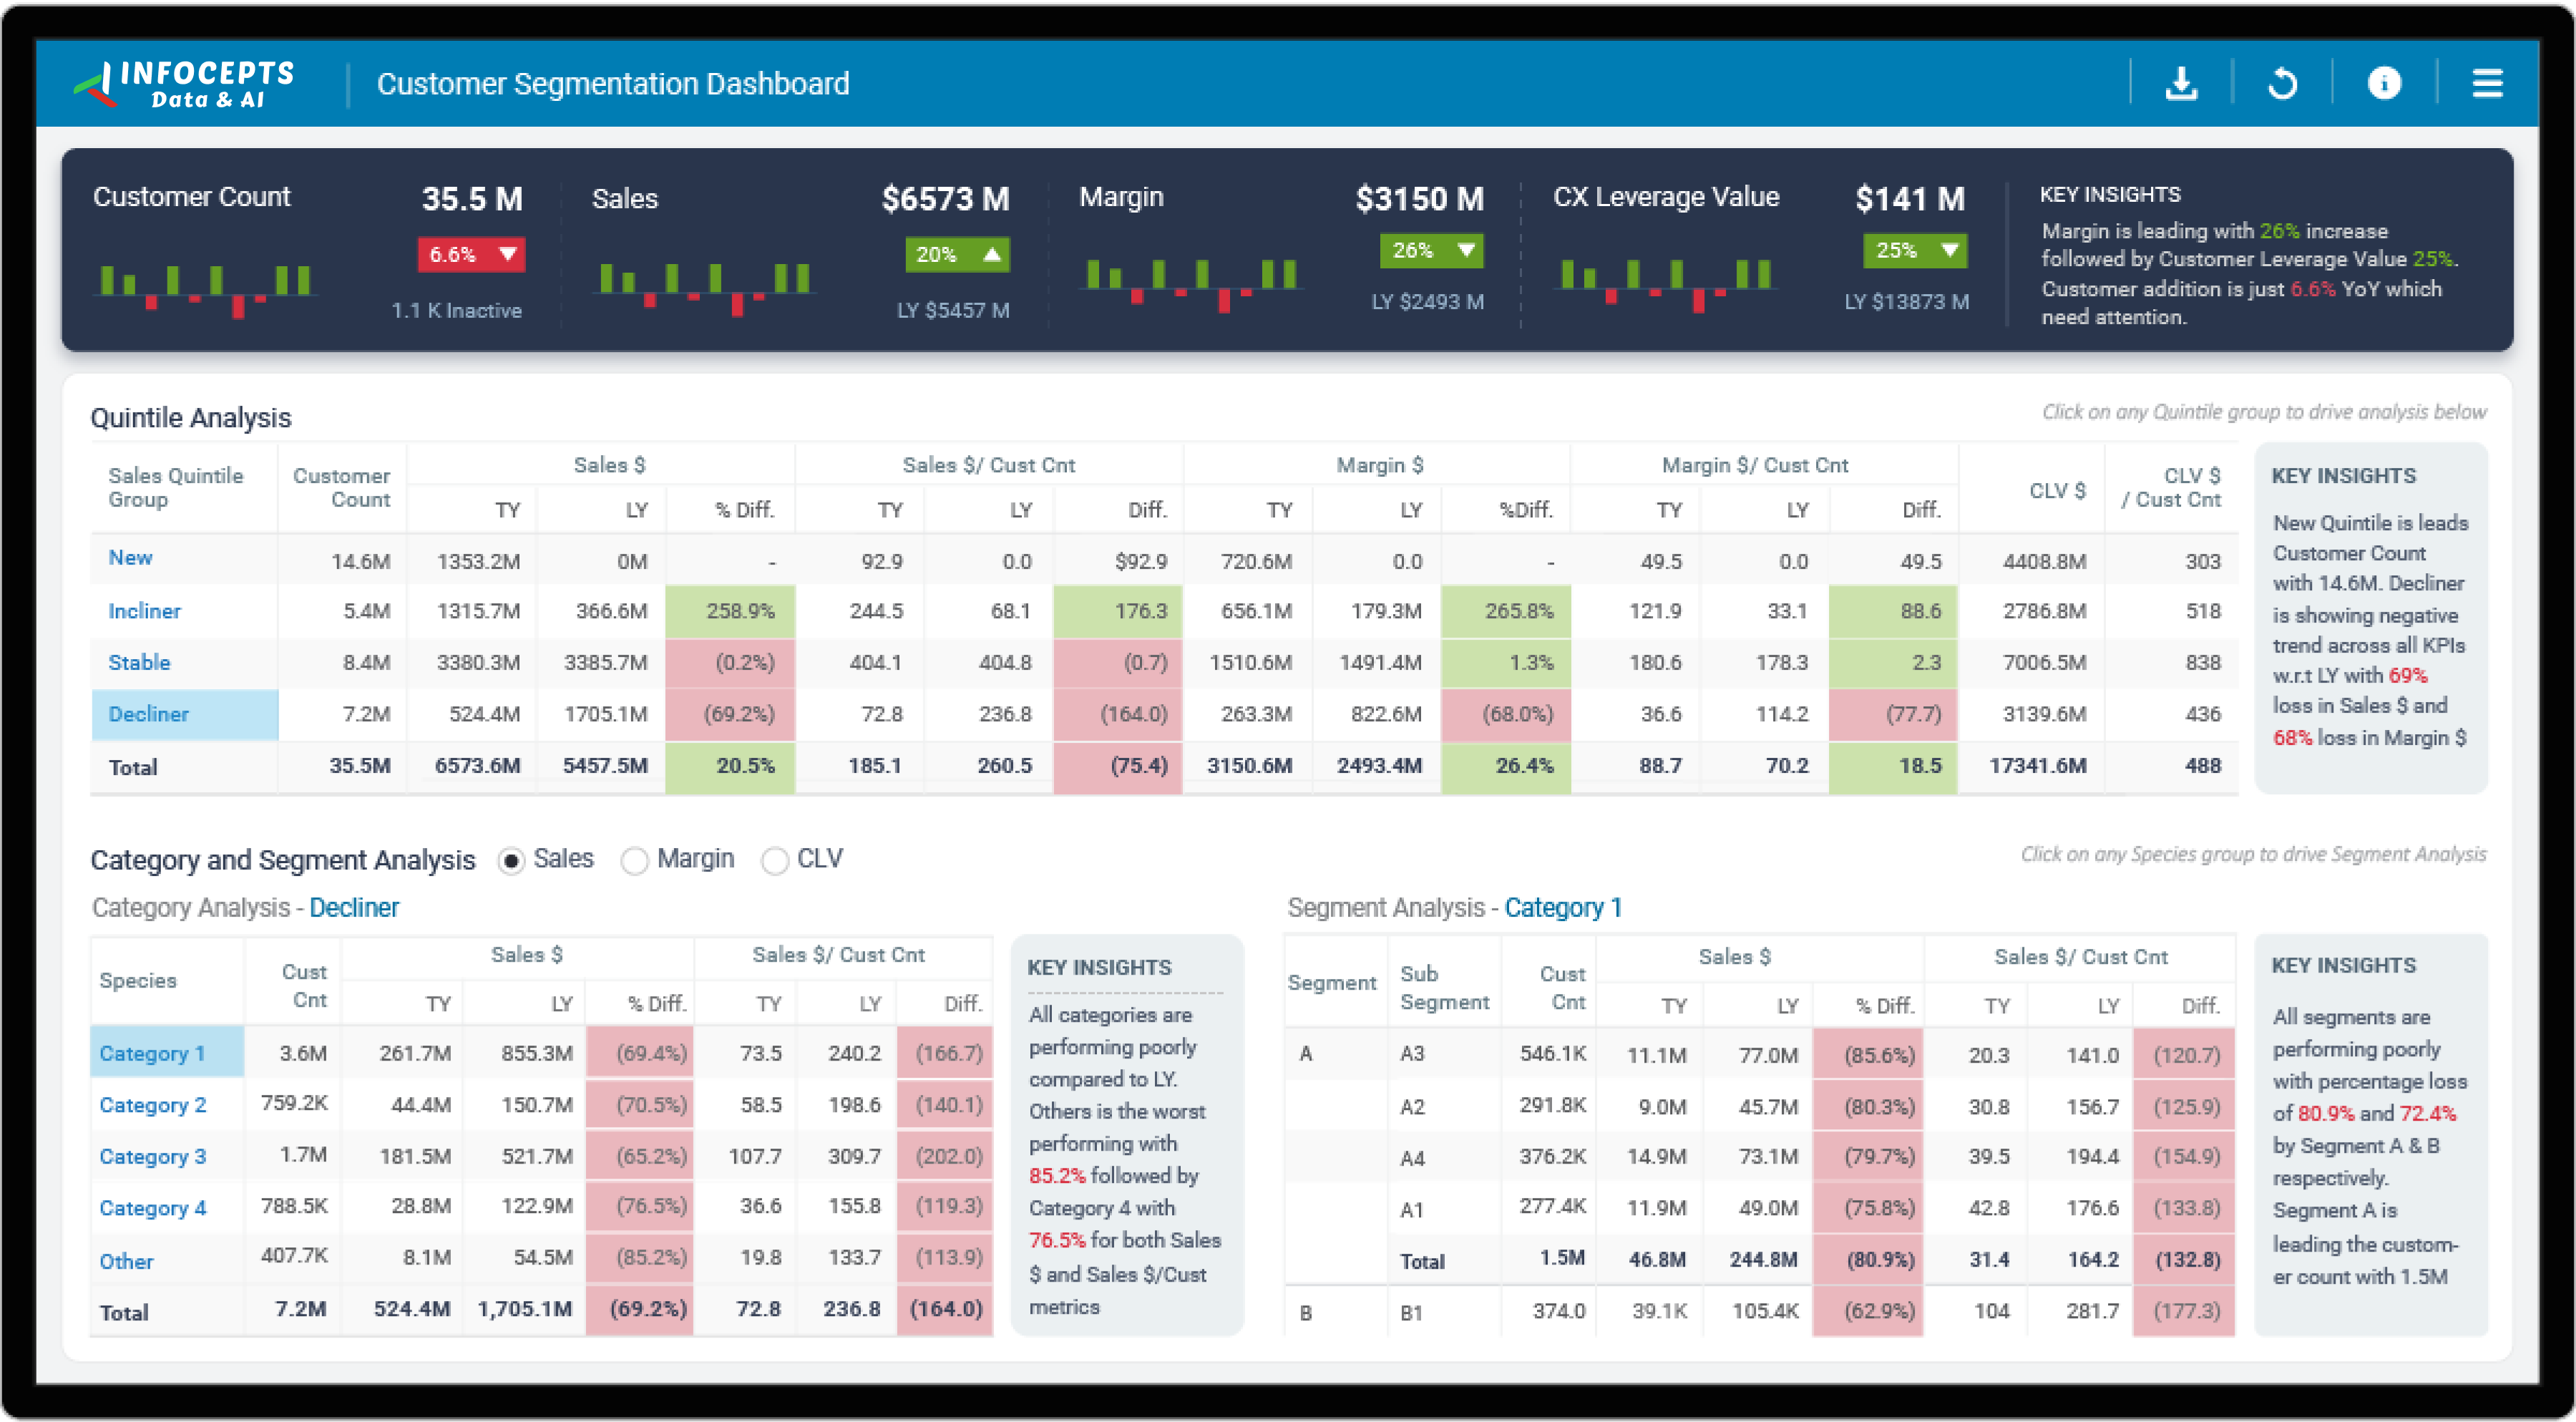
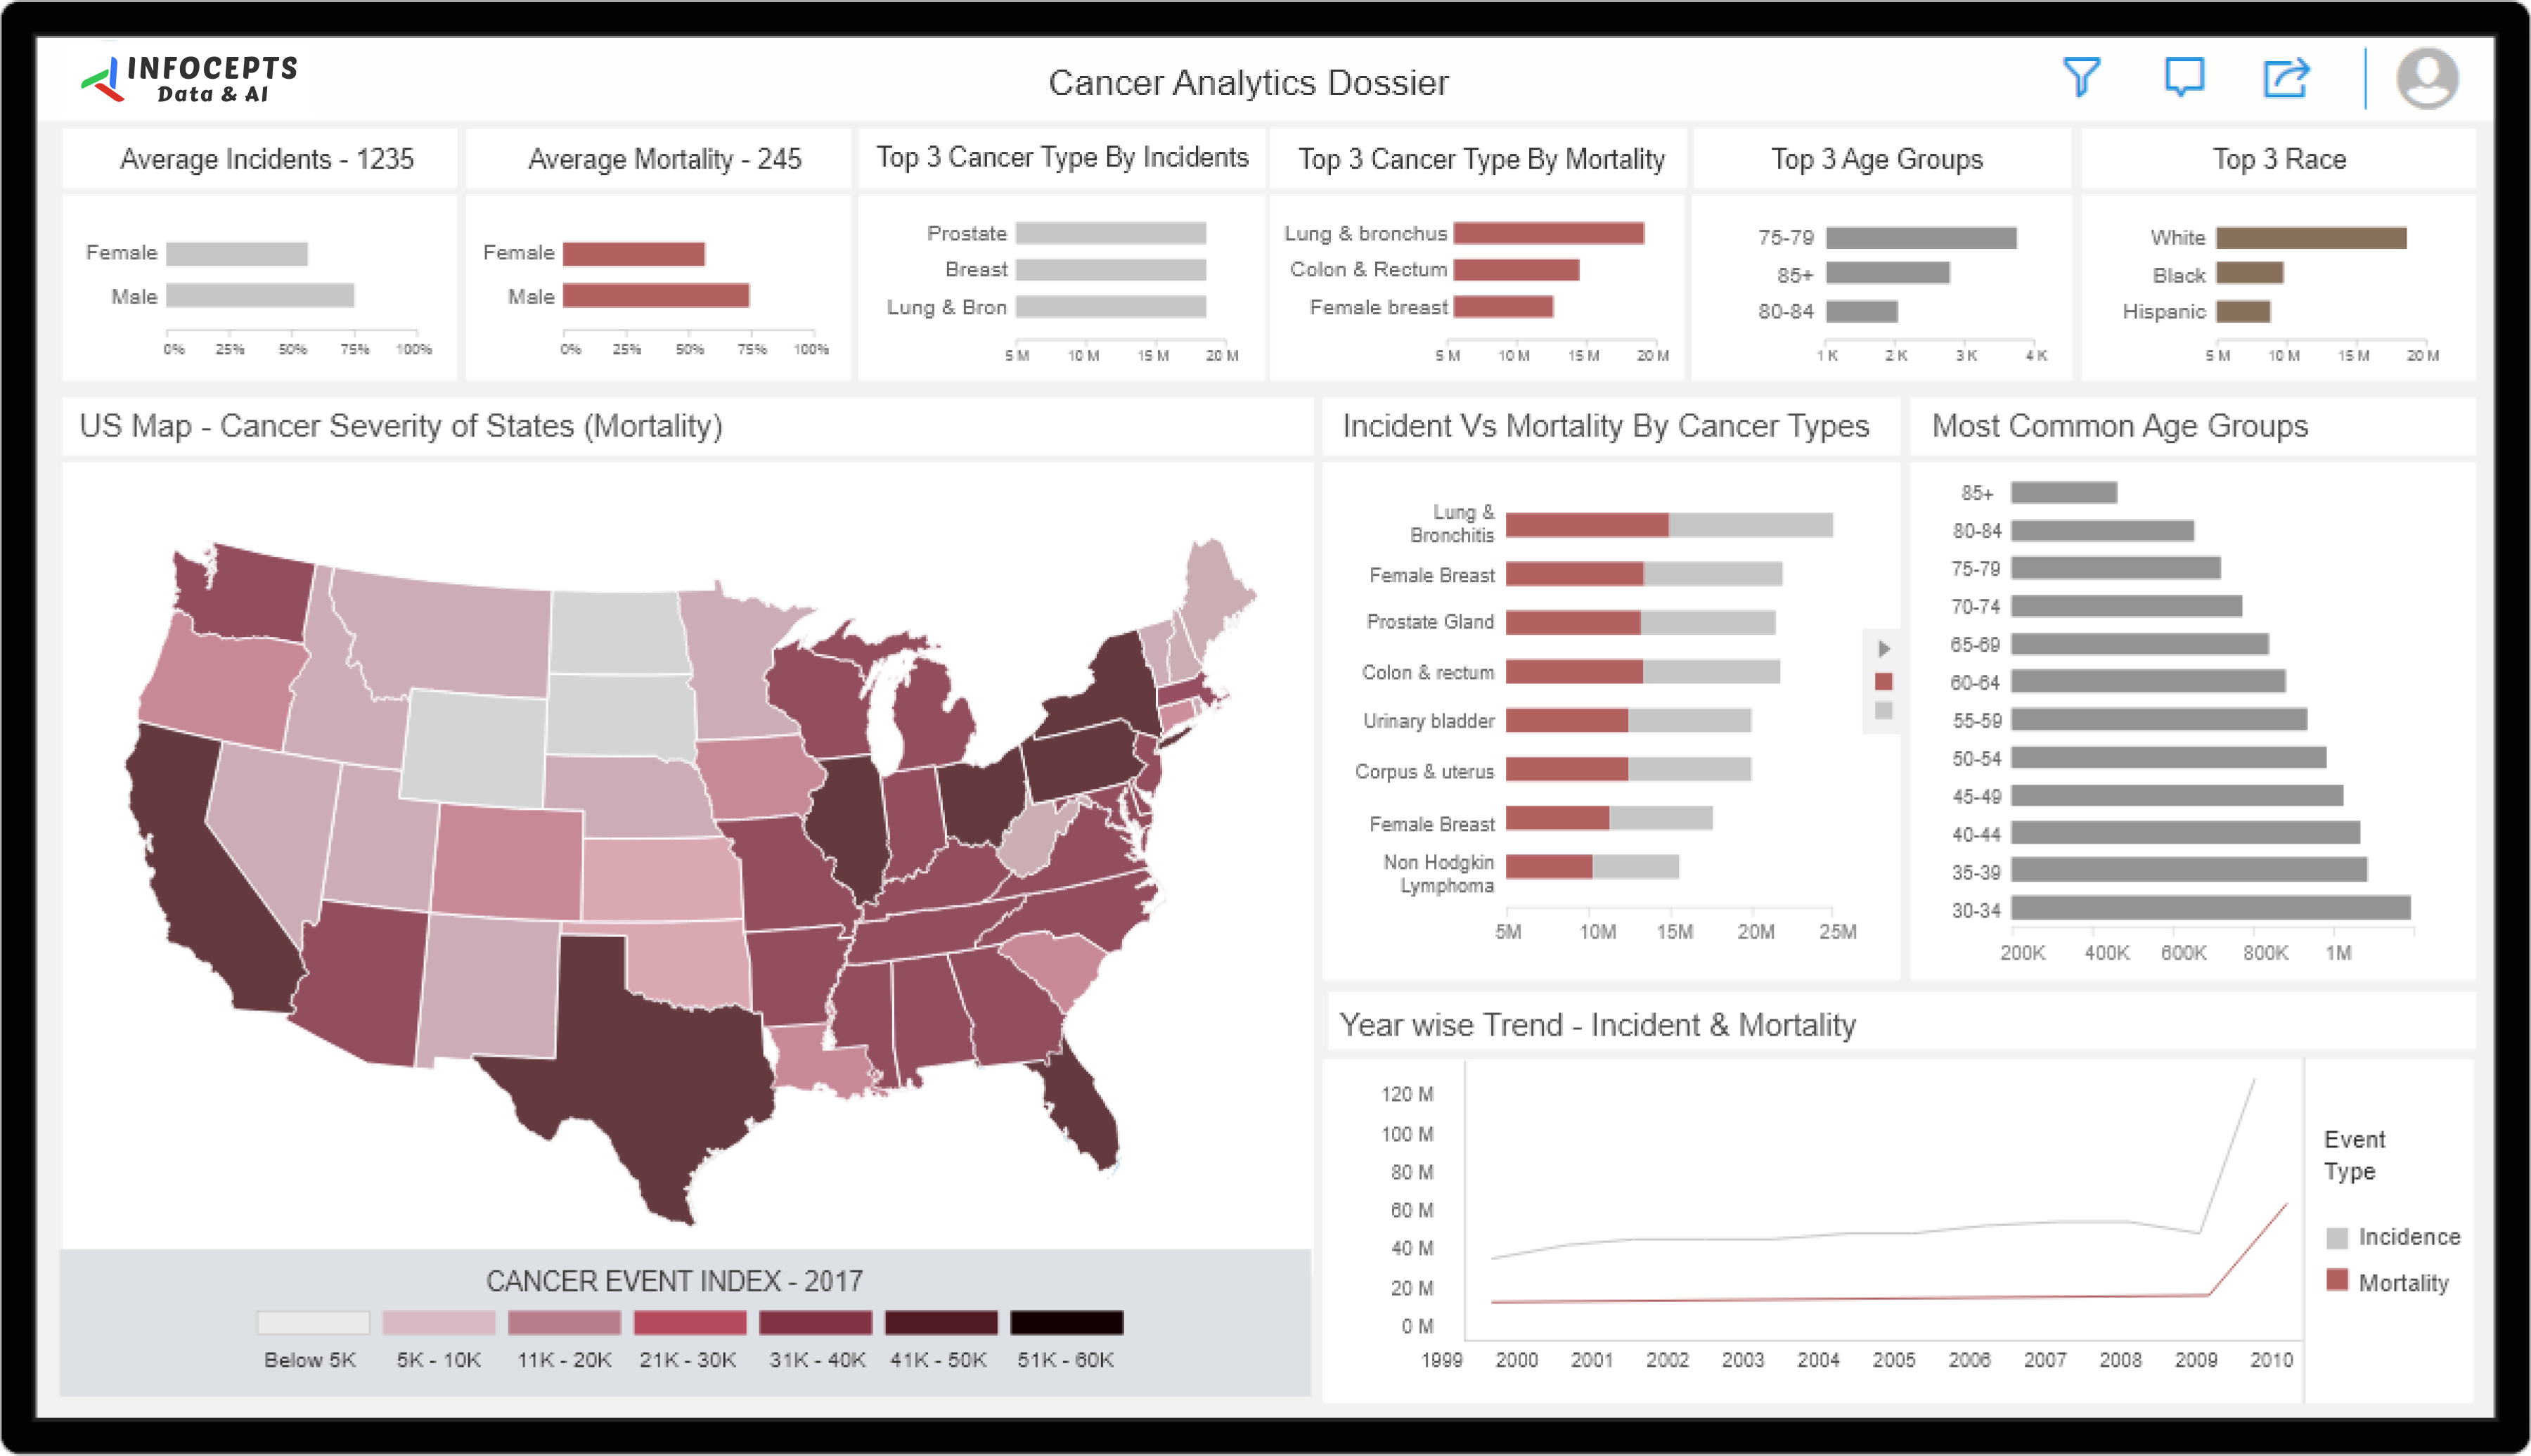
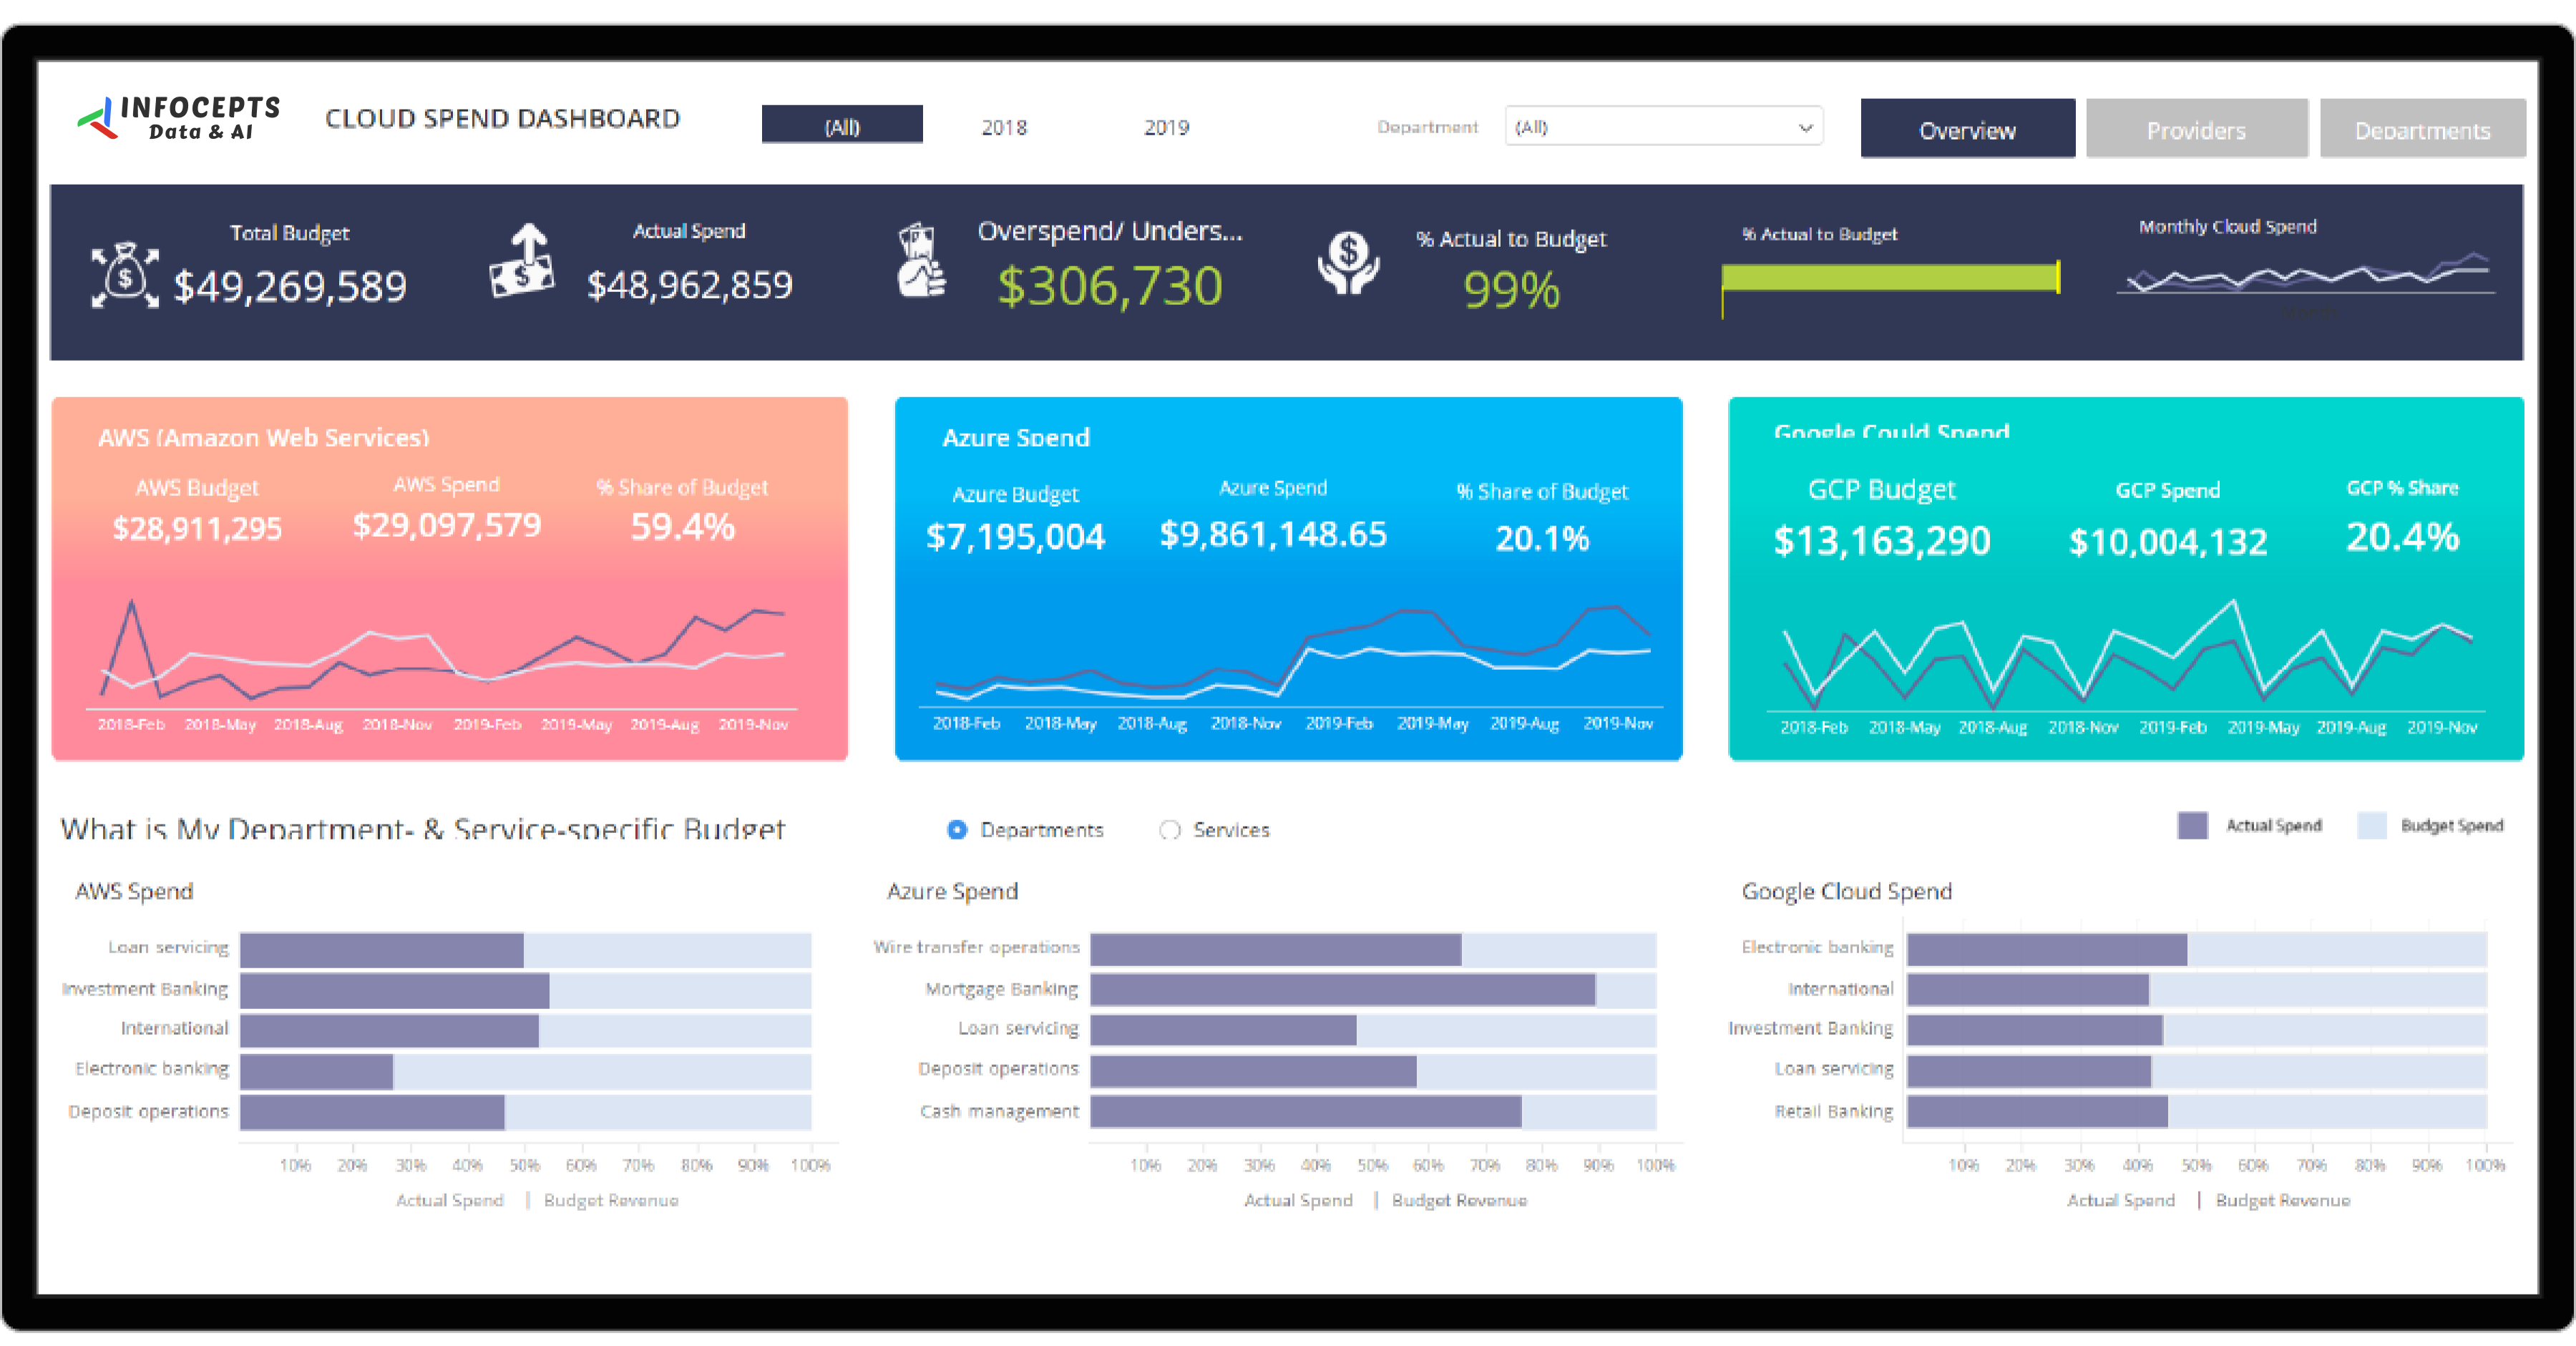
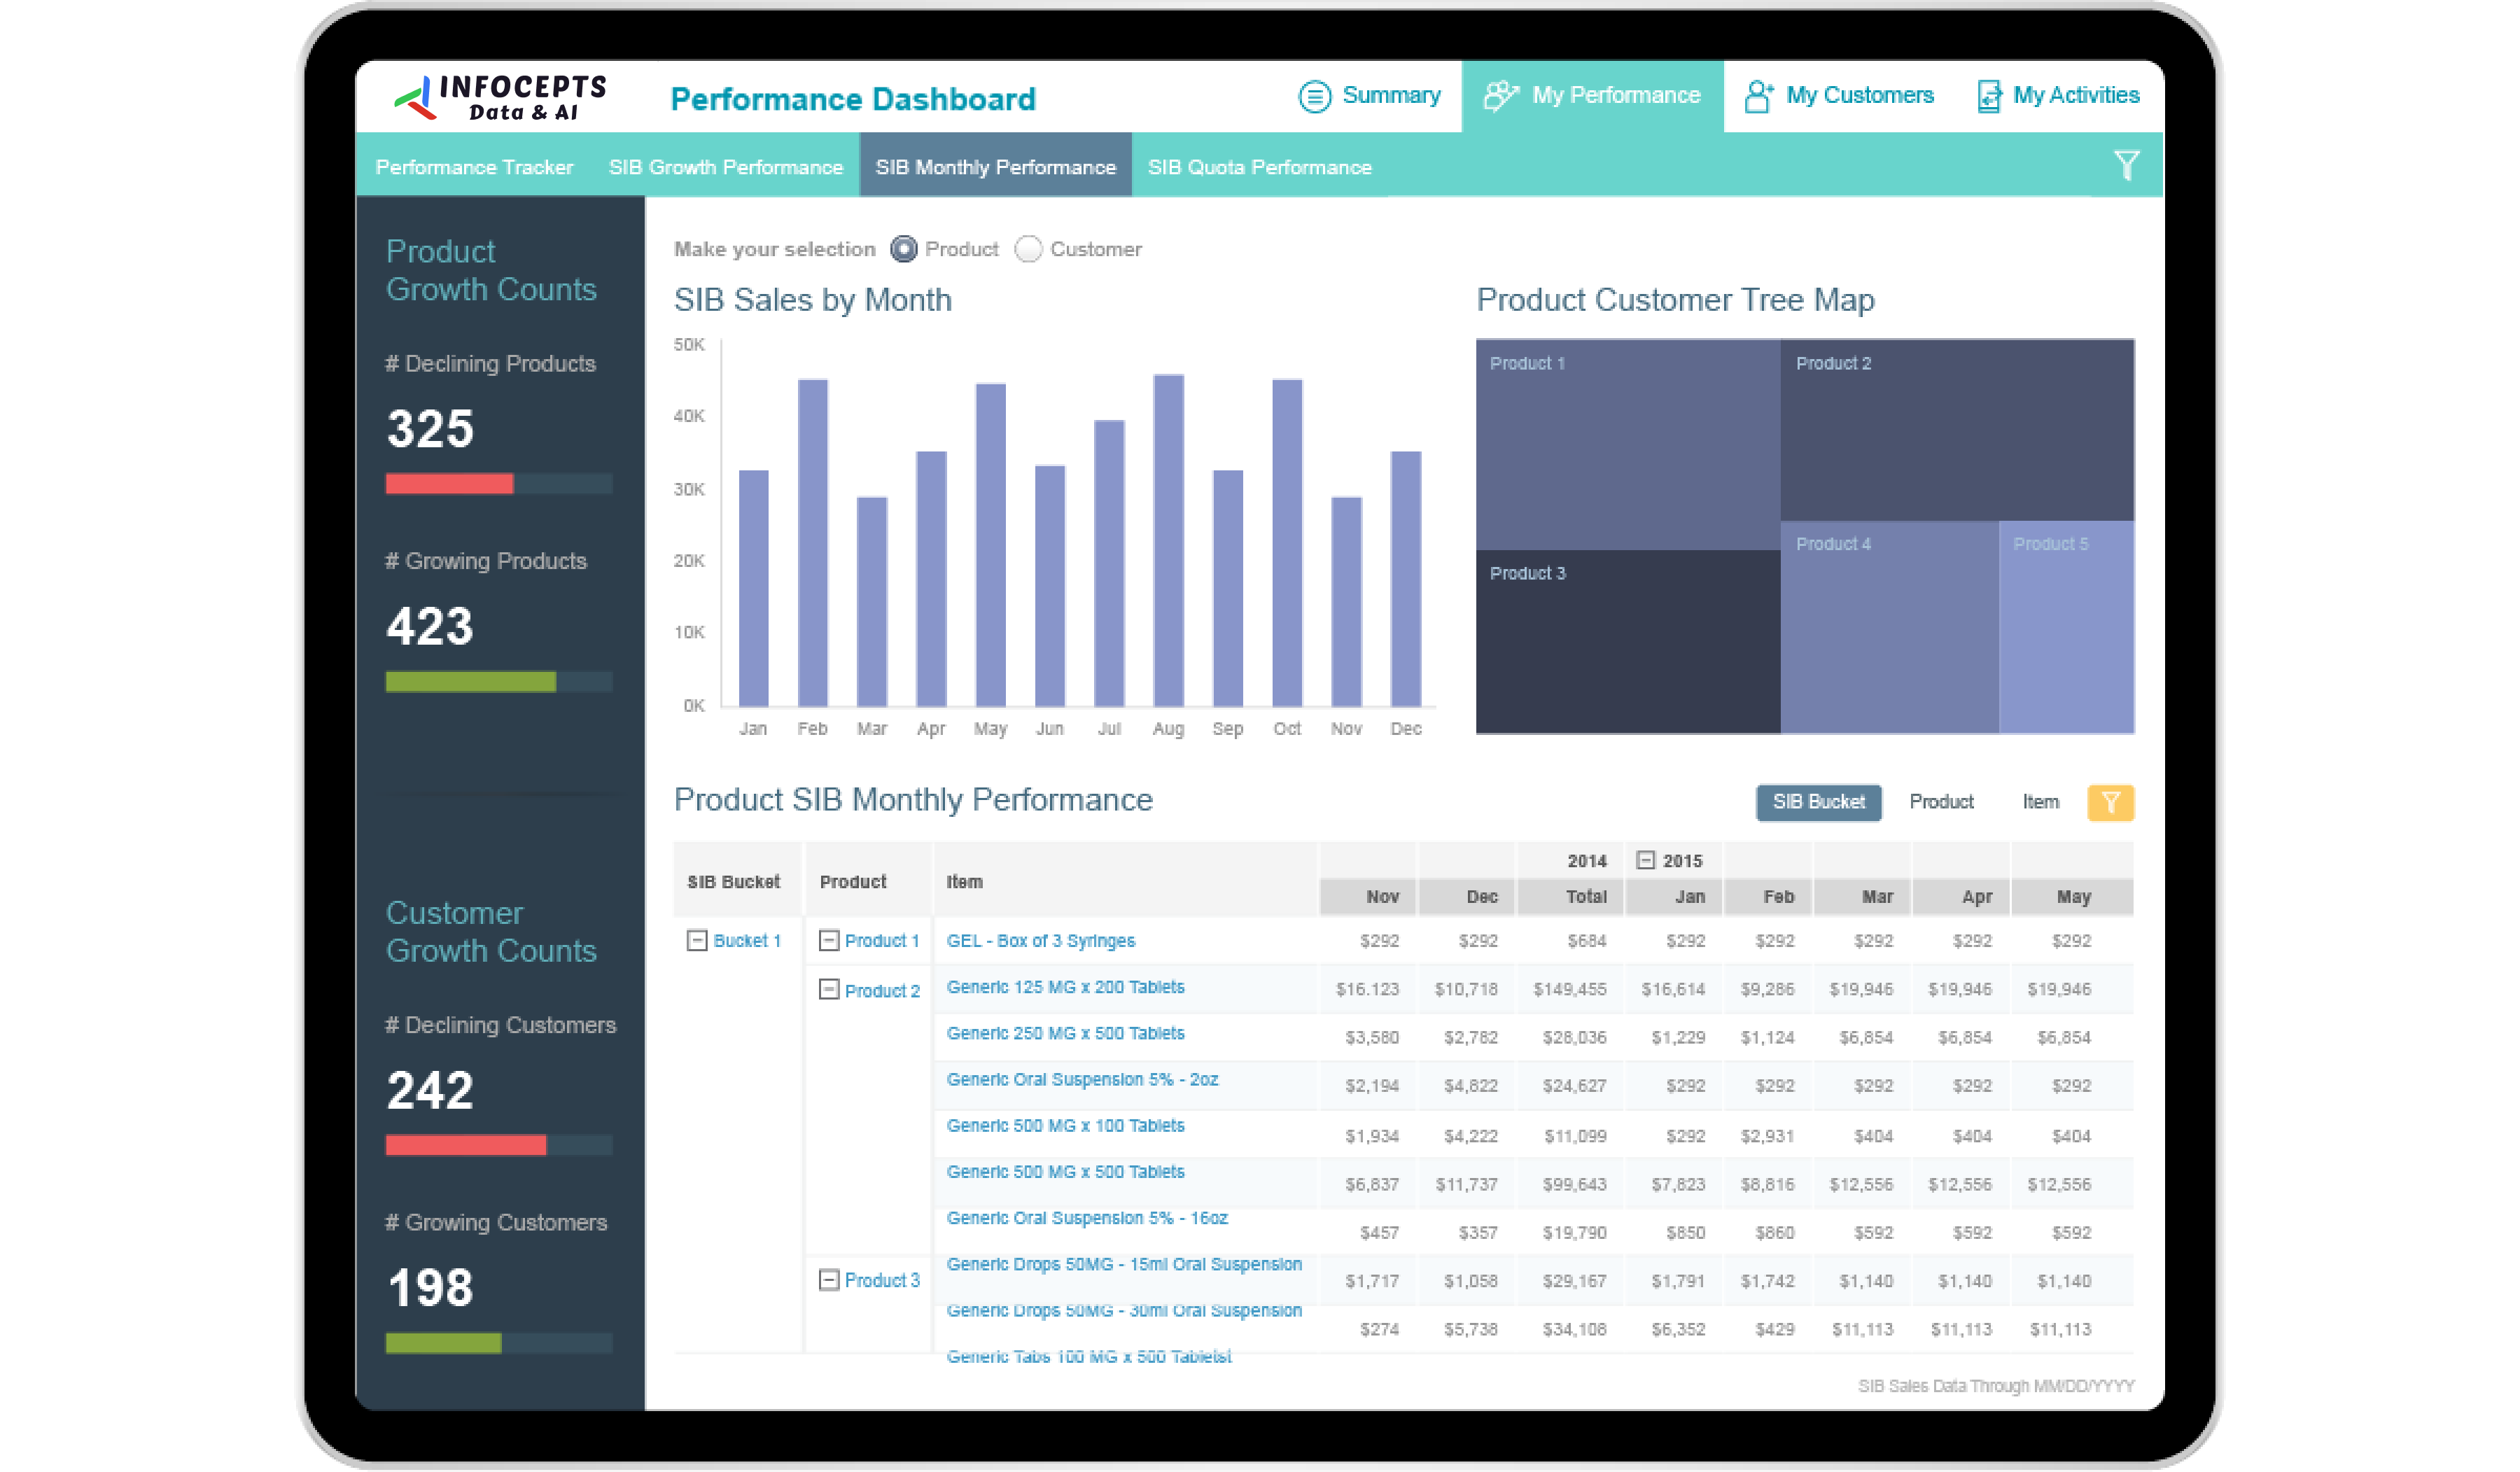
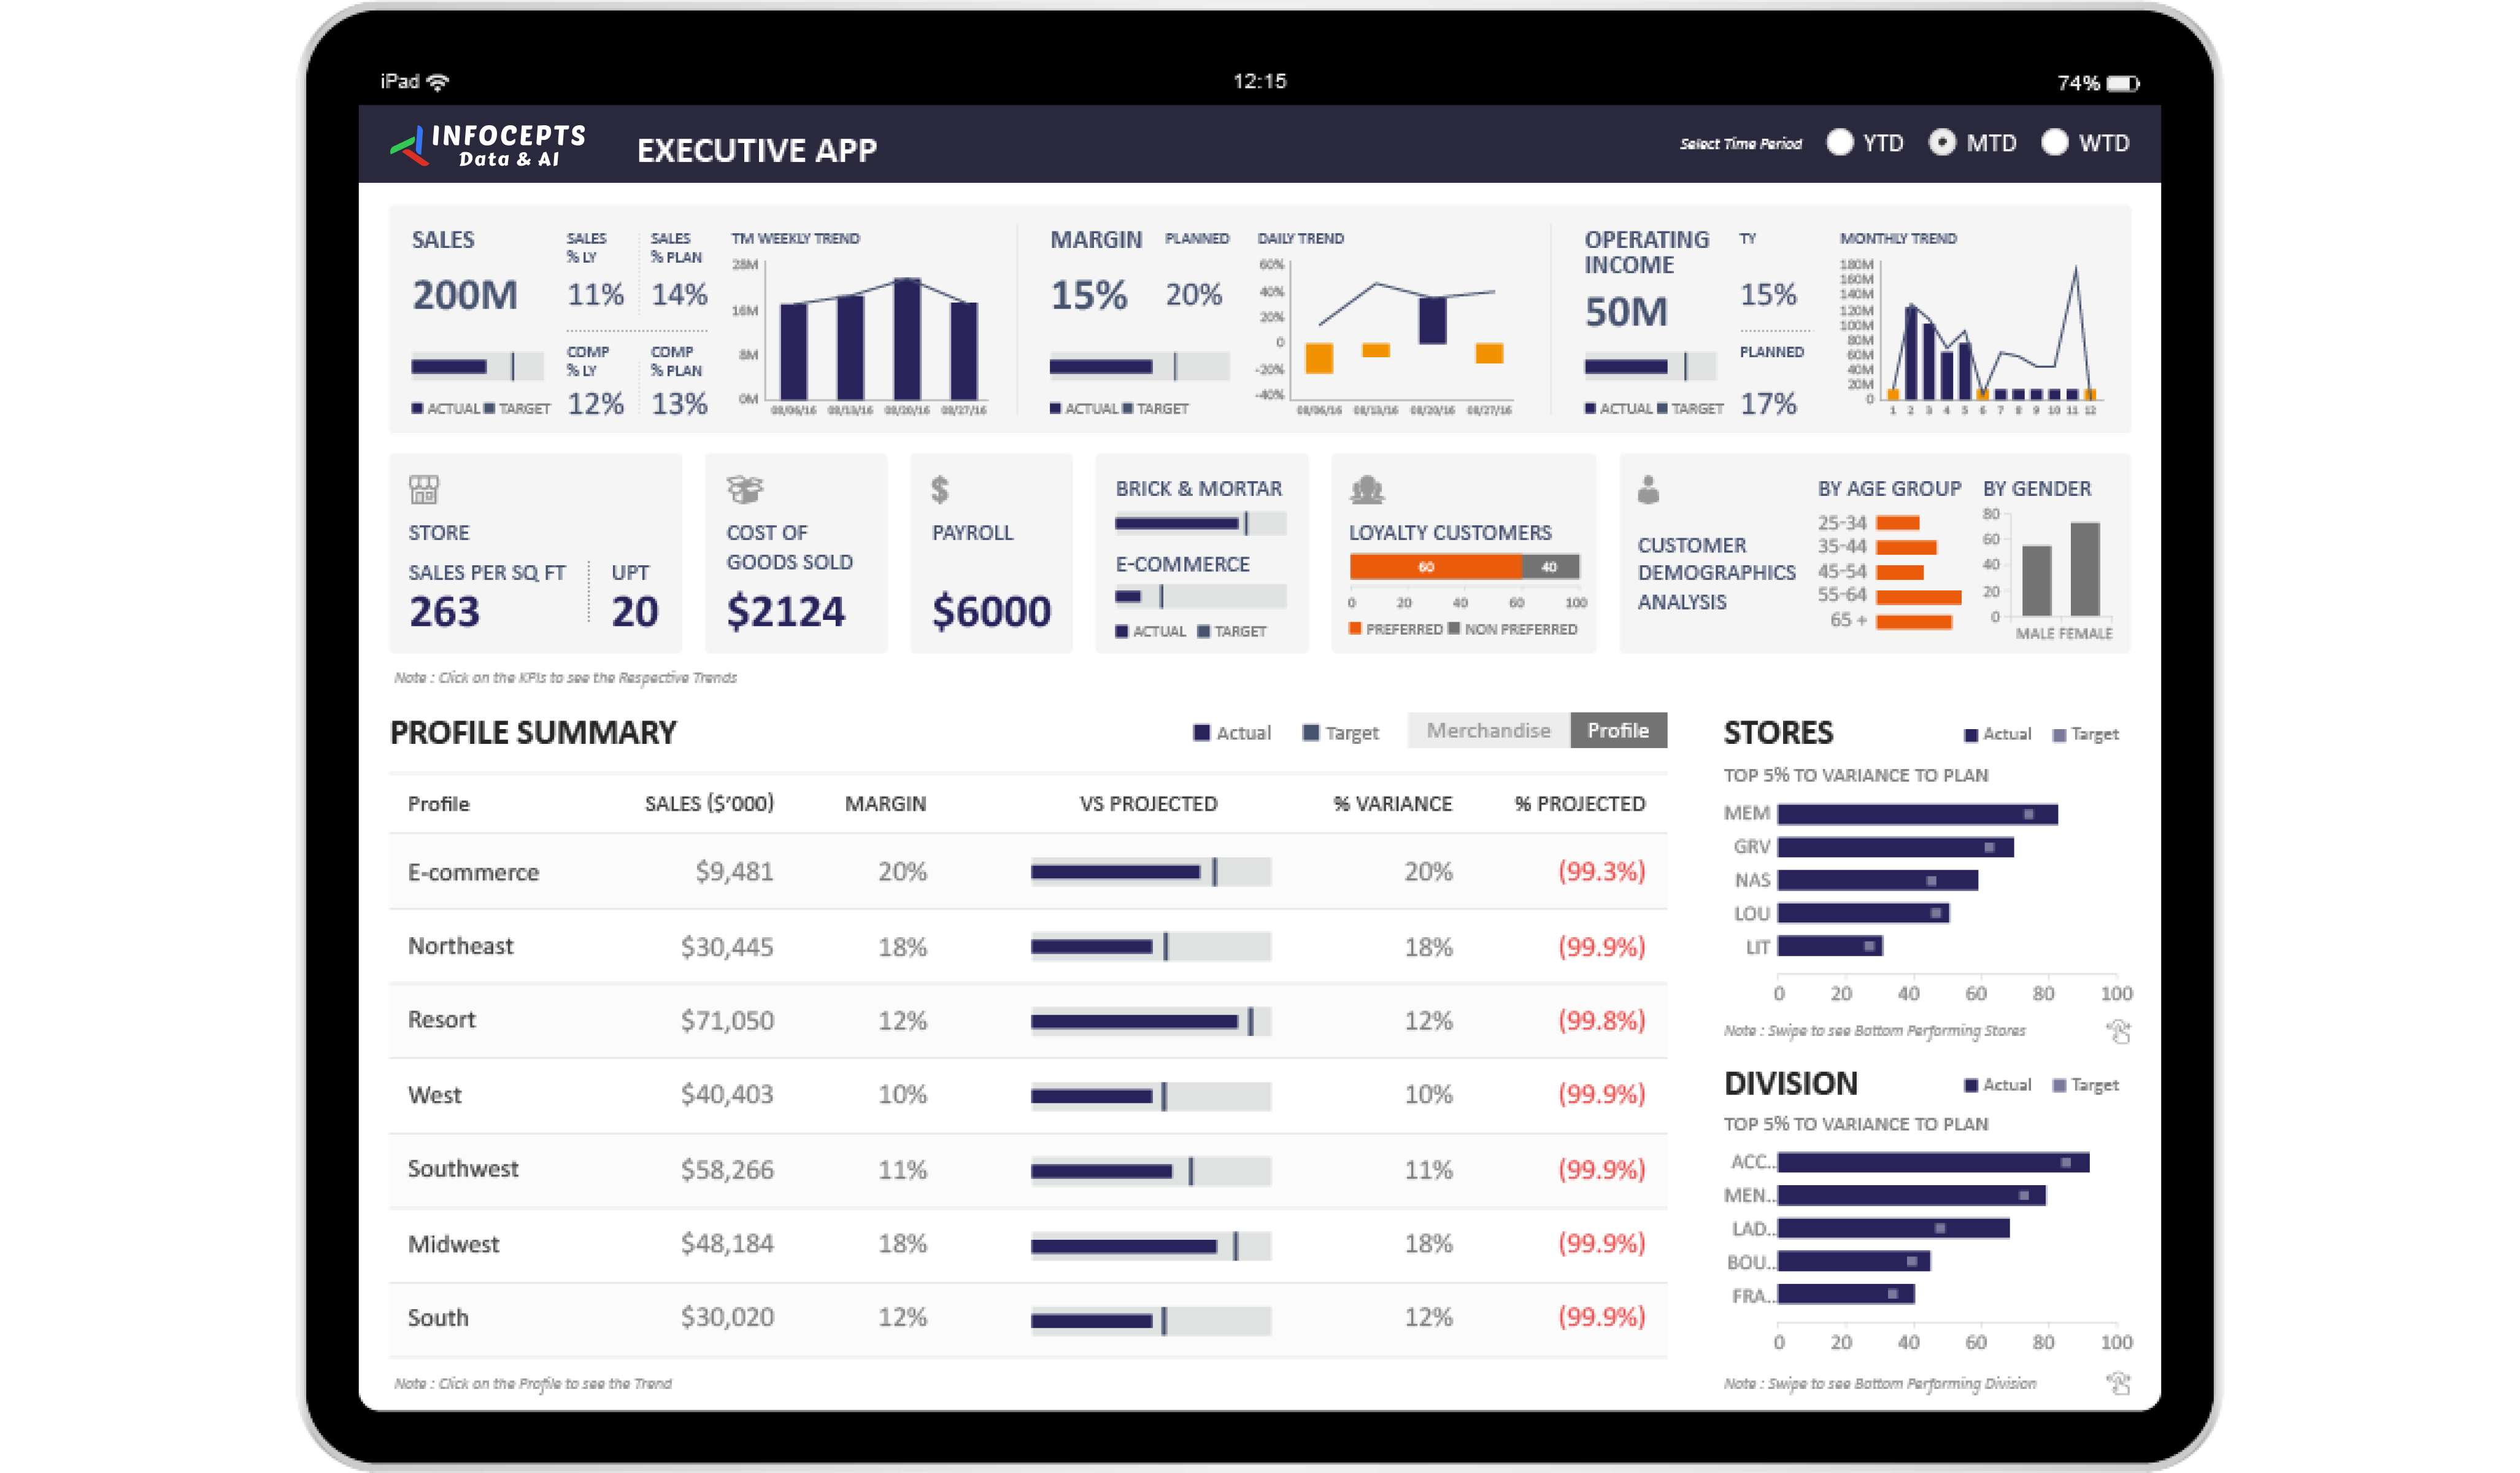
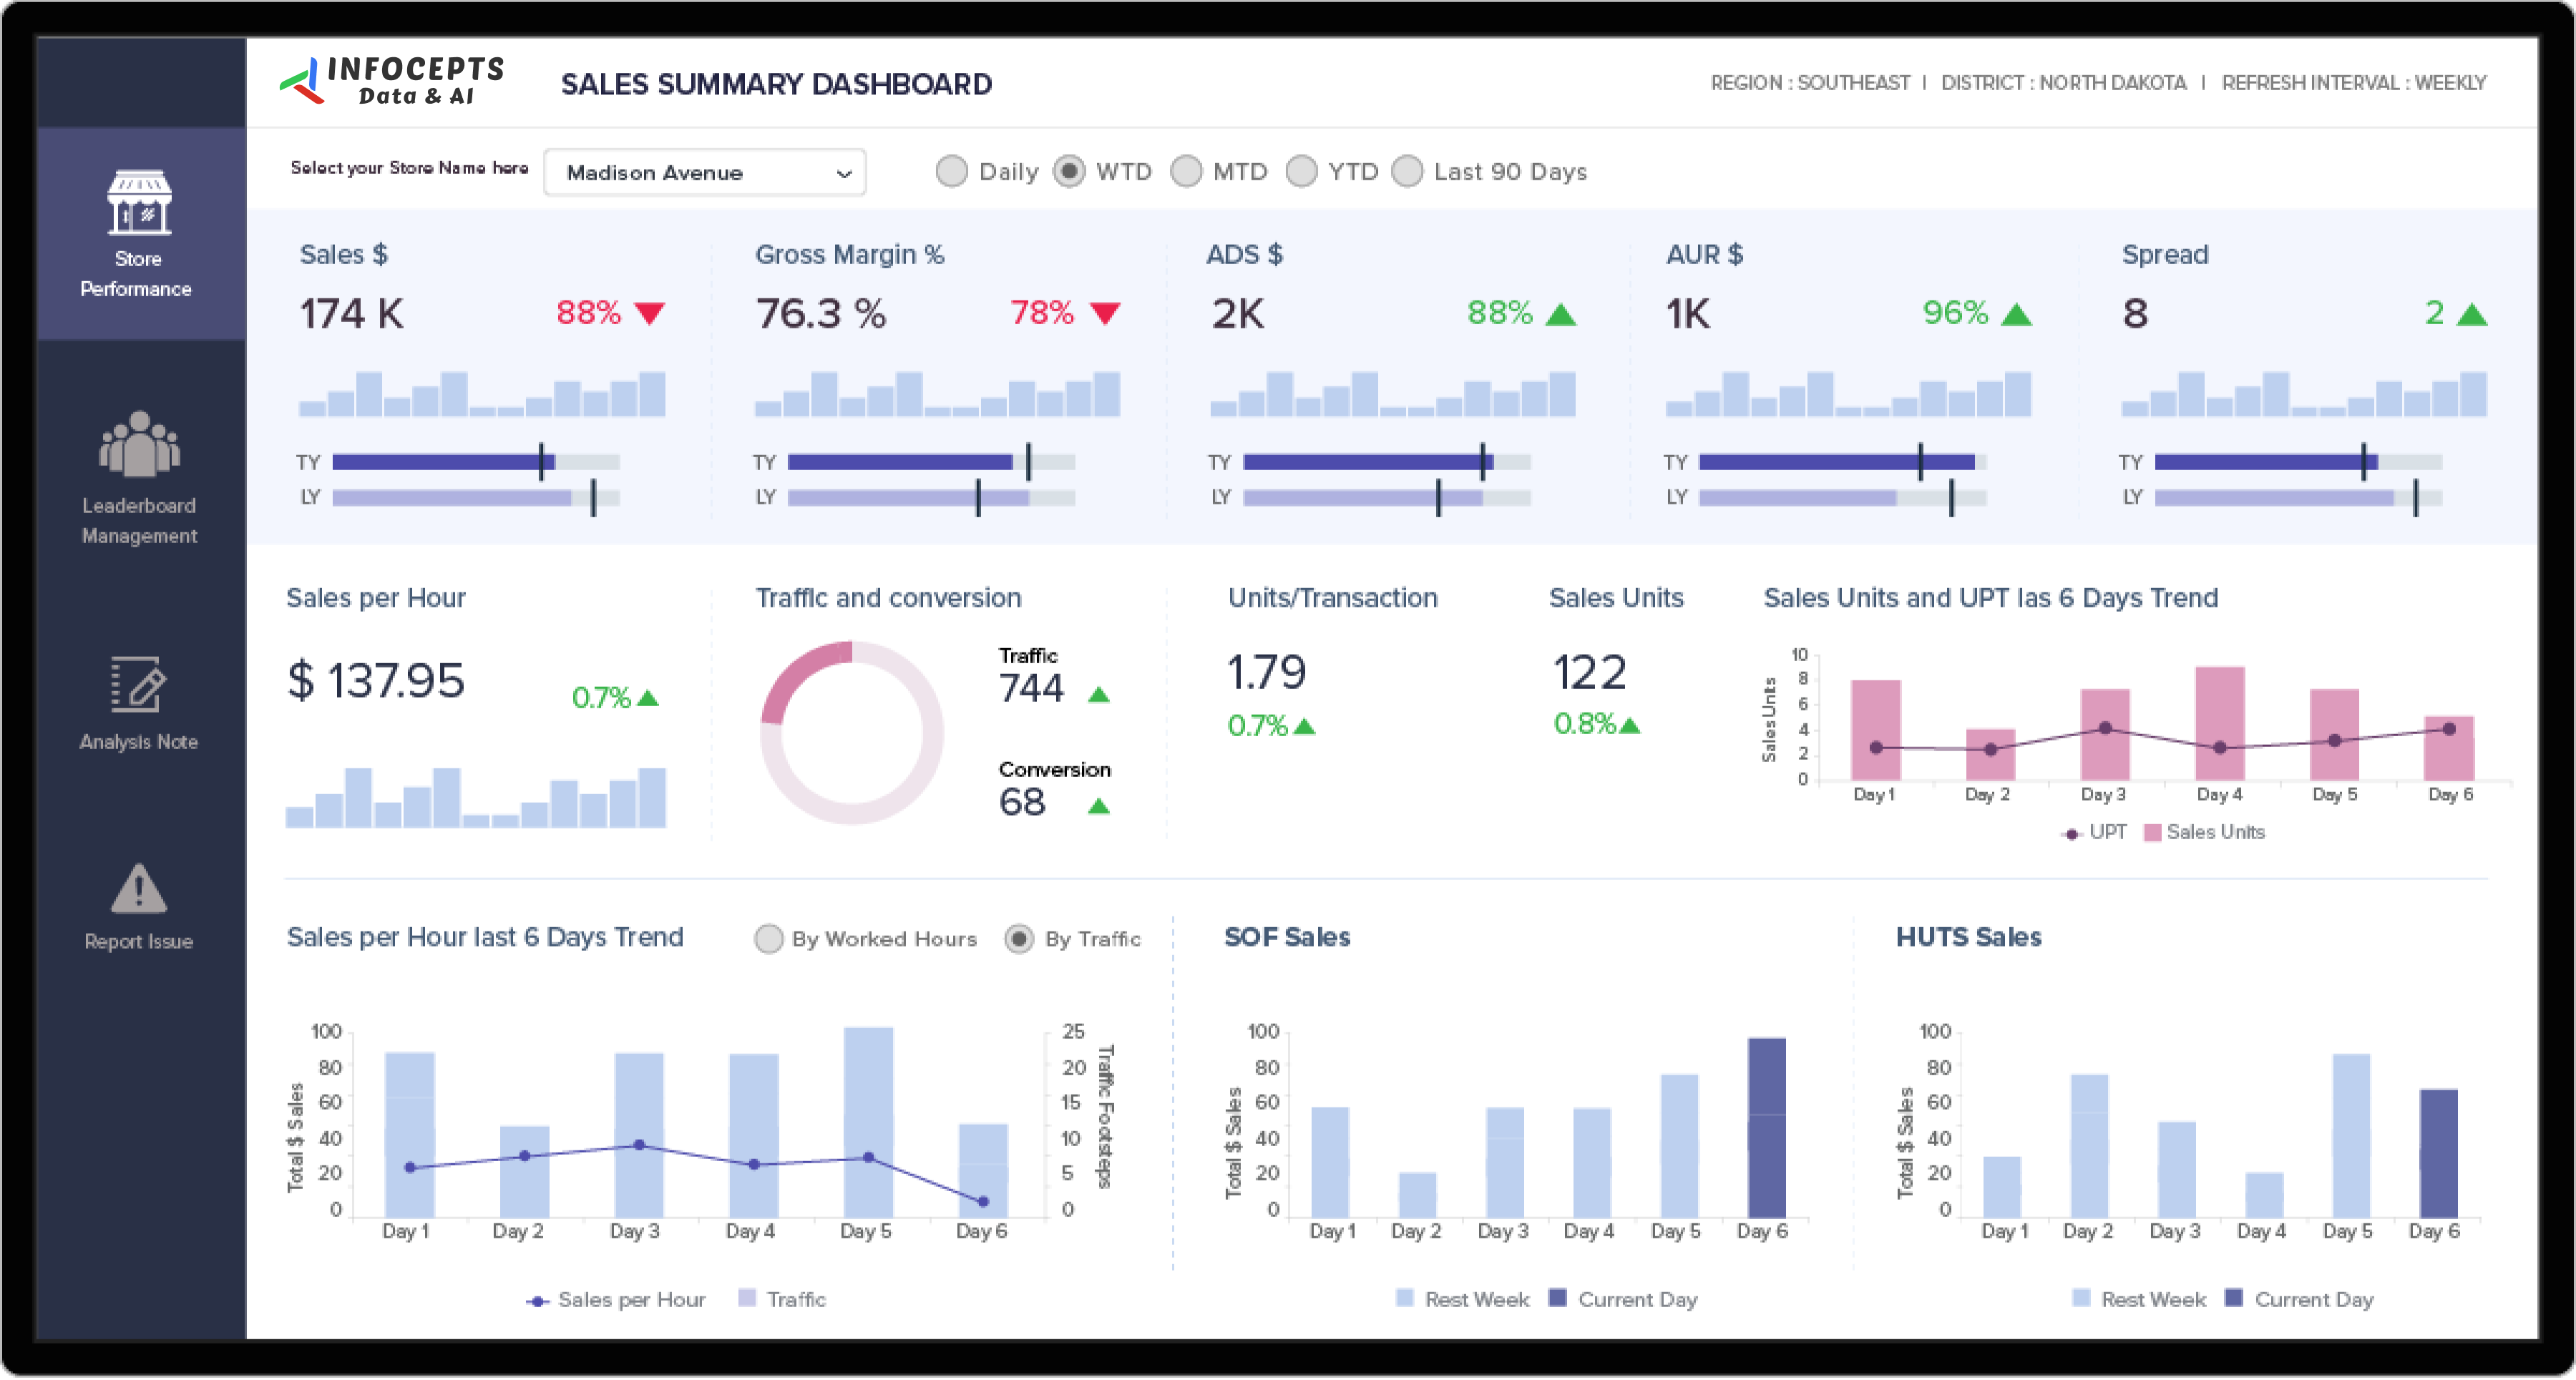
Delivers real-time insights into trading performance, risk exposure, and financial accuracy. Intuitive visualizations and advanced analytics reduce analysis time and enhance decision-making for traders and financial teams. The dashboard identifies patterns, highlights risk areas, and provides performance metrics to support data-driven trading strategies, ensuring financial accuracy and optimized market operations.
Frequently asked questions
A trading performance dashboard is a real-time reporting tool that brings trading activity, risk exposure, and market performance into a single view, so trading desks and finance teams can spot patterns and react faster than static end-of-day reports allow.
Common metrics include profit and loss by desk or trader, risk exposure against defined limits, trade volume and execution quality, performance against benchmarks, and exception or error rates, configured to match how a specific trading floor actually reports.
Traditional financial reports are periodic and backward-looking. A trading dashboard refreshes in real time or near real time, so risk and performance issues surface while there is still time to act on them, not after the trading day has closed.
Timeline depends more on data readiness than on dashboard design. Firms with clean, accessible trading and risk data can typically see a working first version within a few weeks, with metric definitions and governance review usually taking longer than the dashboard build itself.
Infocepts builds these on the platform a firm already standardizes on, including MicroStrategy, Power BI, Tableau, or Qlik, connected to trading, risk, and market data sources through Business Analytics services so the dashboard fits existing governance and security models.
A trading dashboard is typically one view inside a larger financial services data platform. Infocepts’ Financial Services industry work covers the wider data and risk architecture this kind of dashboard sits on top of.

 Pranali Lanjewar