



31%
Reduced time to insight
53%
Reduced maintenance and cost efforts
89%
Precision in comparative analysis
28%
Enhanced operational efficiency
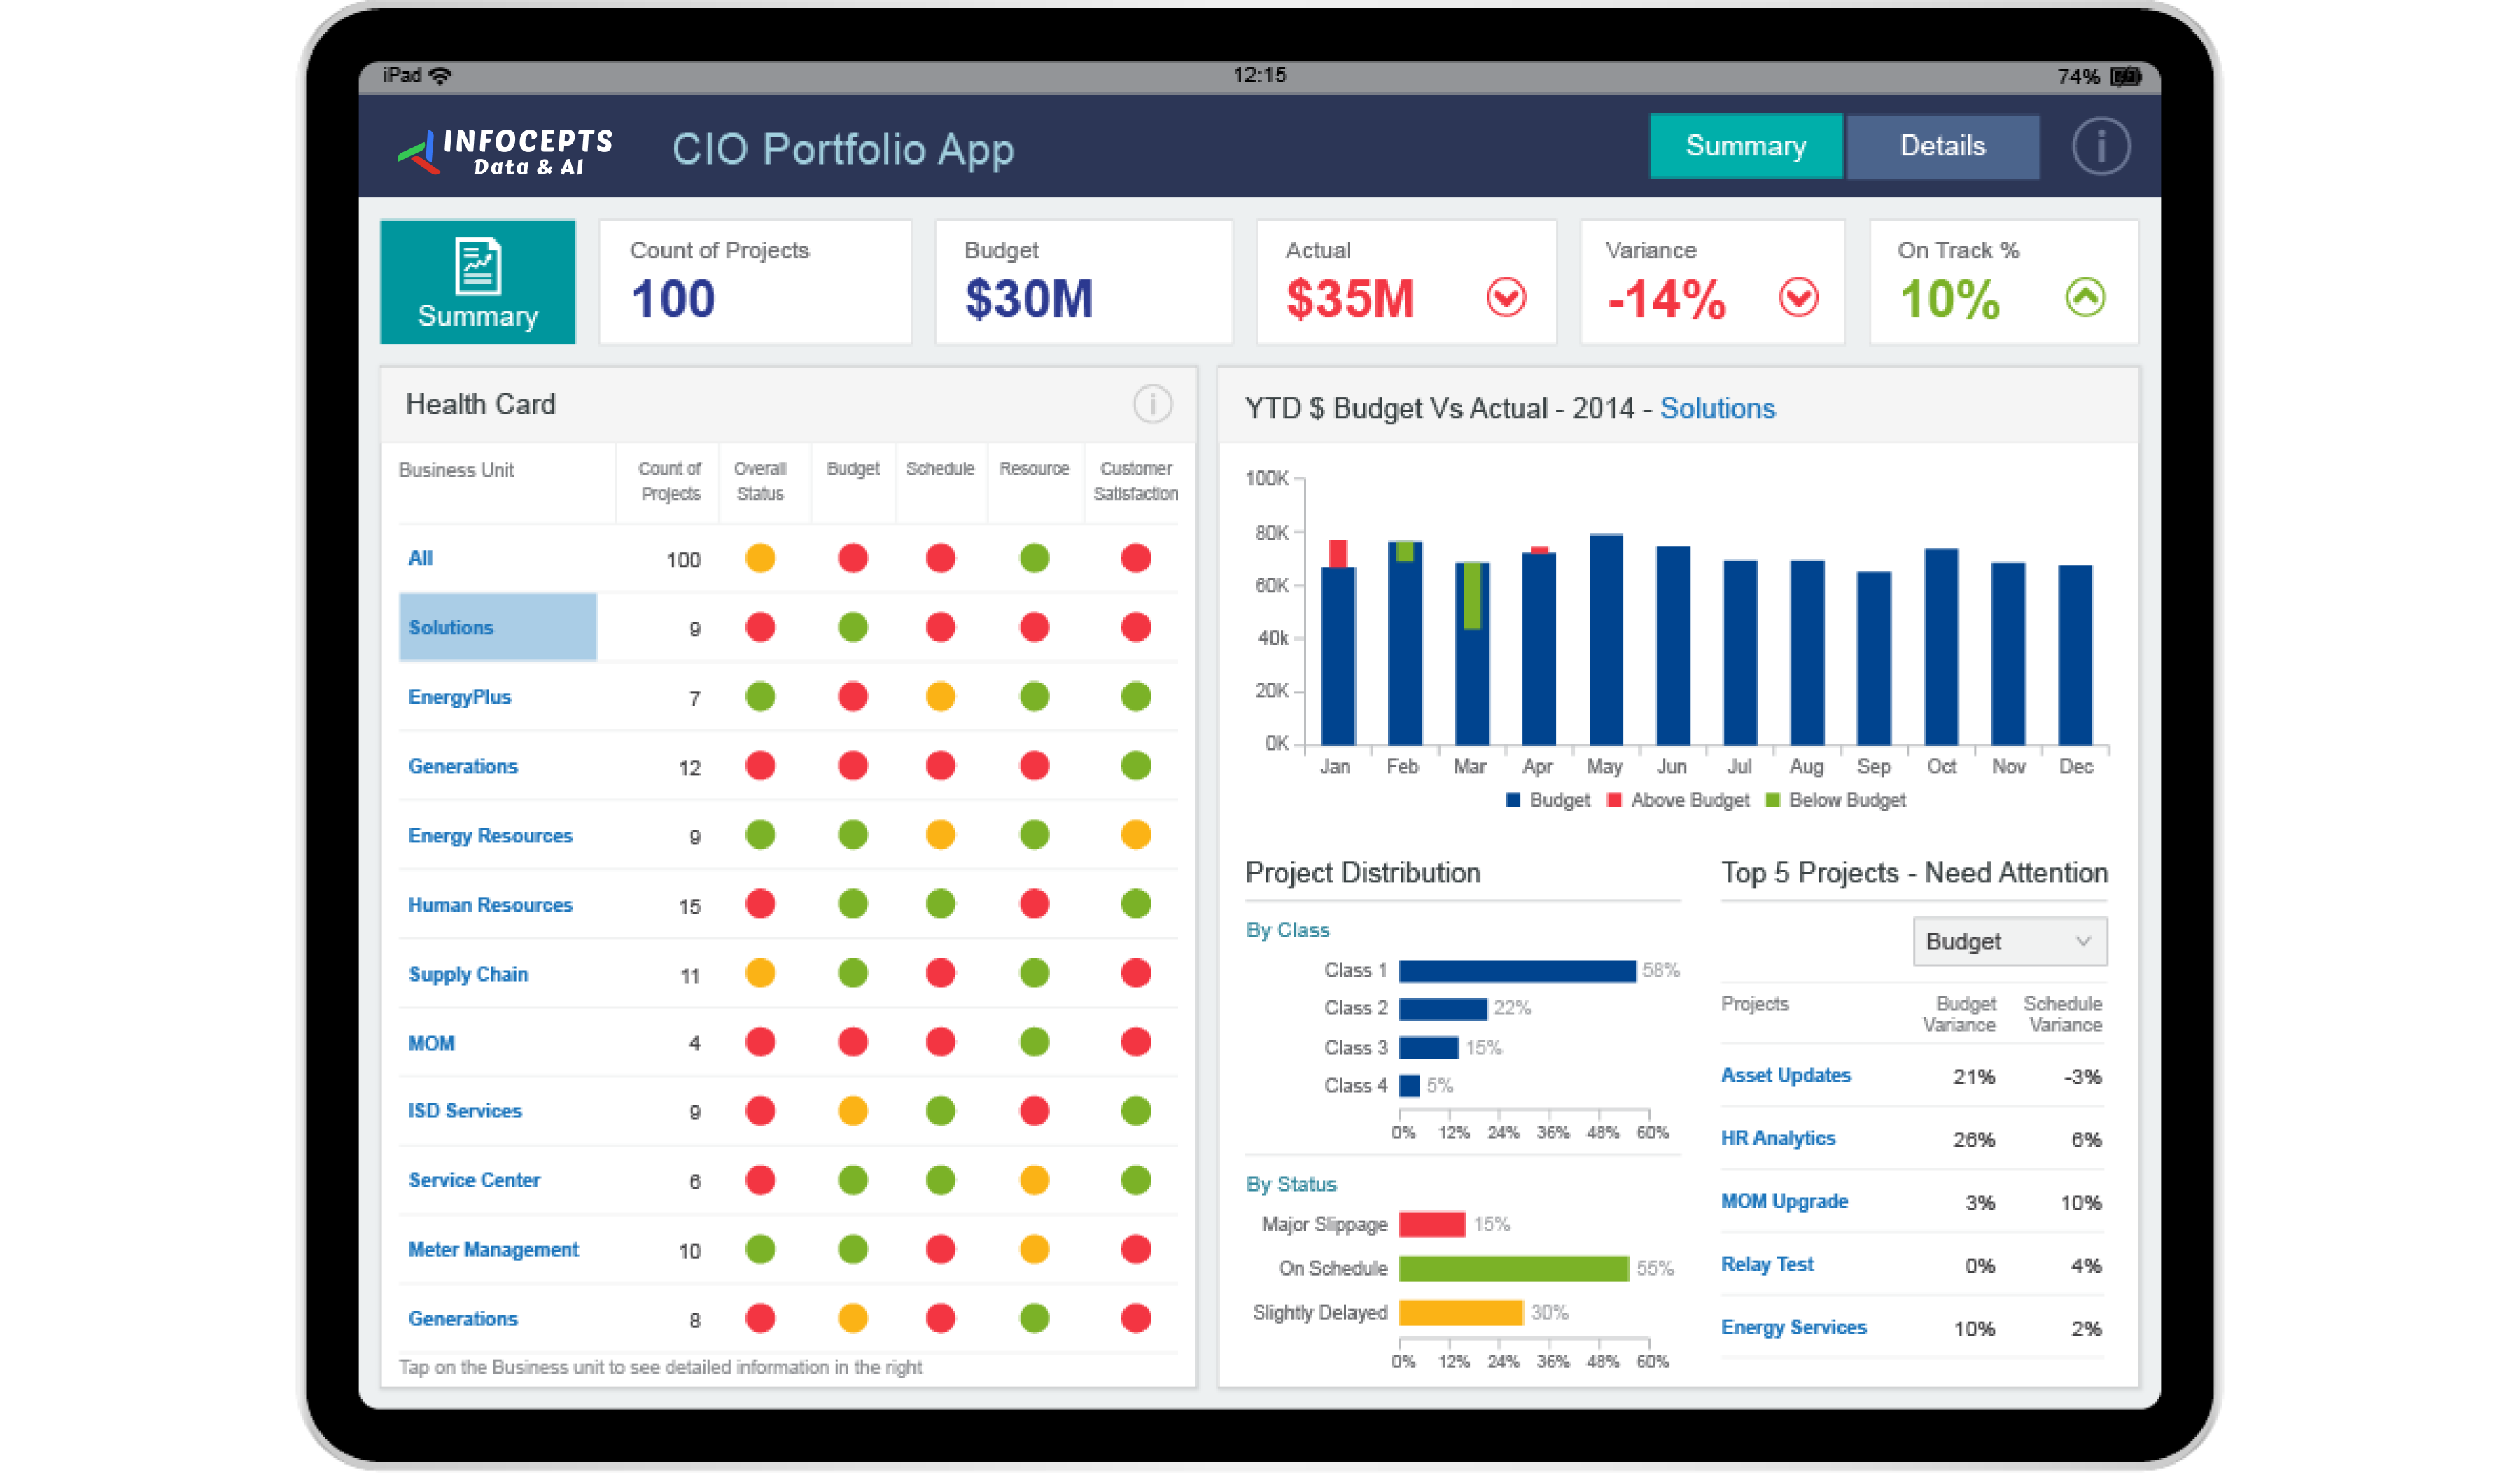
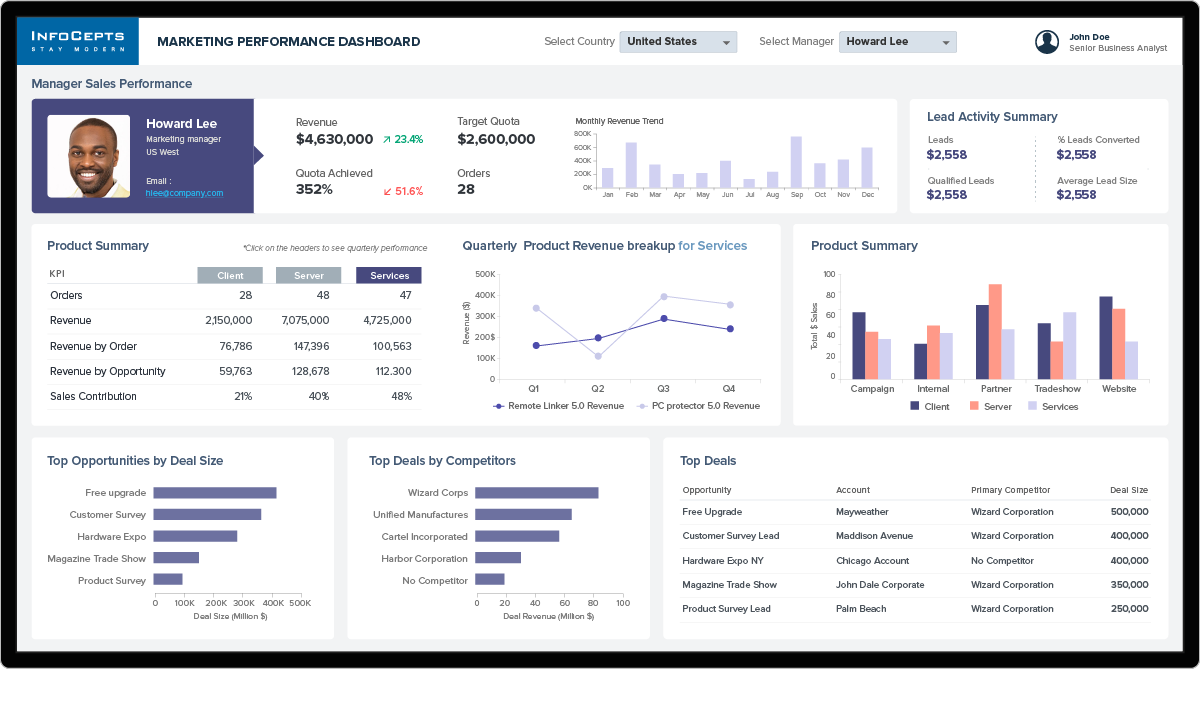
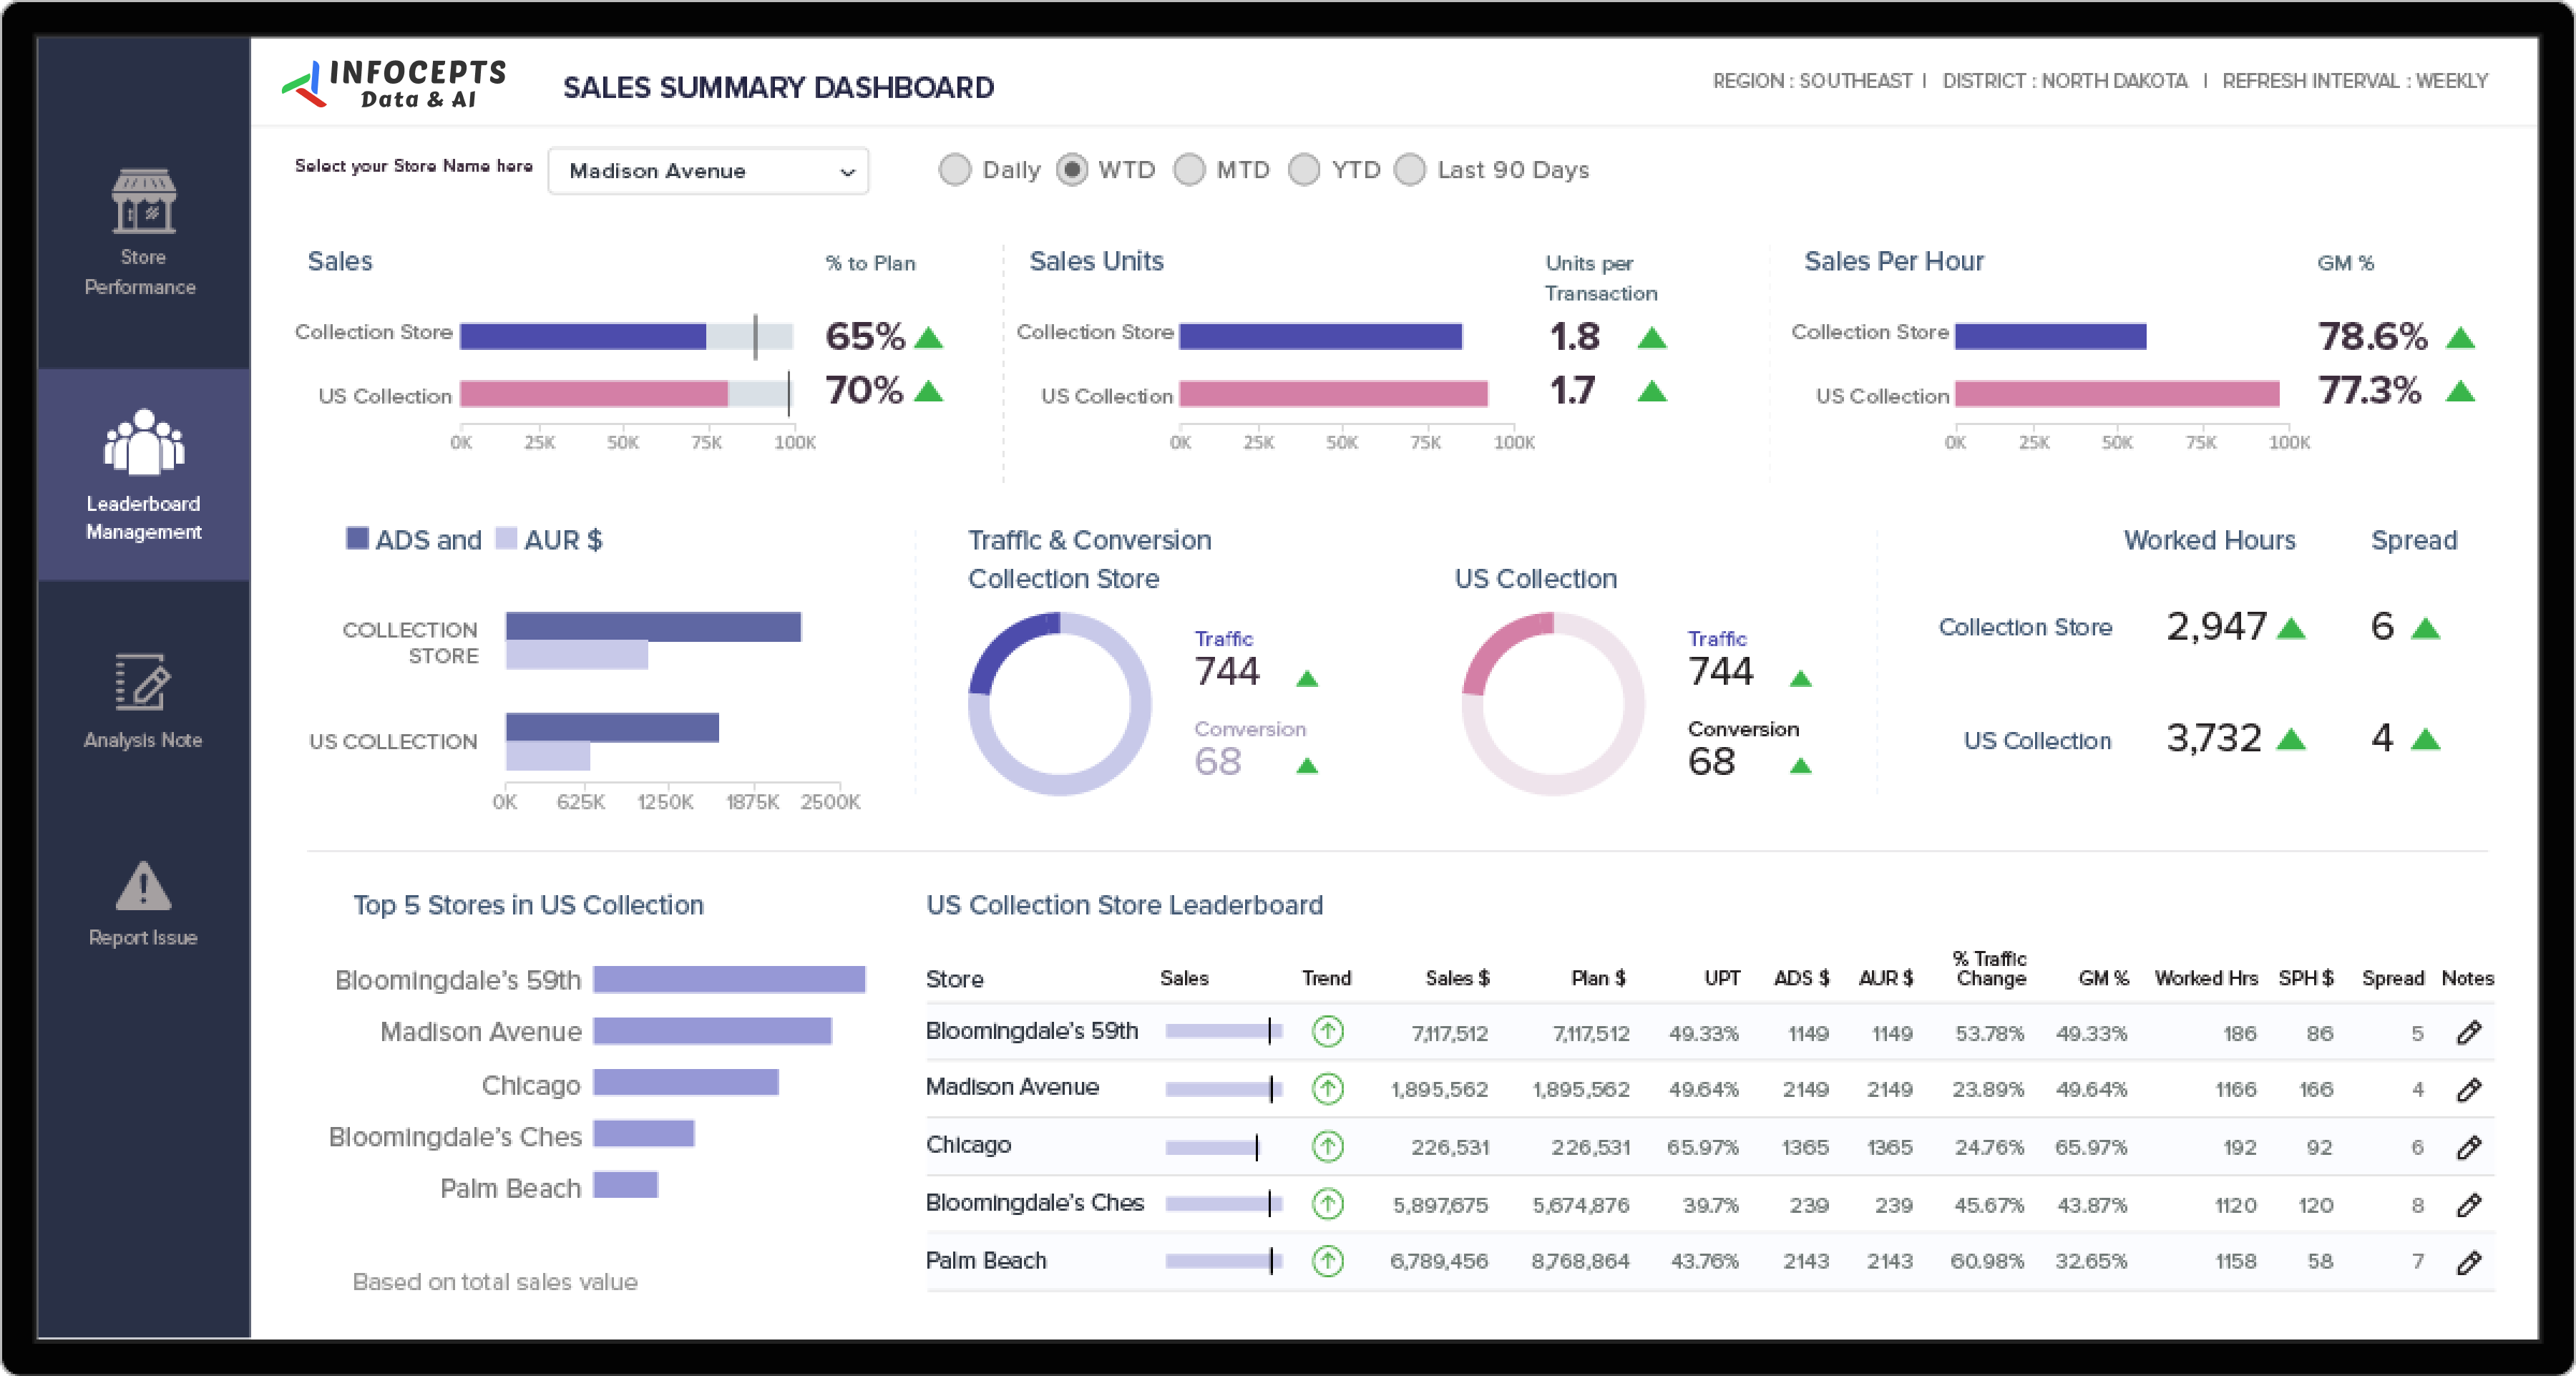
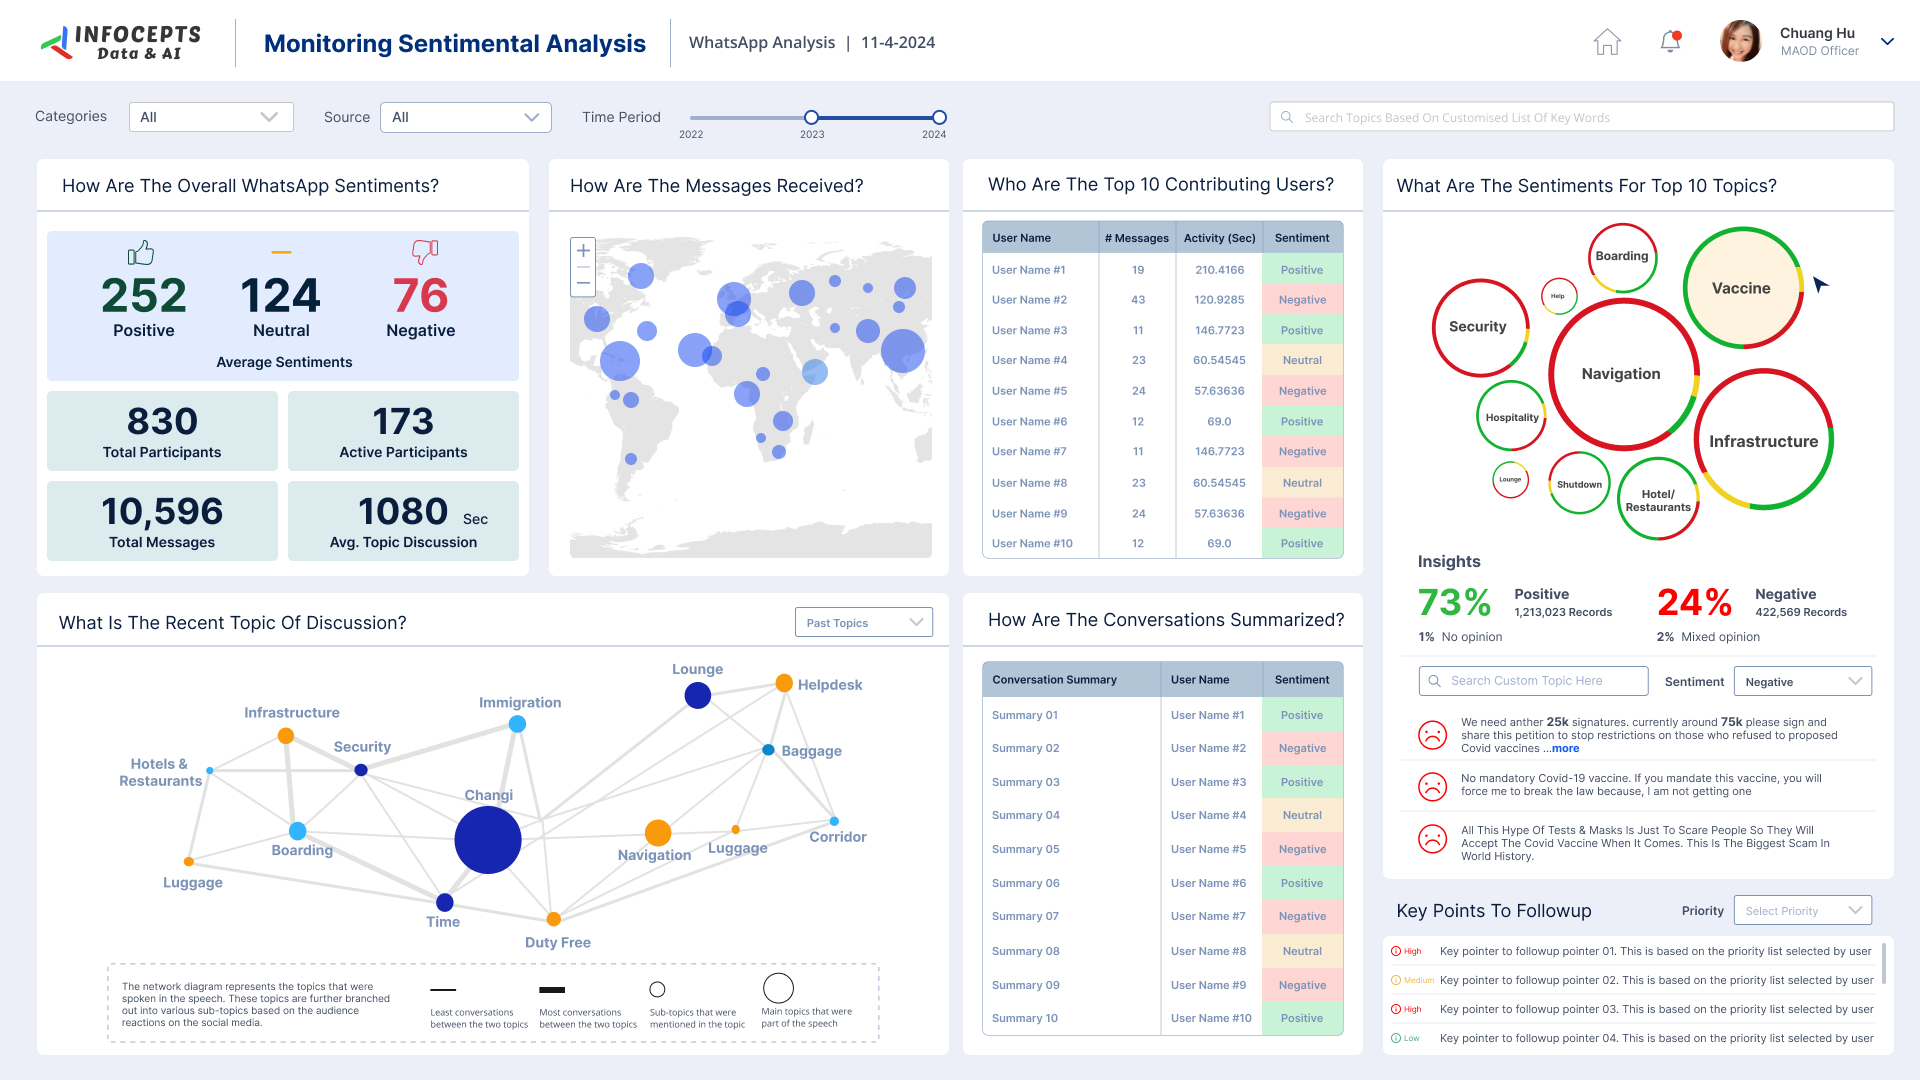
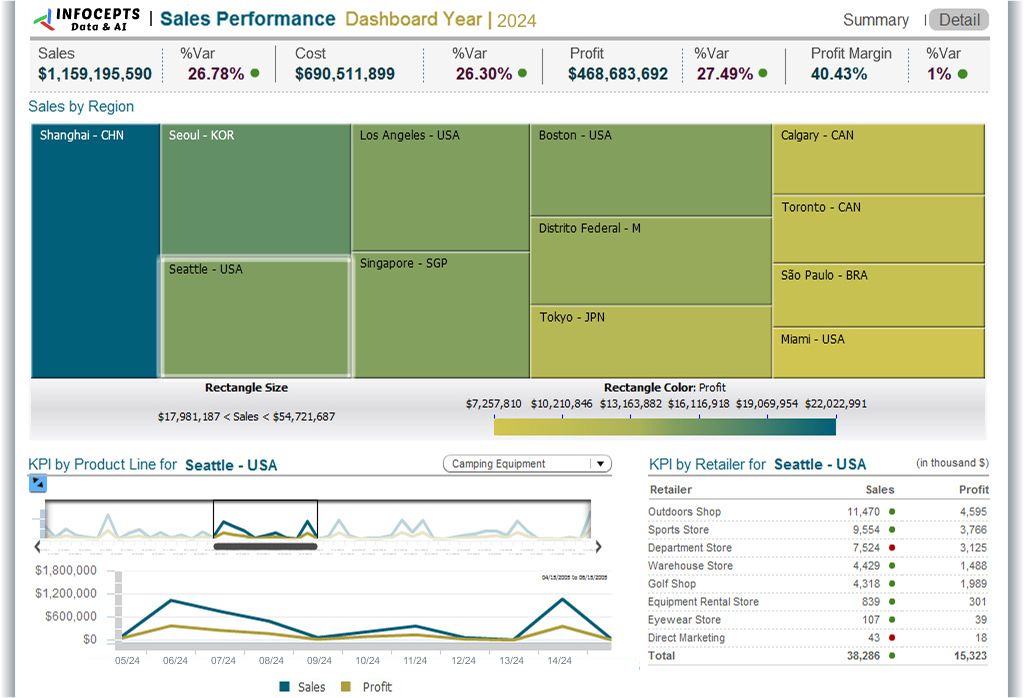
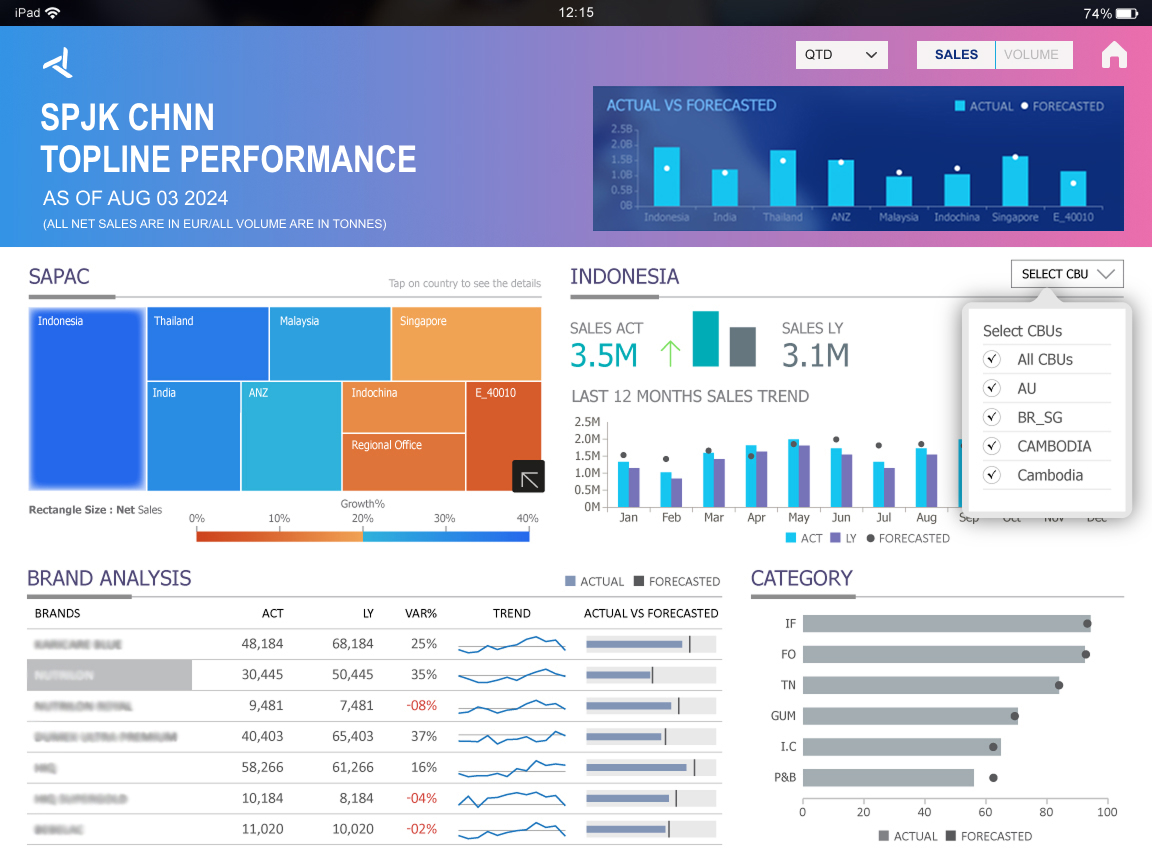
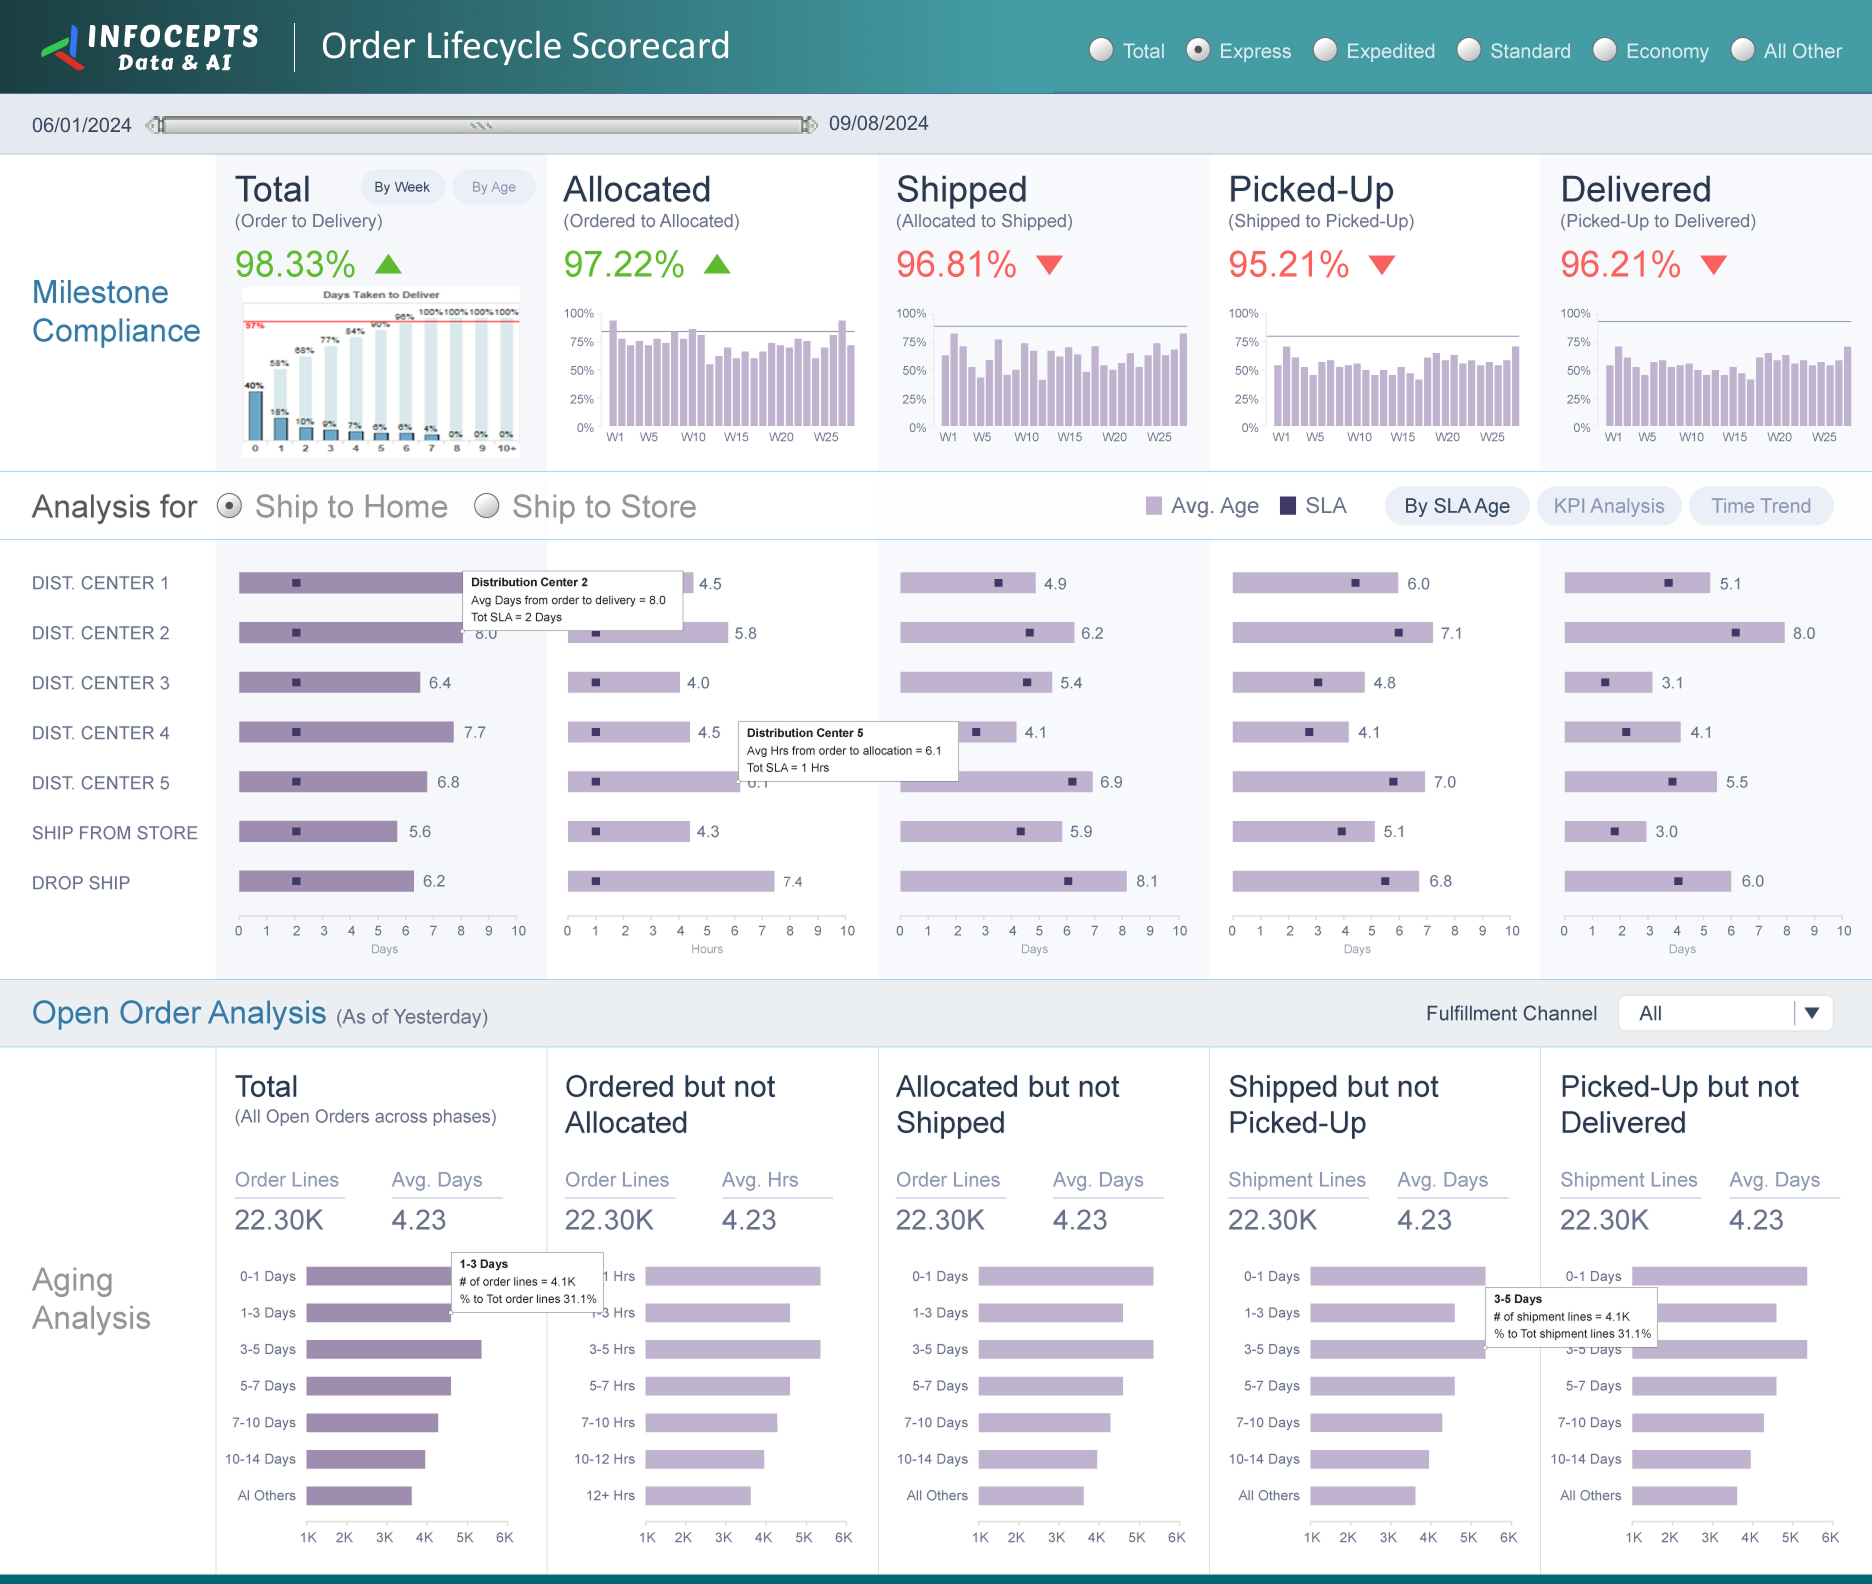
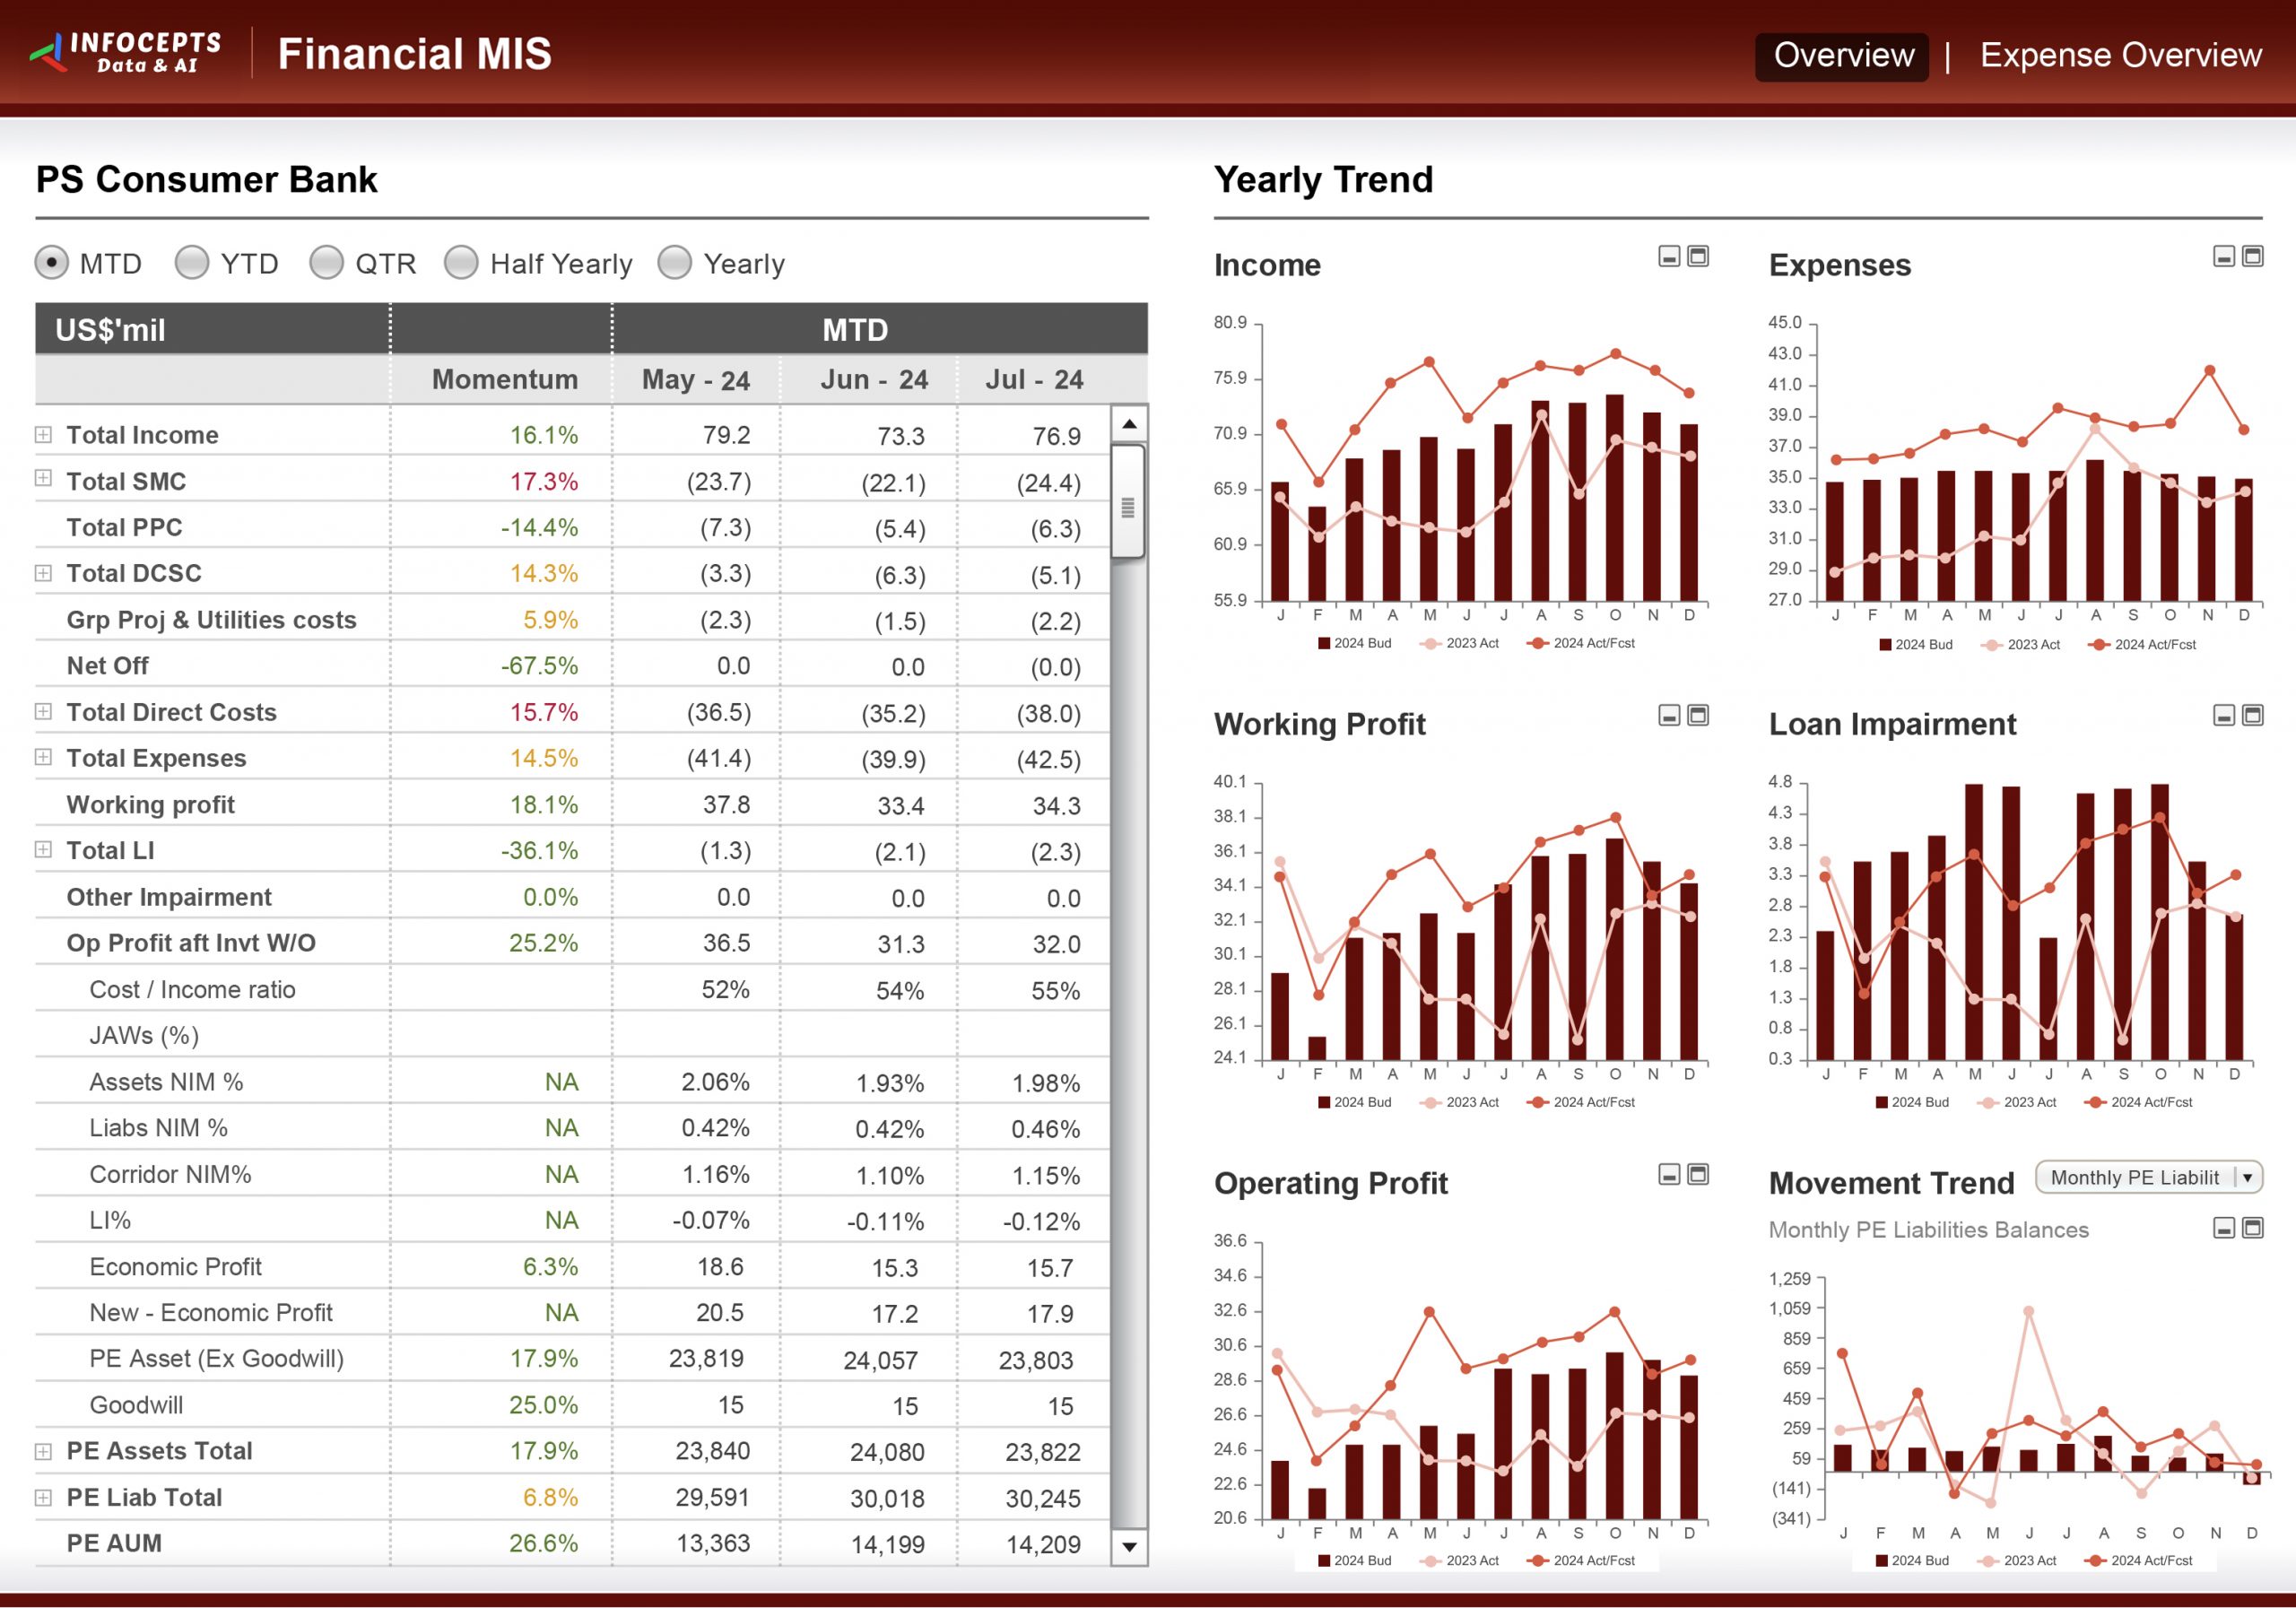
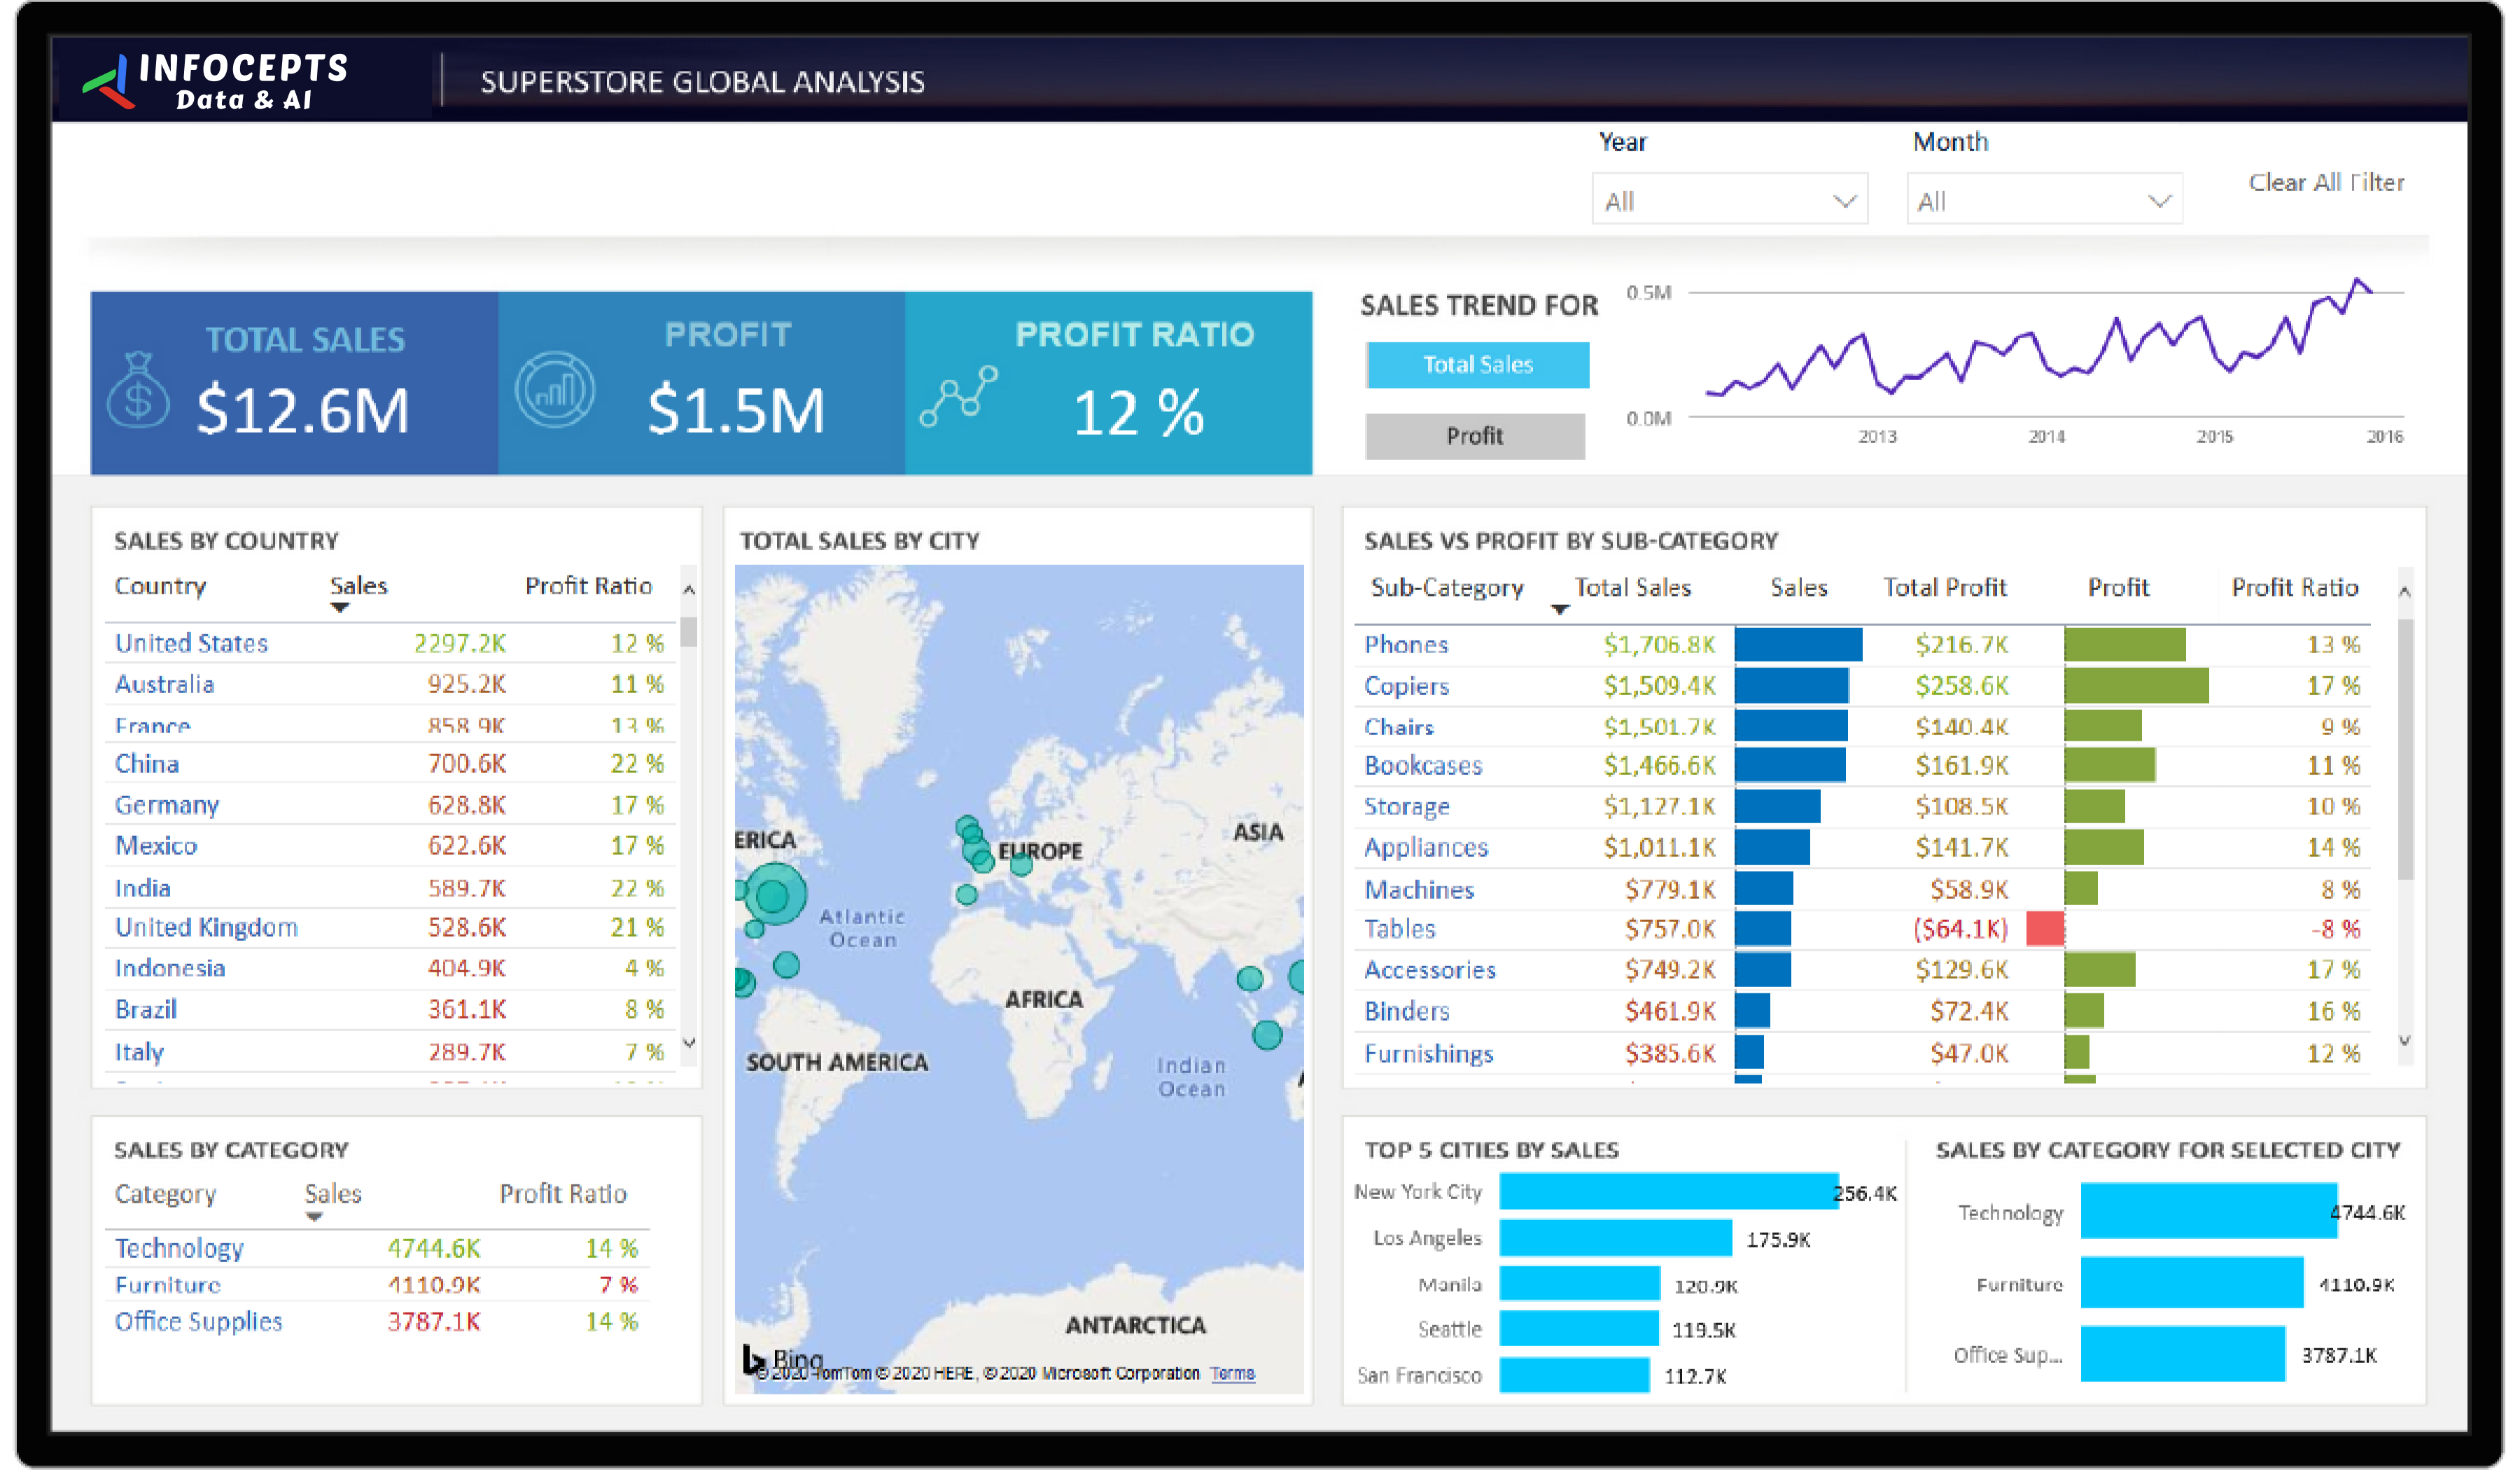
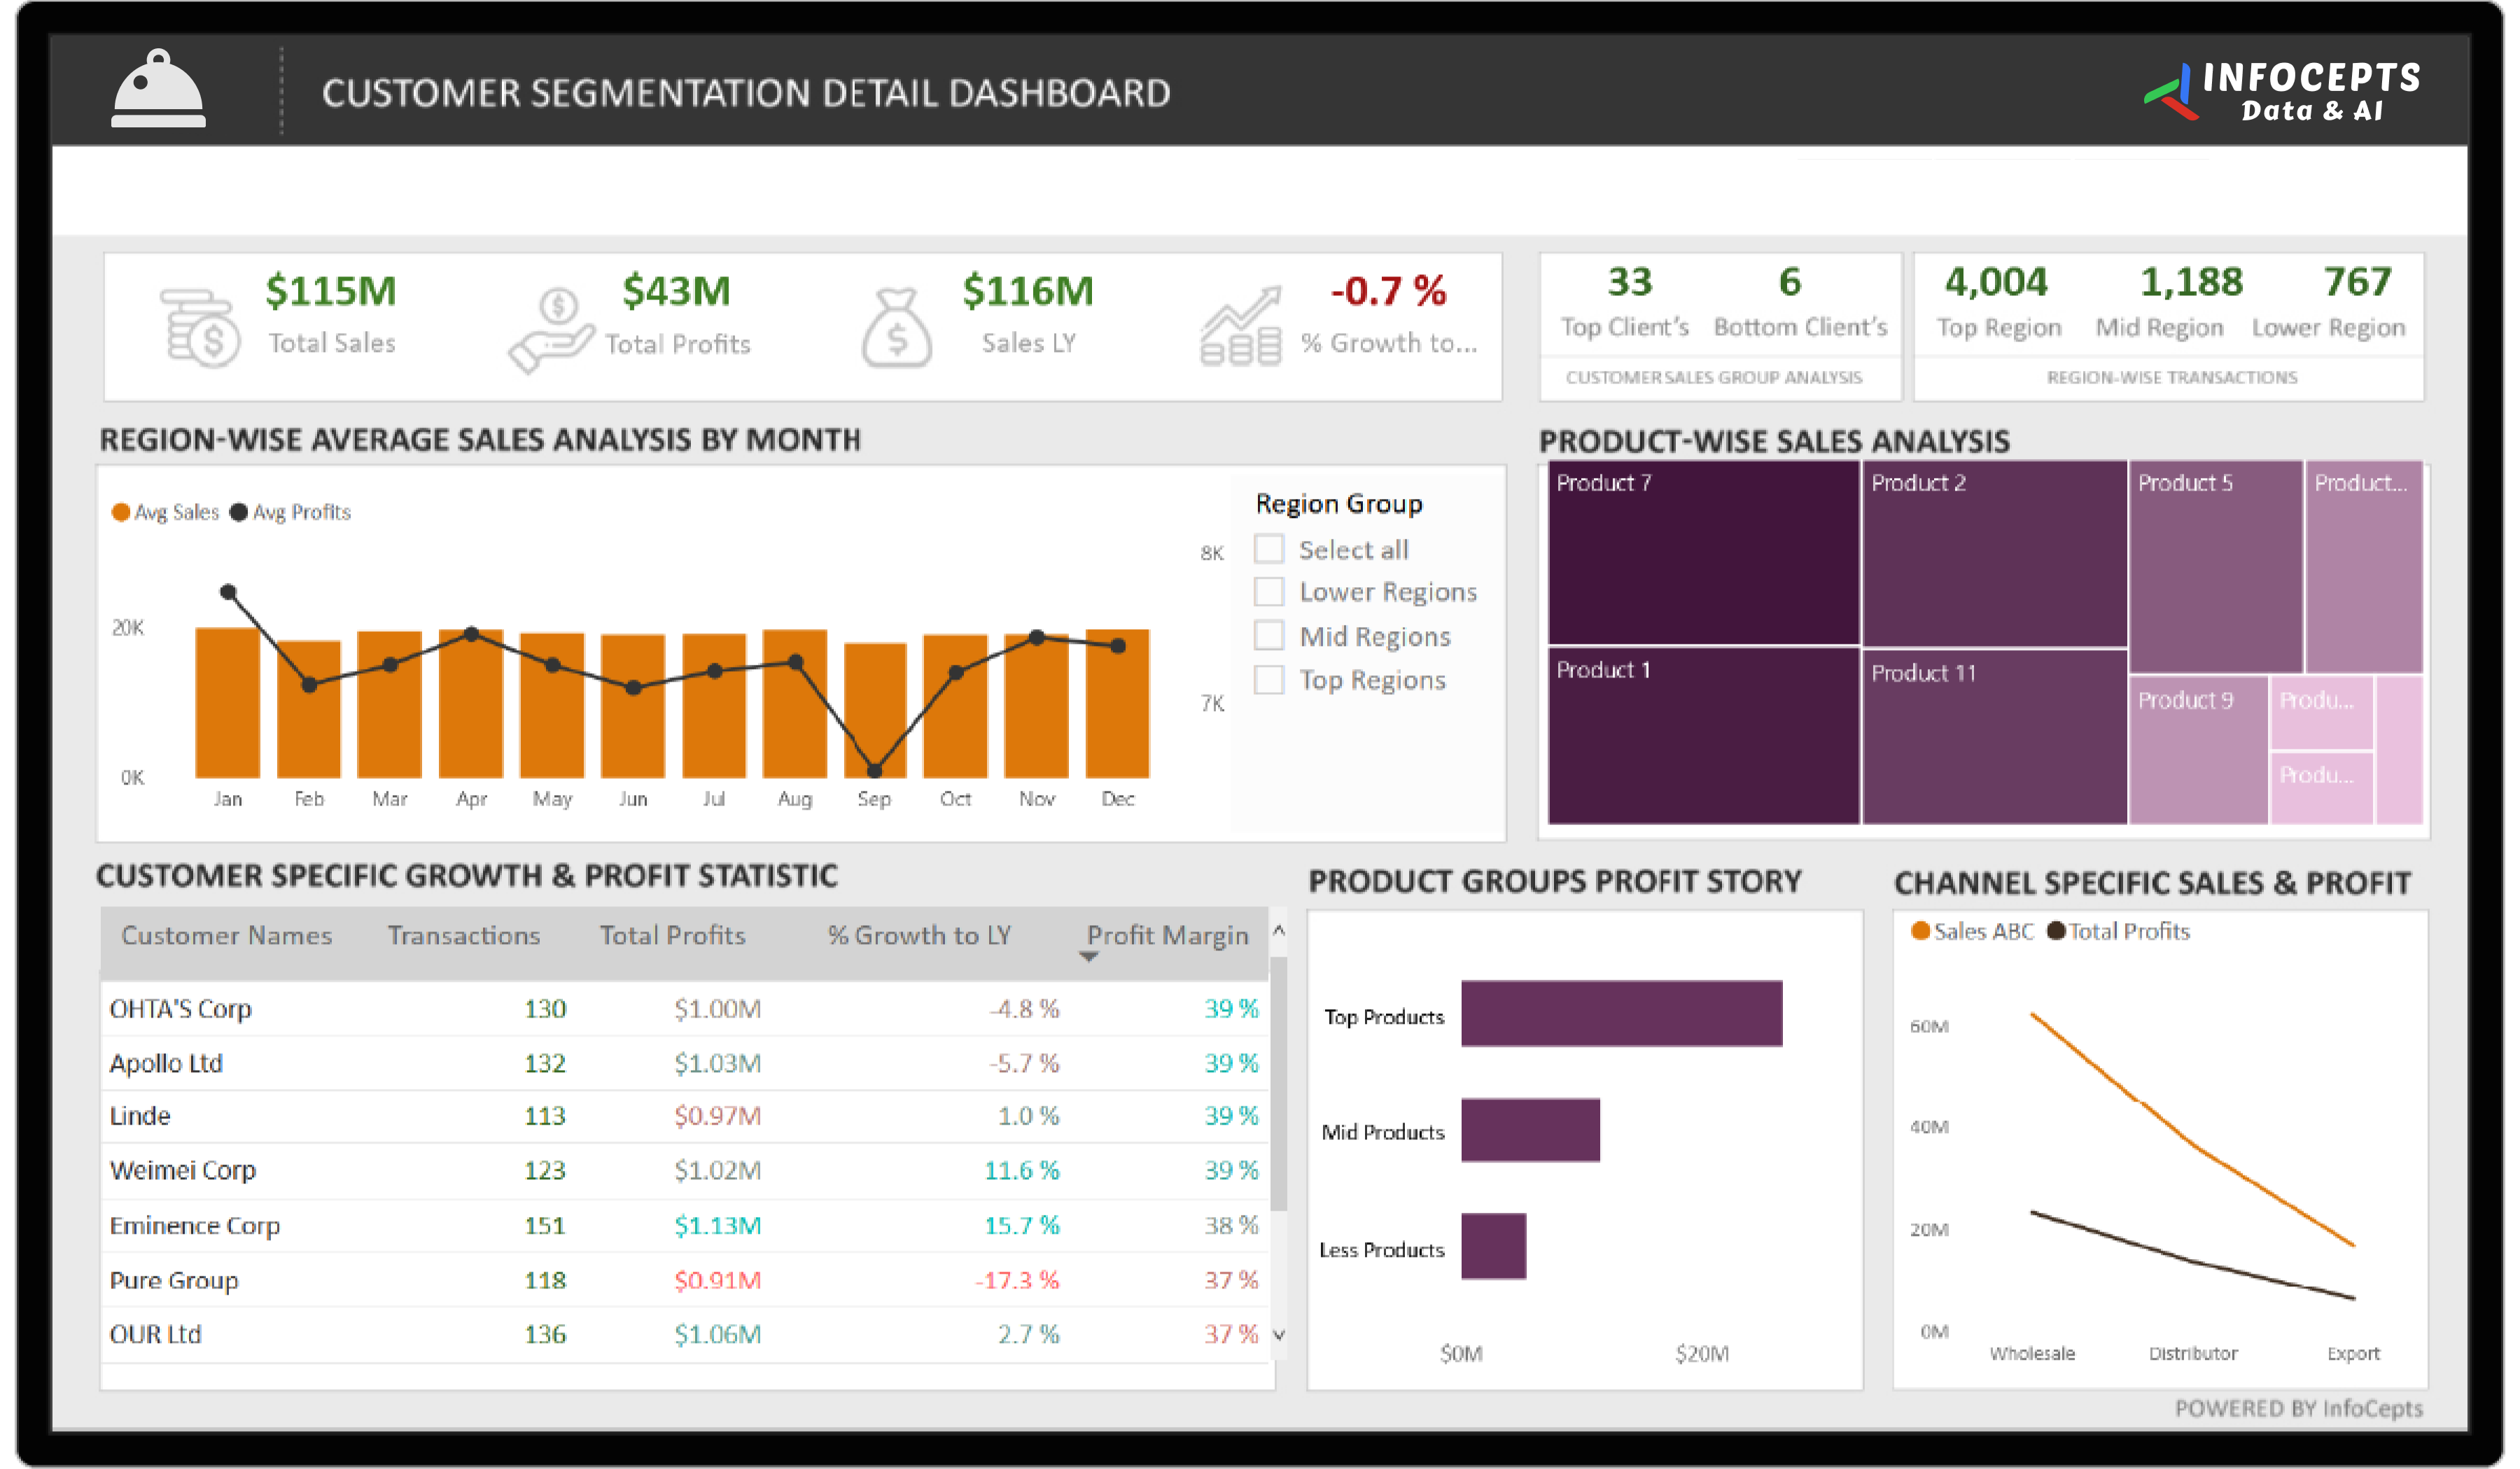
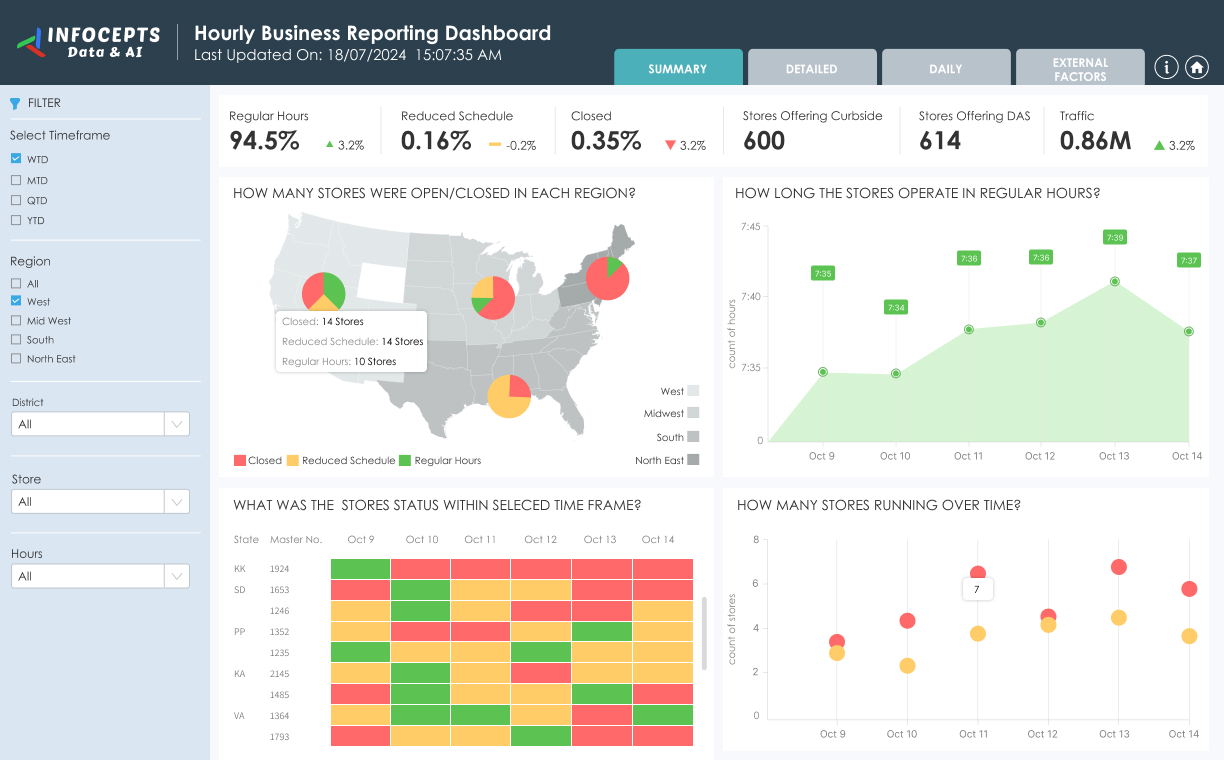
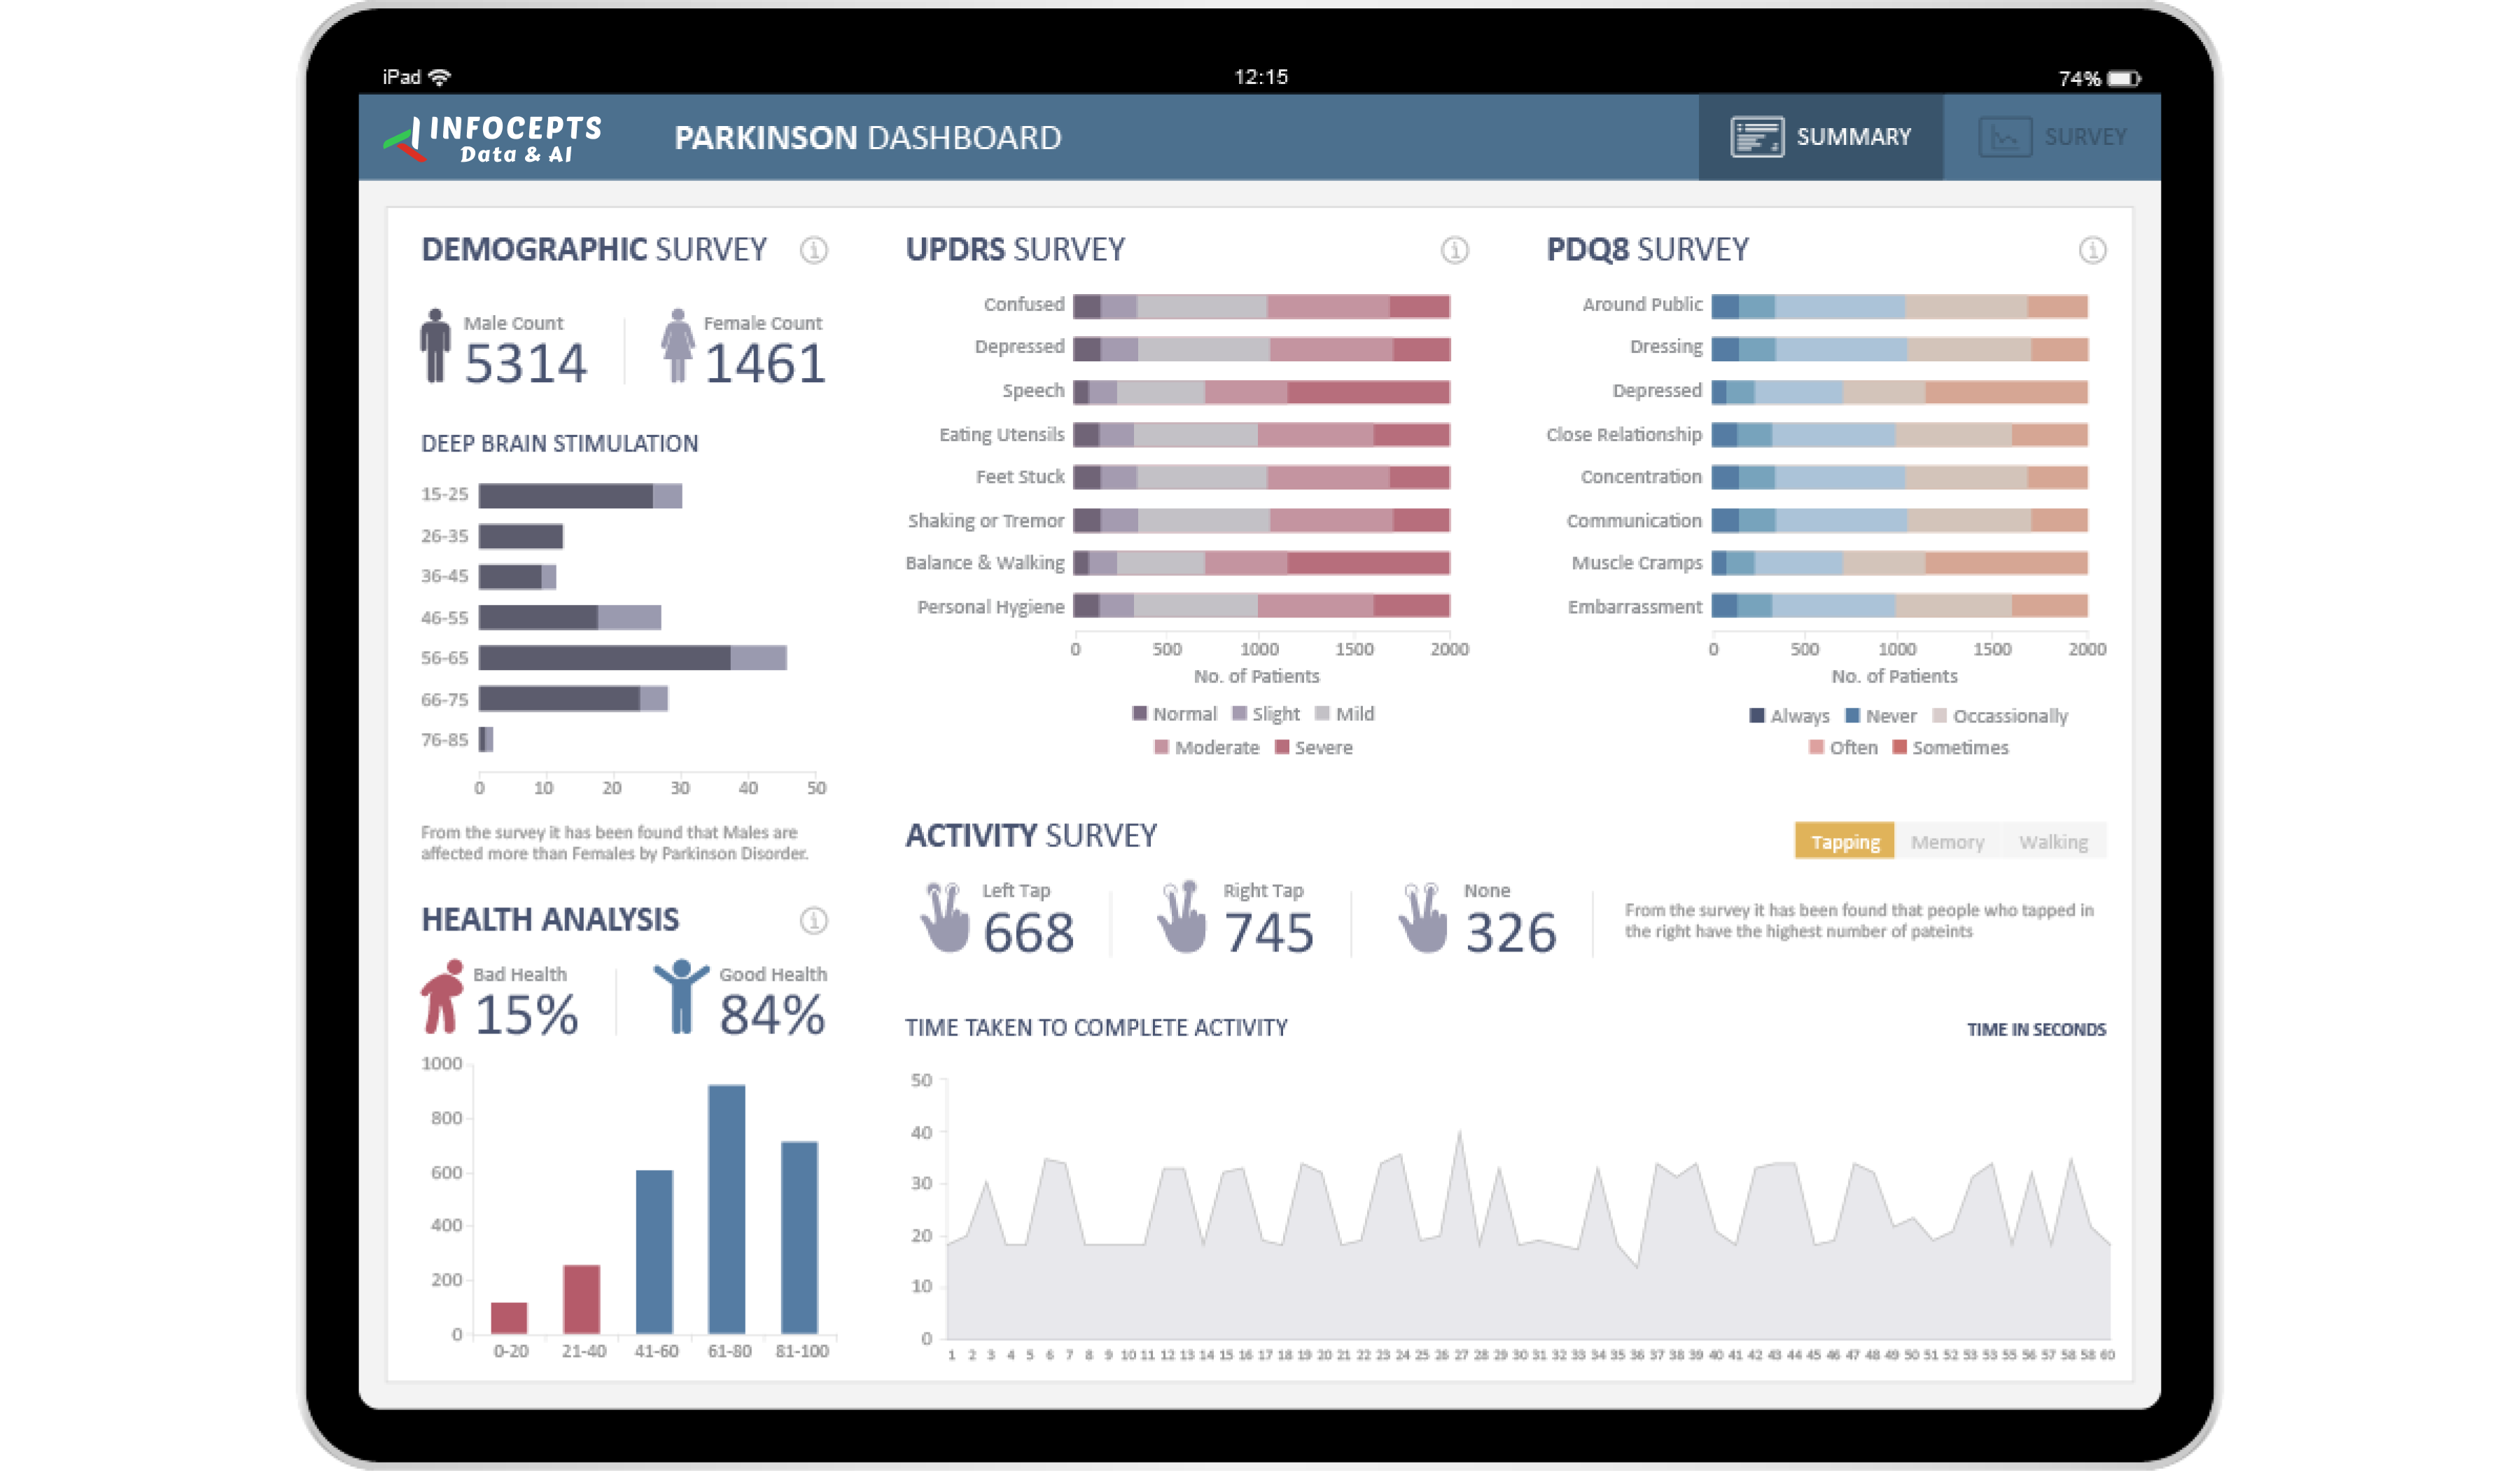
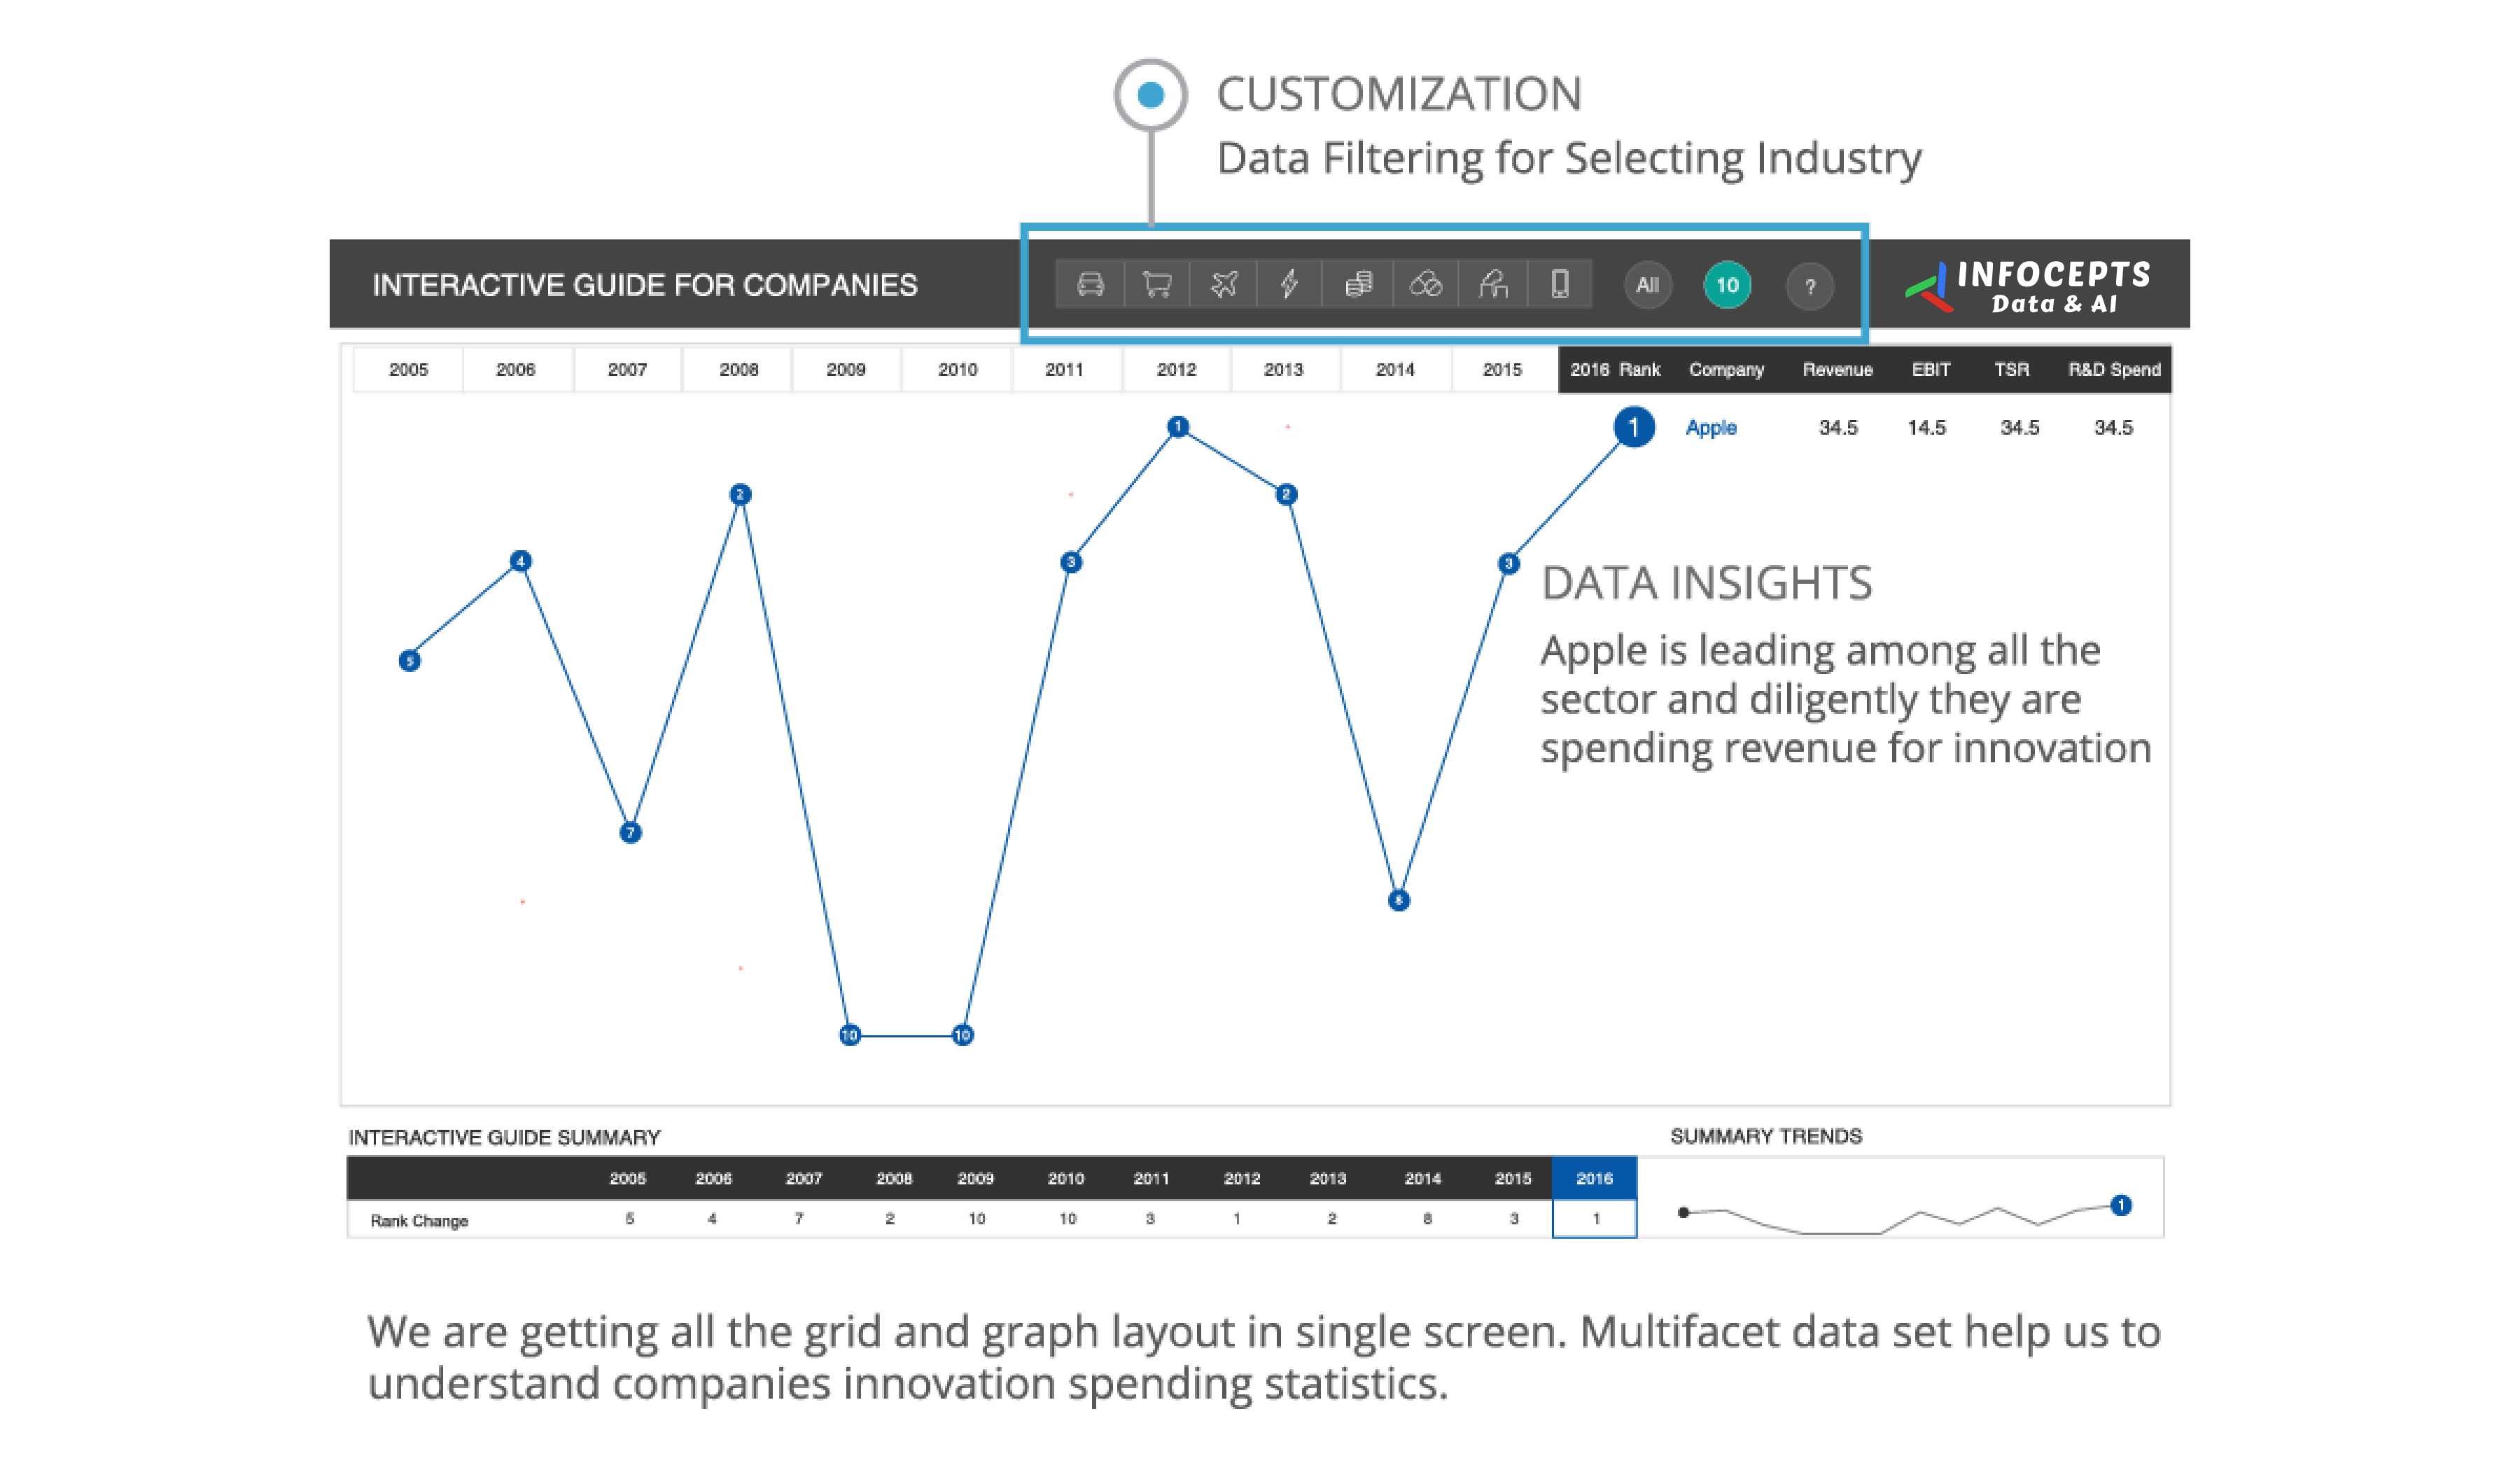
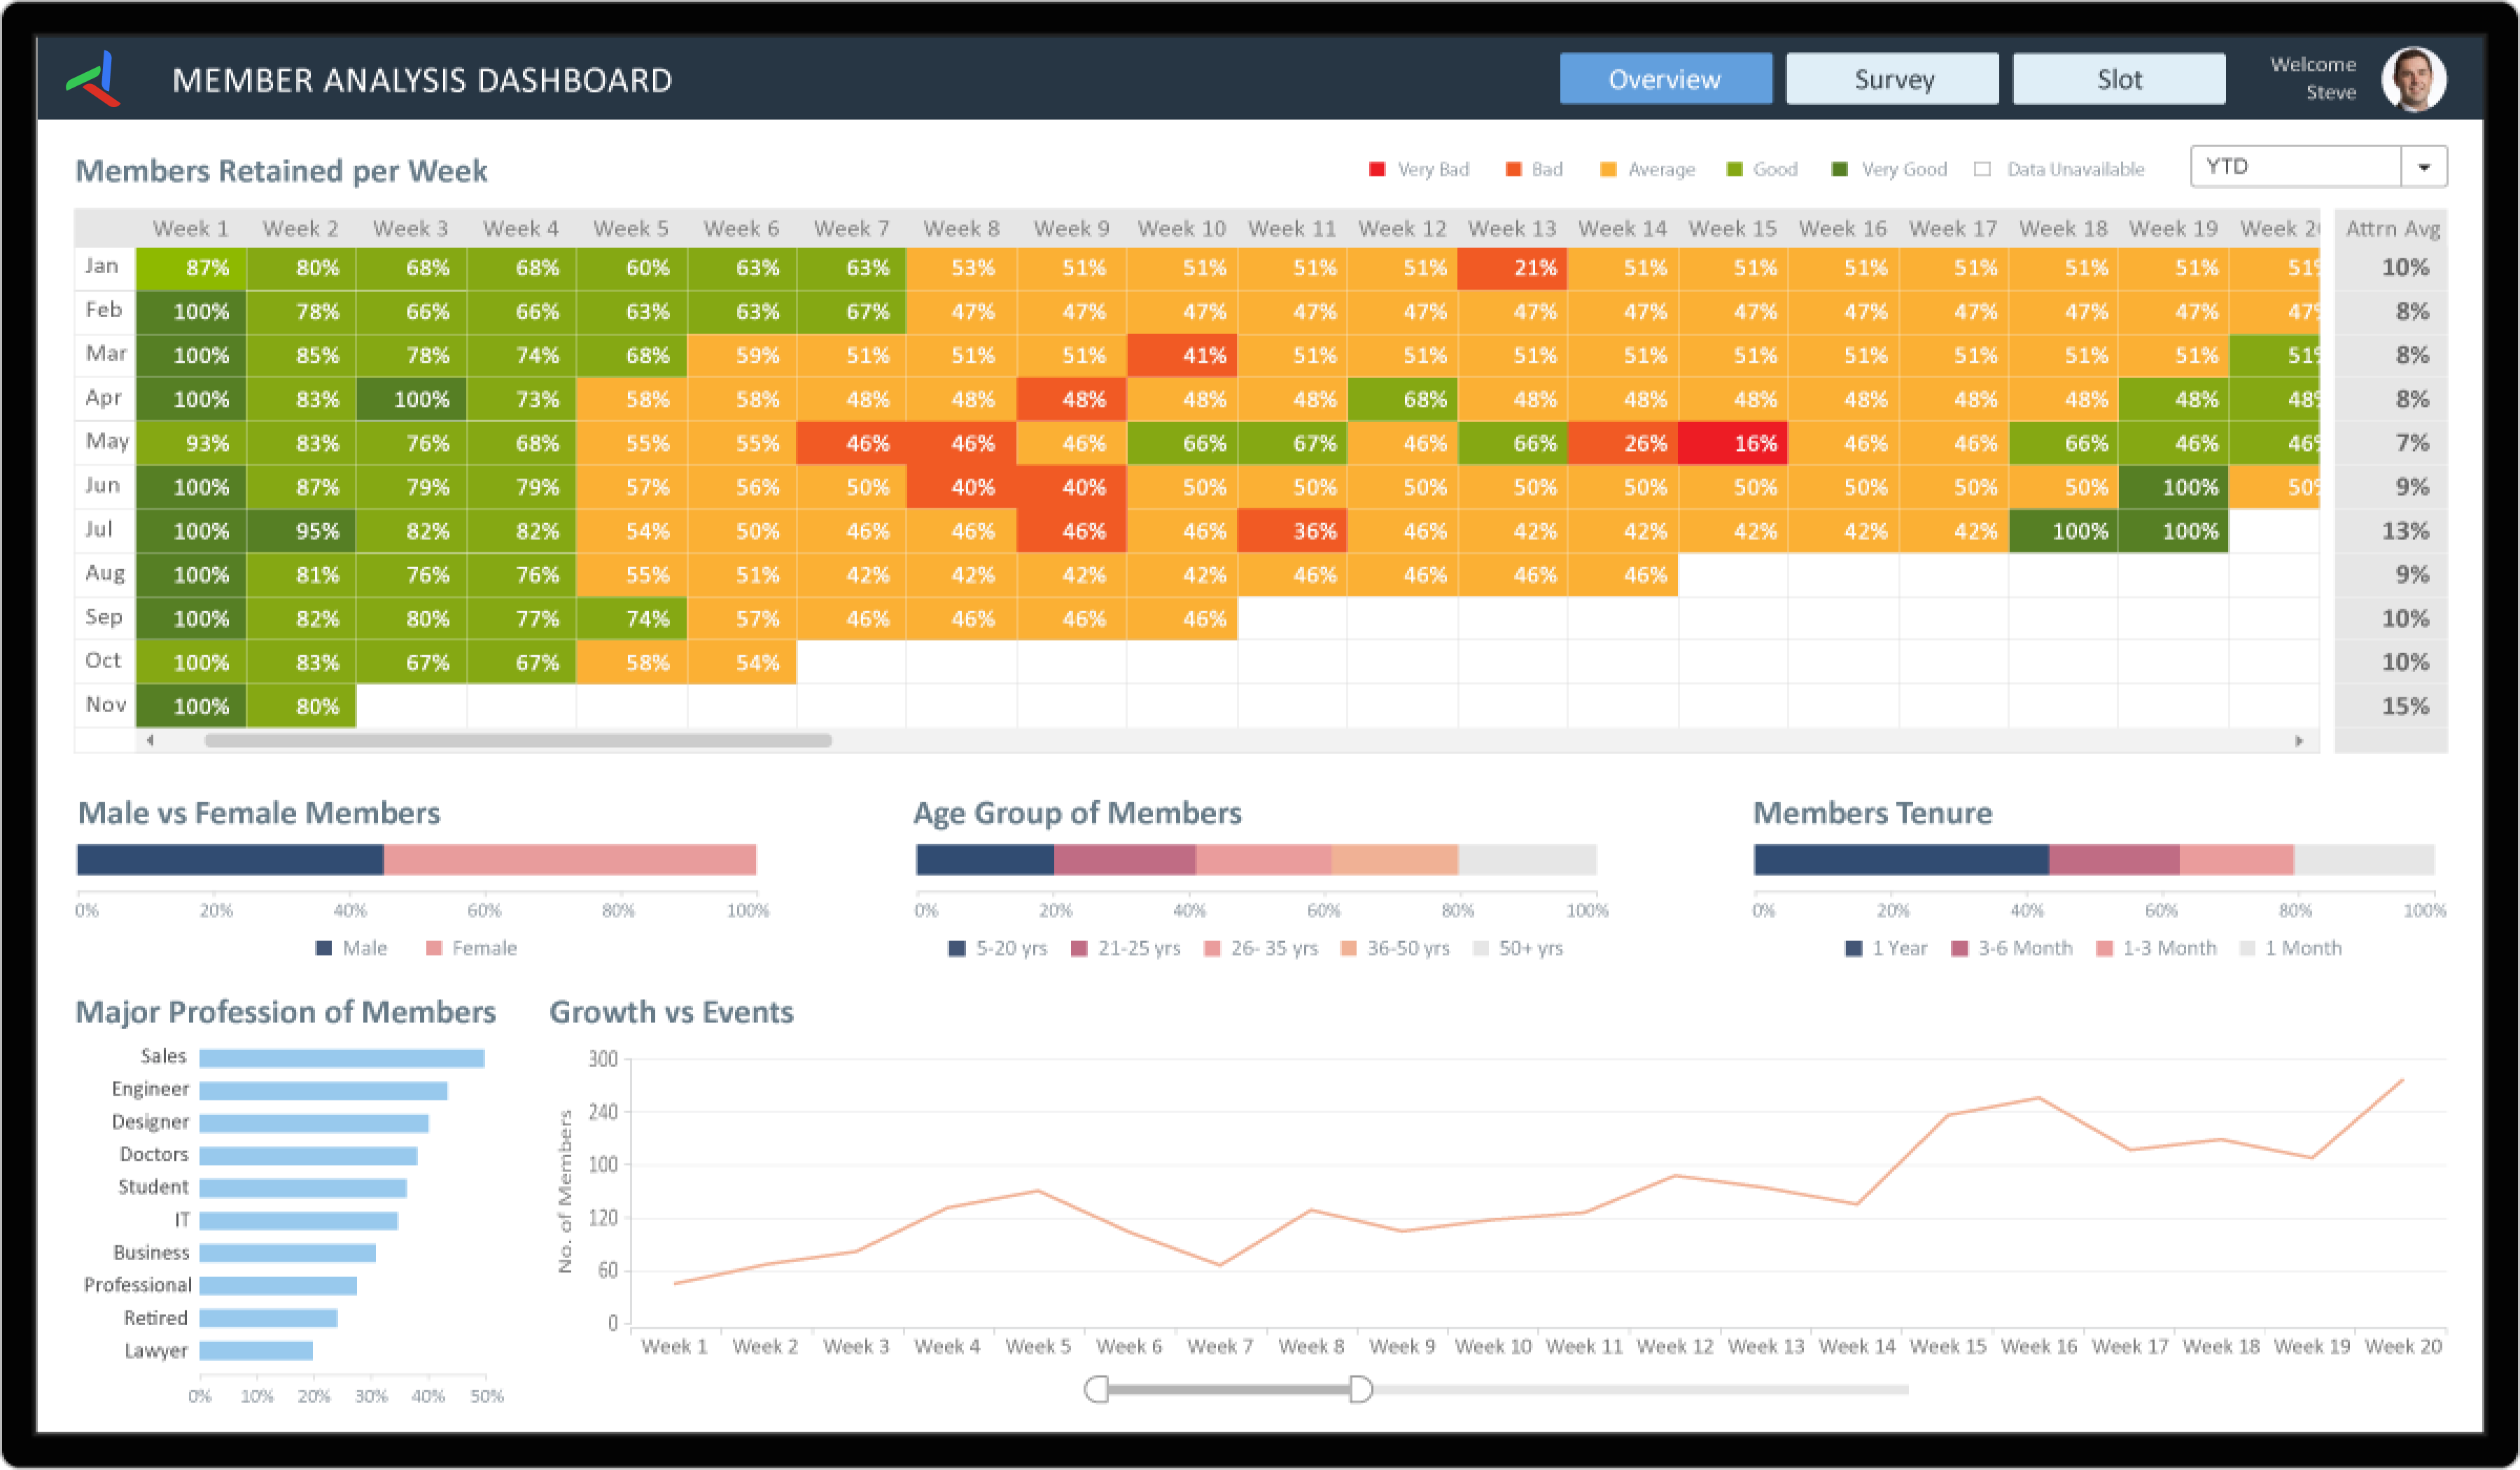
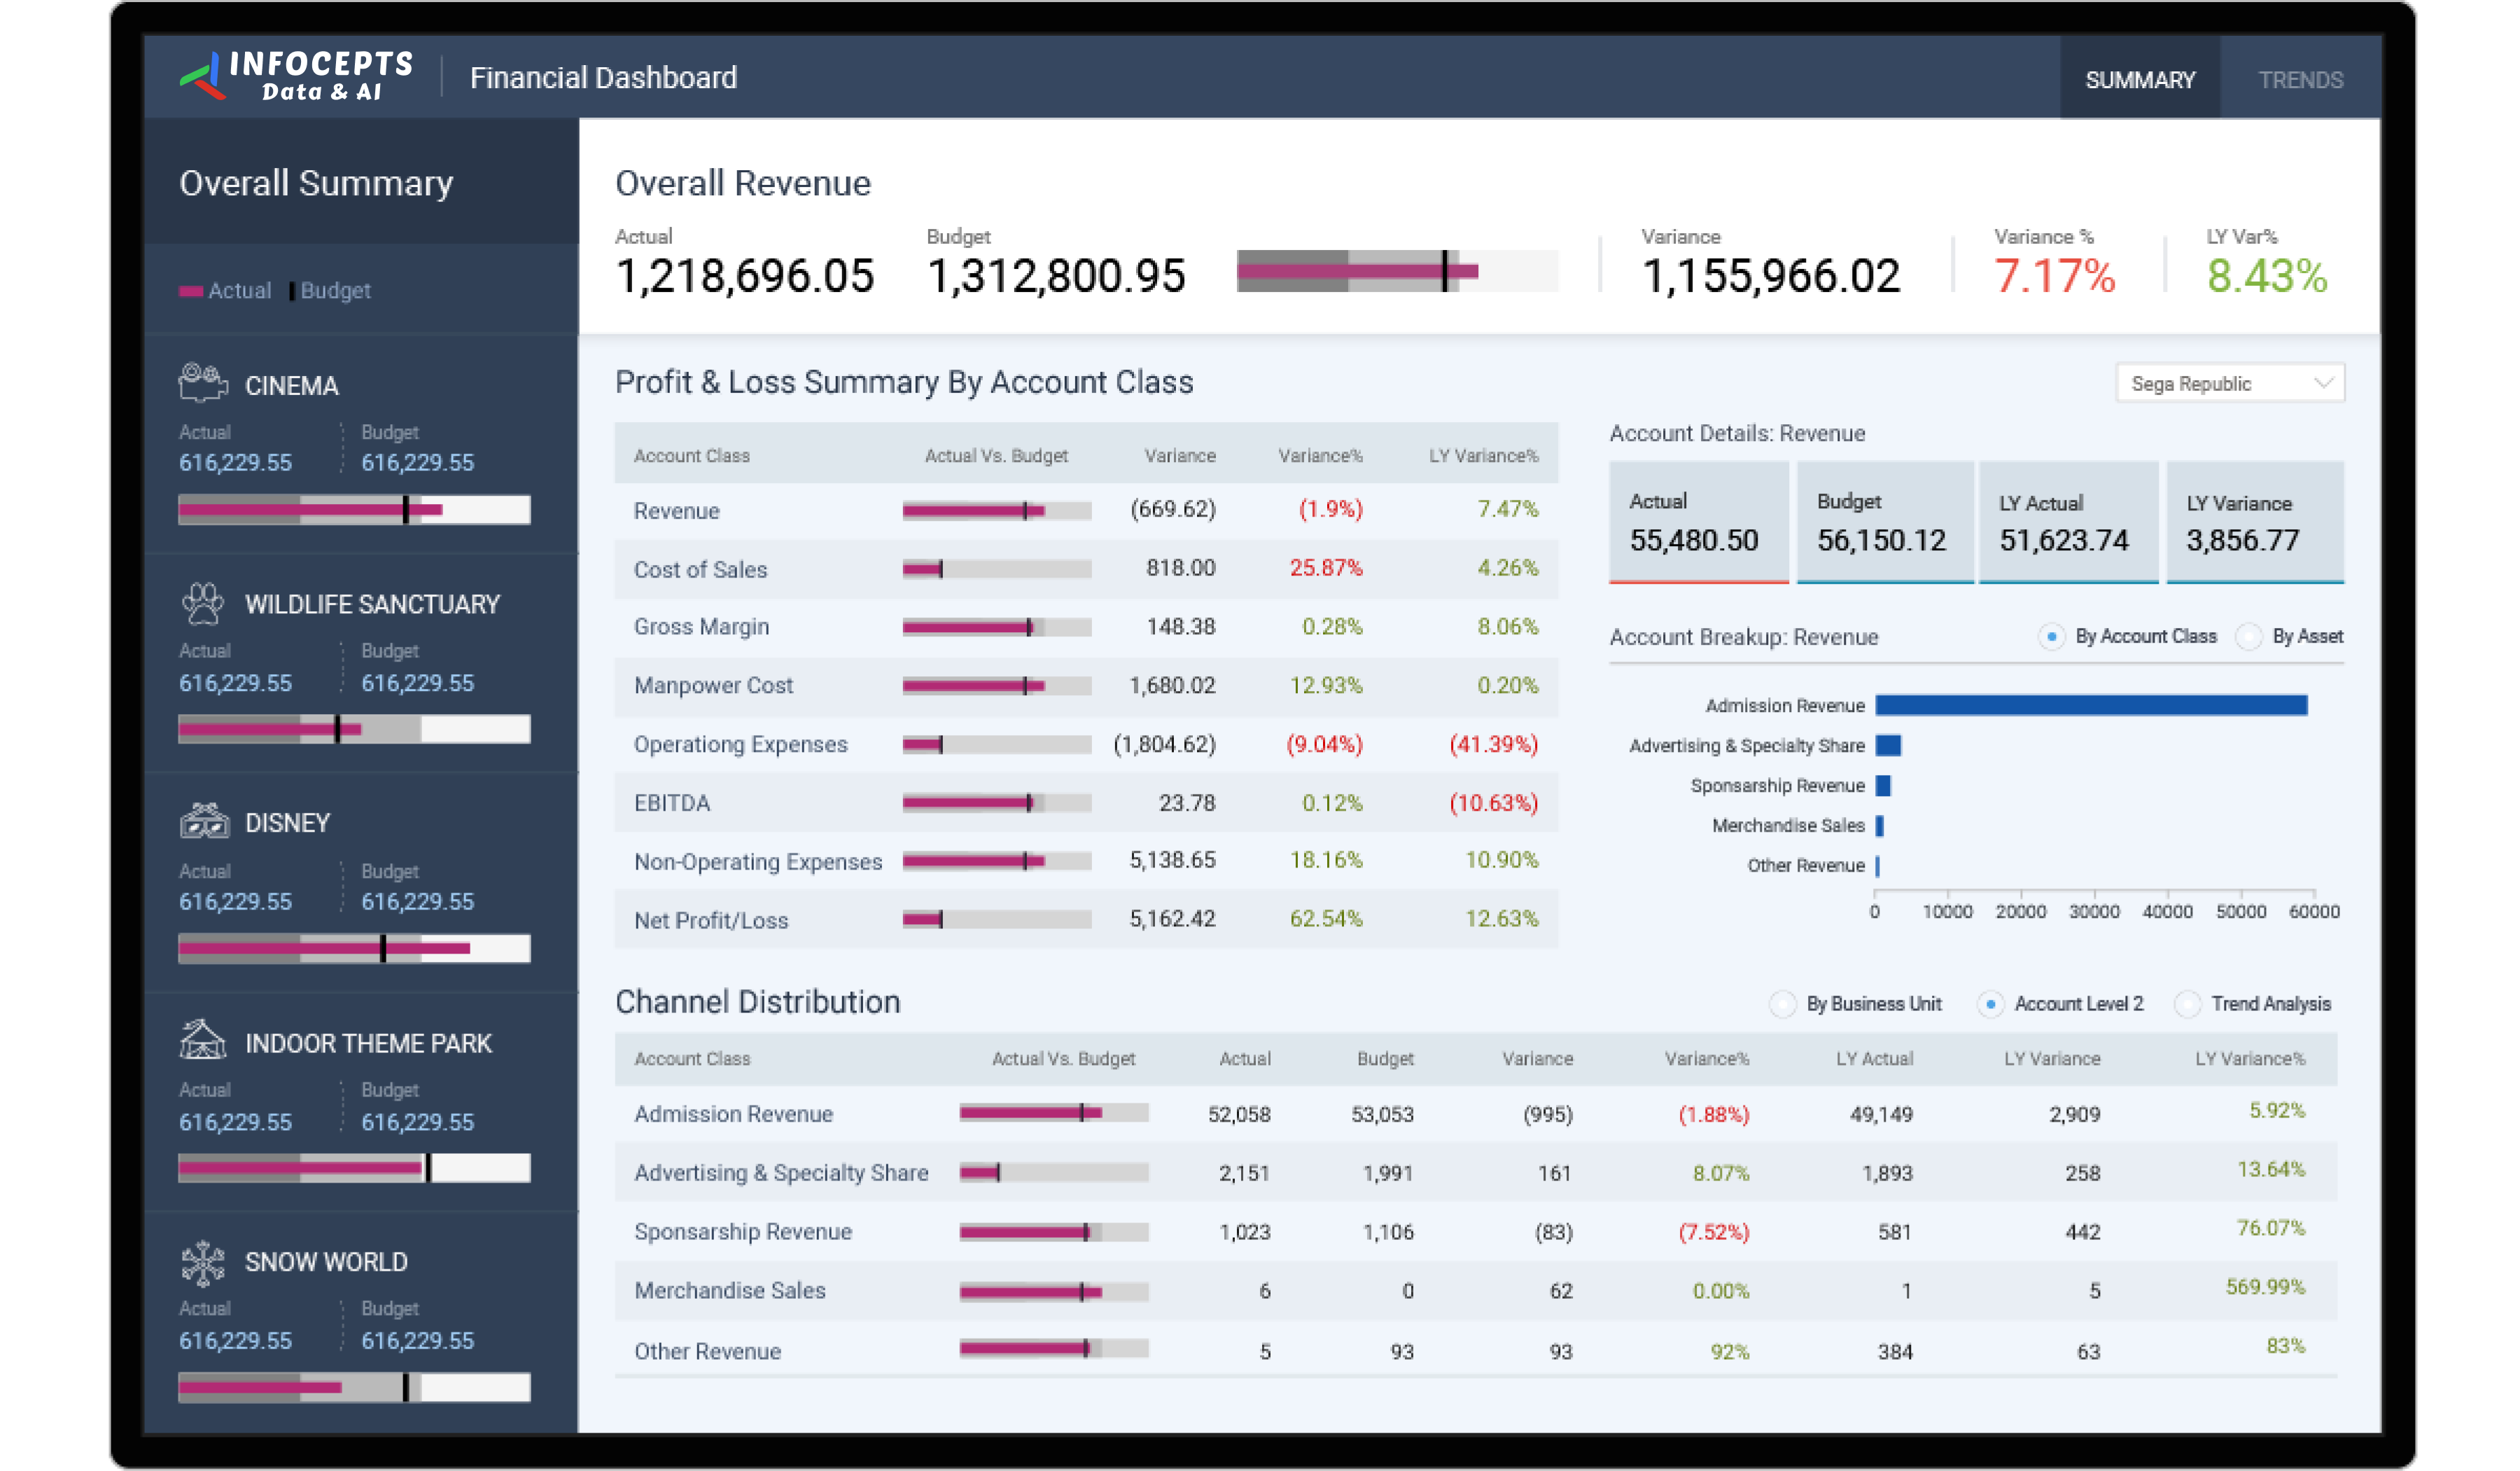
Our Financial Dashboard designed for the entertainment industry enables businesses to gain a comprehensive understanding of key financial metrics, including revenue, cost of sales, gross margin, and operating expenses across different entertainment assets. Aimed at management teams in leading entertainment conglomerates, this dashboard provides both high-level and granular insights by allowing users to drill into business unit and account levels. By offering real-time distribution and trend analysis, it helps management identify financial patterns and make well-informed, strategic decisions. This solution empowers businesses to improve operational efficiency while reducing maintenance and cost efforts.
Frequently asked questions
Revenue, cost of sales, gross margin, and operating expenses across different entertainment assets, viewable at both a high level and drilled into business unit or account detail.
Management teams at entertainment conglomerates responsible for financial performance across multiple assets or business units.
A company-wide financial number can hide which specific asset or unit is actually driving a margin problem; drill-down makes that visible instead of averaging it away.
Current trend visibility lets management catch a financial pattern developing, instead of waiting for a monthly or quarterly close to confirm it.
Consolidating financial reporting into one platform cuts the manual effort of reconciling numbers across separate asset-level systems.
By connecting financial systems into a BI platform through Business Analytics services, drawing on Media & Entertainment industry work.

 Pranali Lanjewar