



90%
Accuracy Achieved in Detecting Message Sentiment
2X
Efficiency in Tracking User Engagement
60%
Reduction in Manual Effort for Conversation Summarization
80%
Precision in Identifying Top Contributors by Frequency and Impact
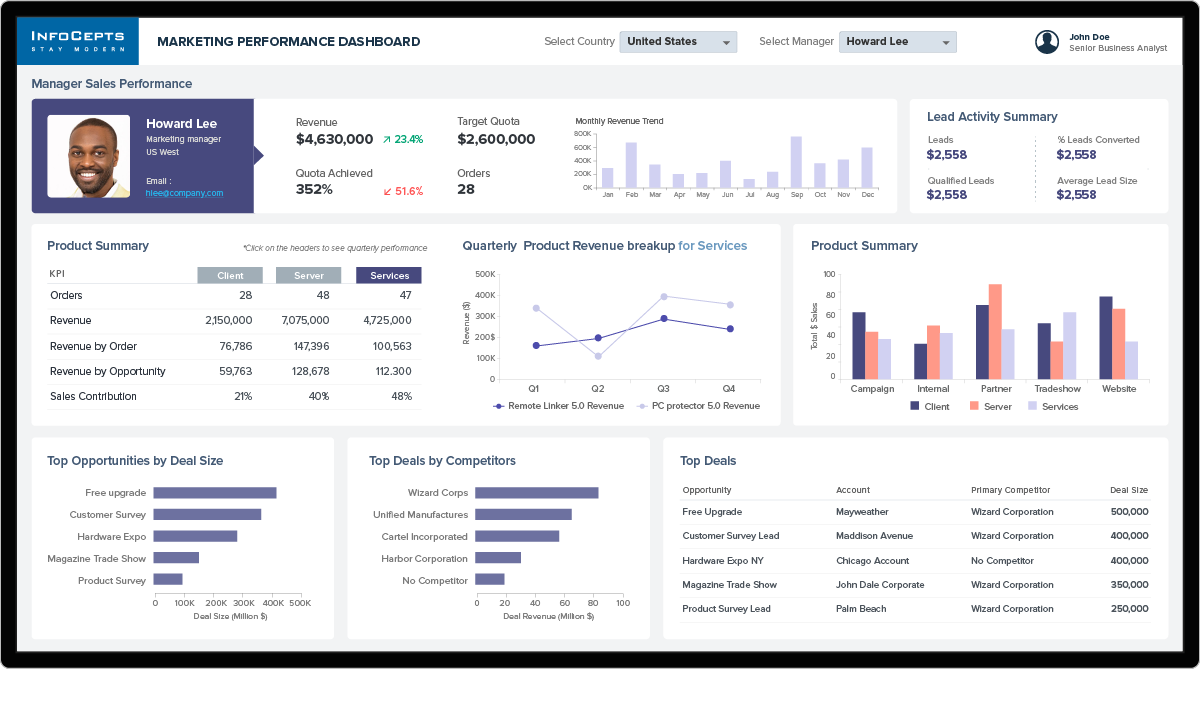
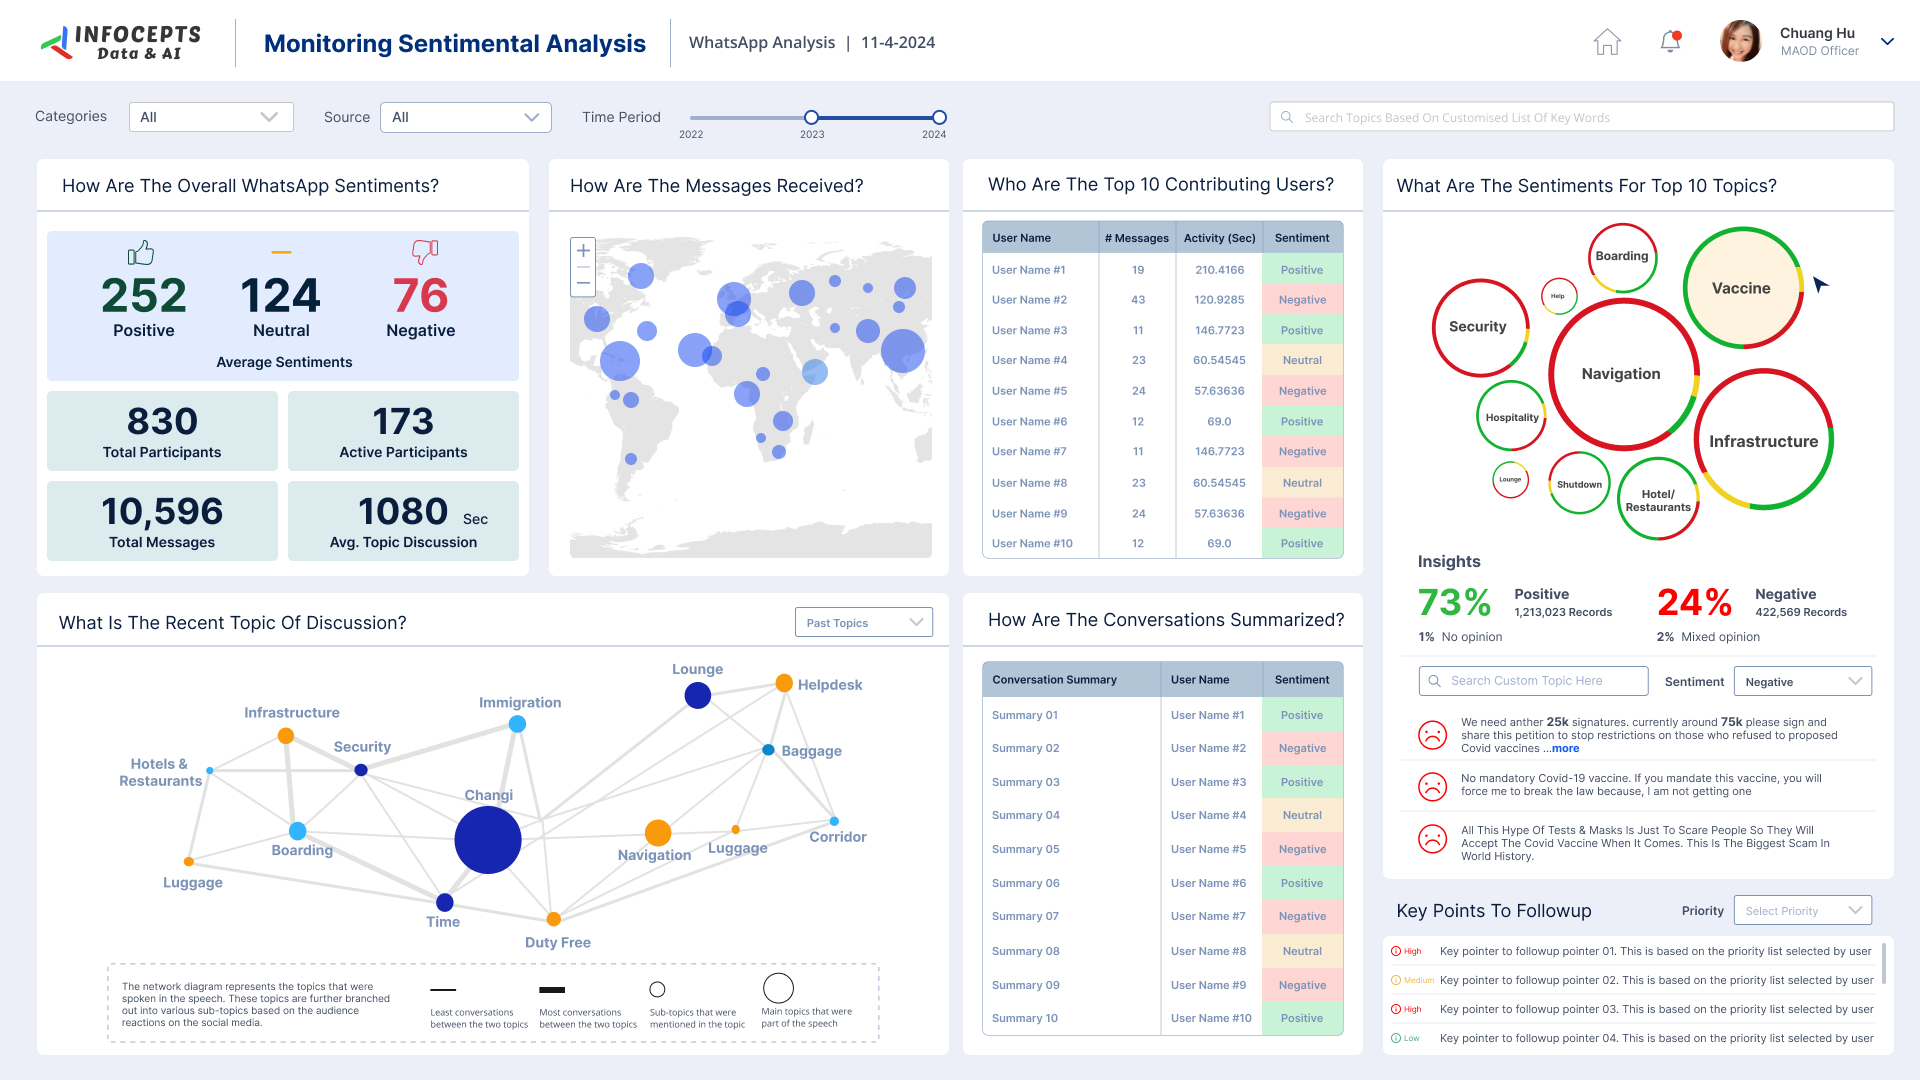
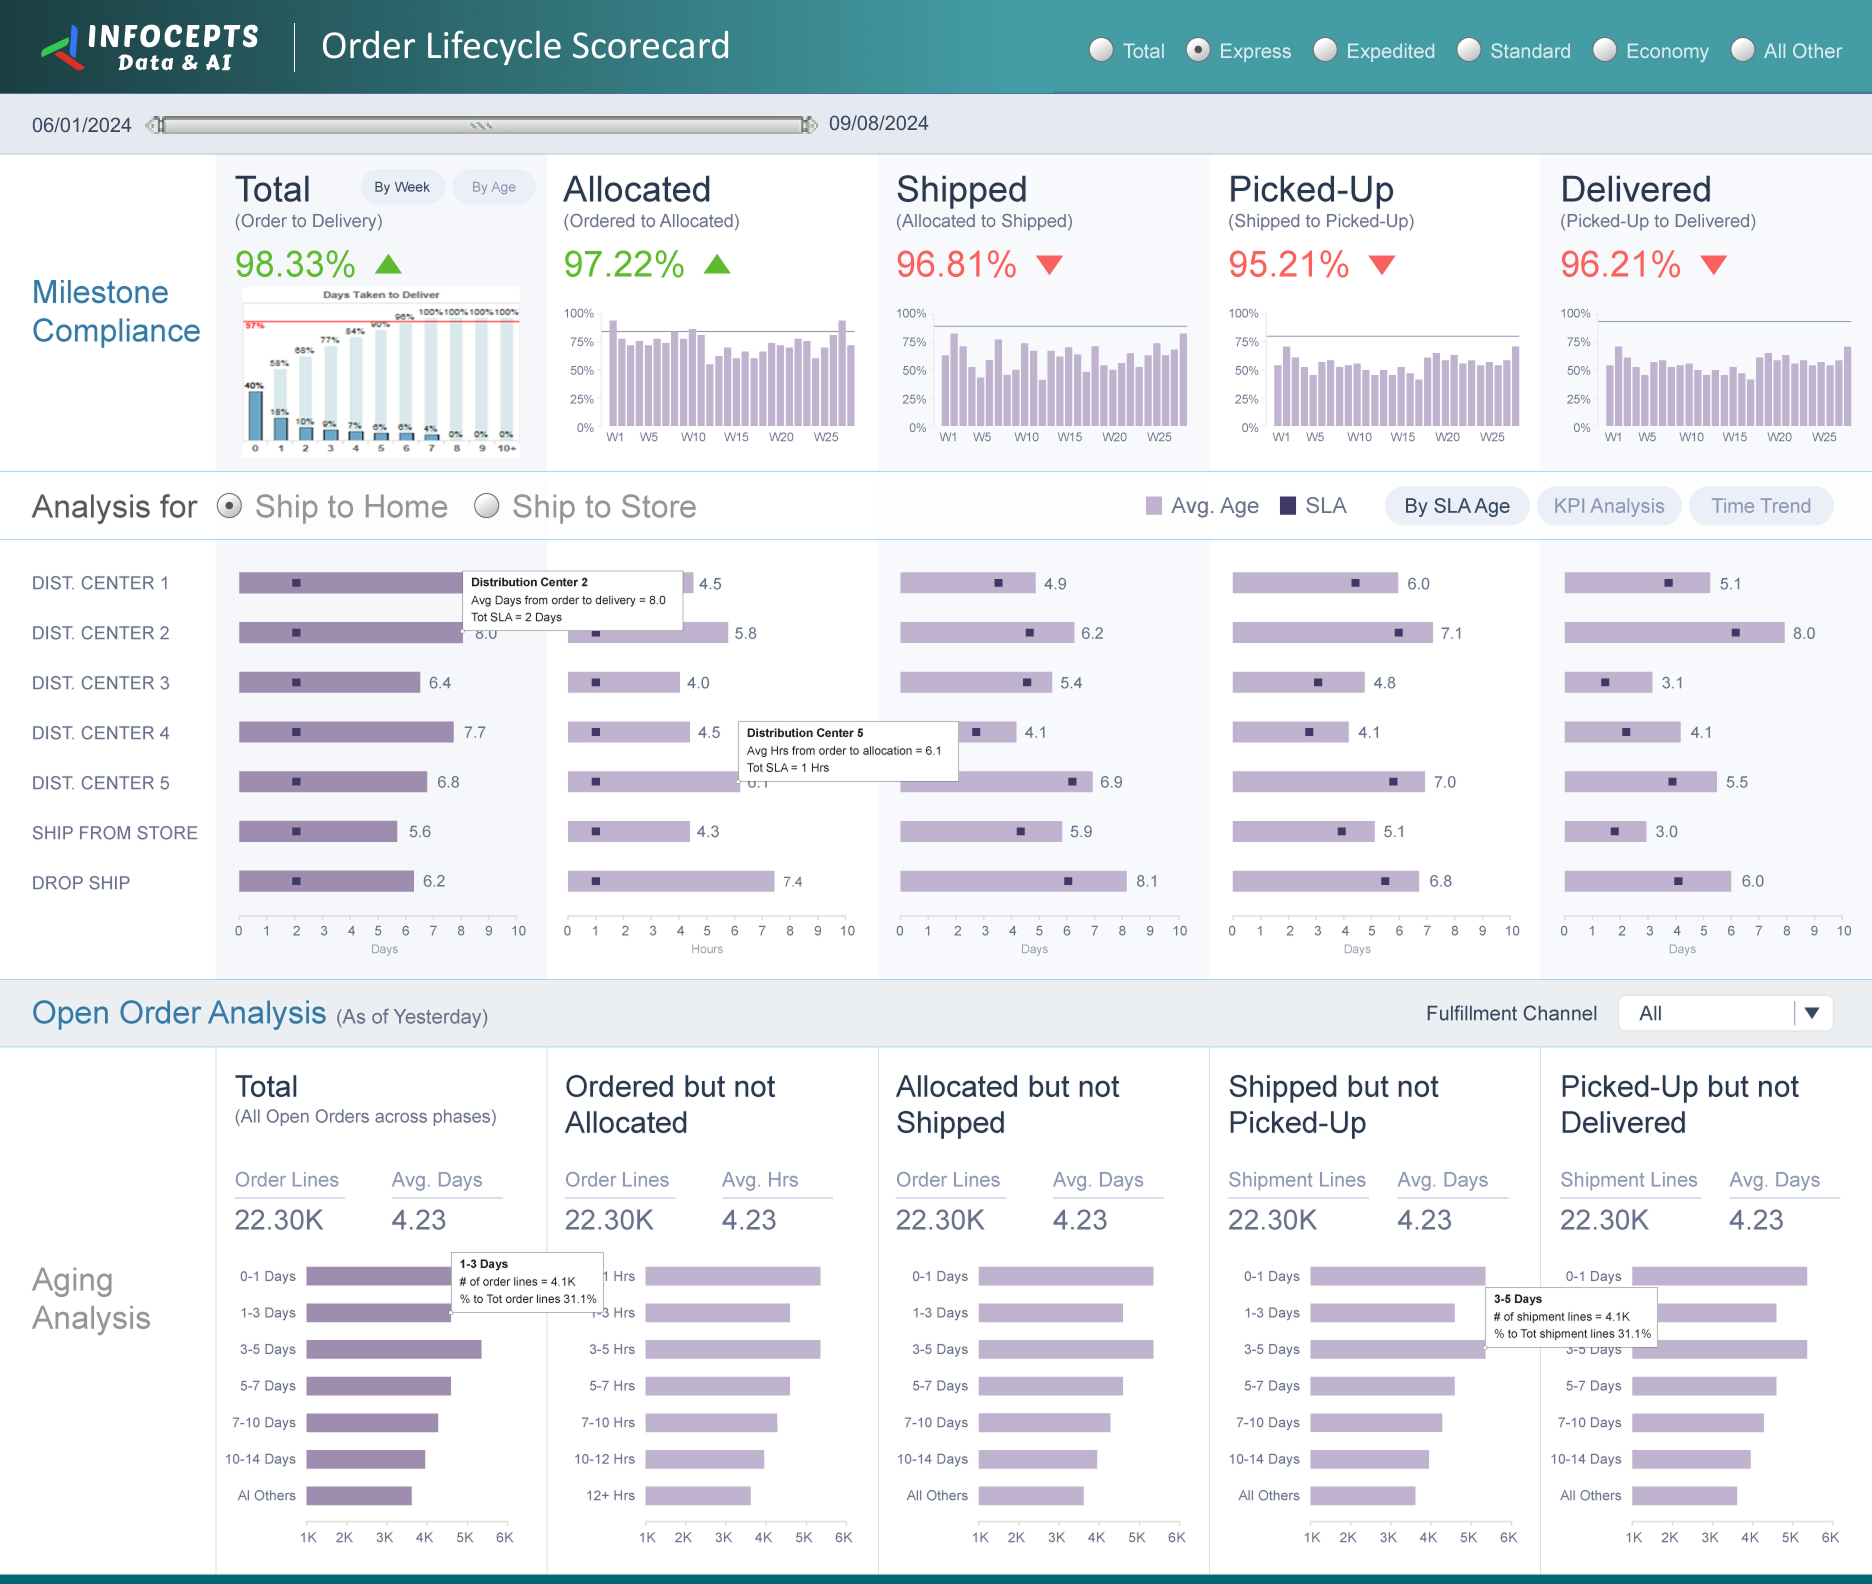
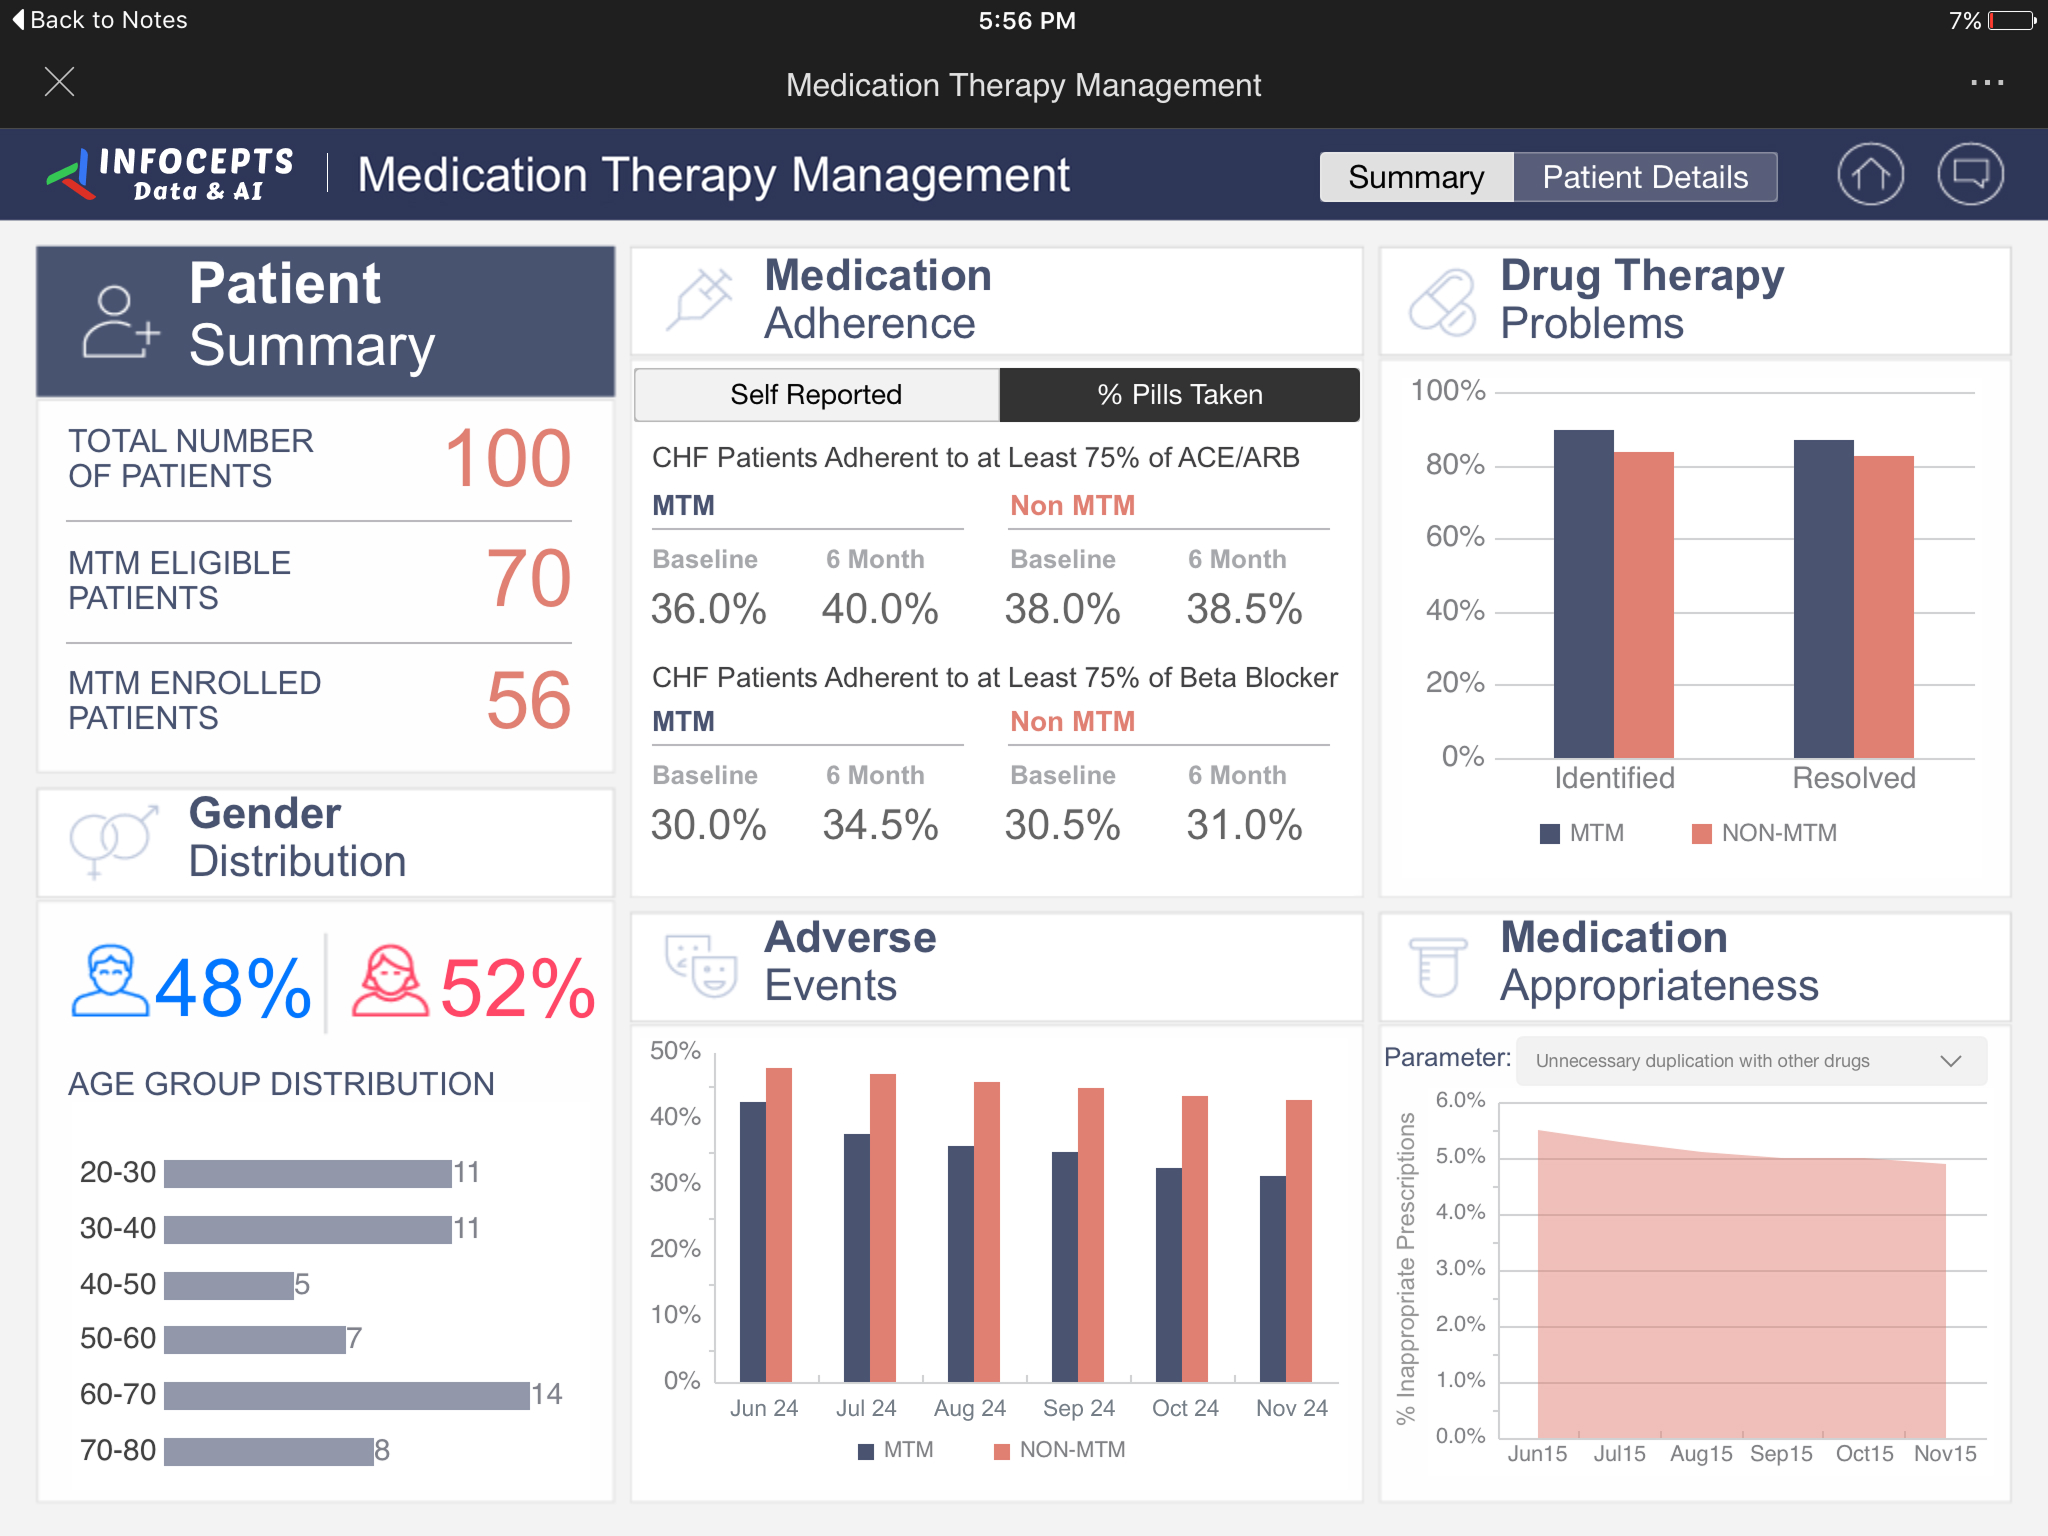
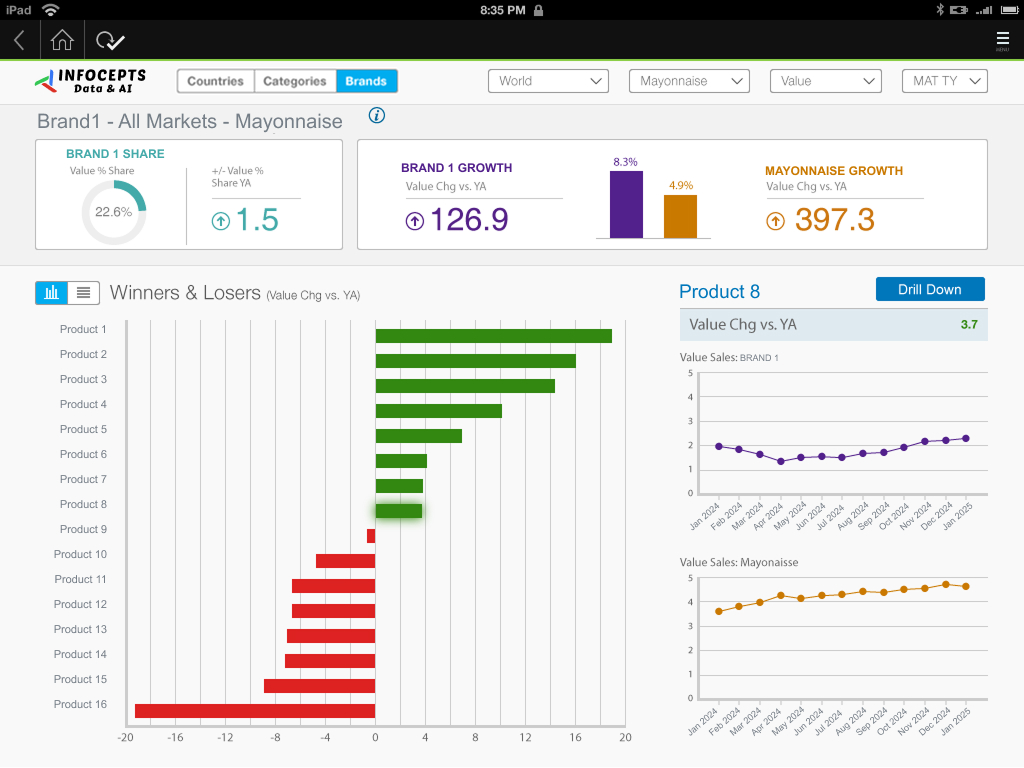
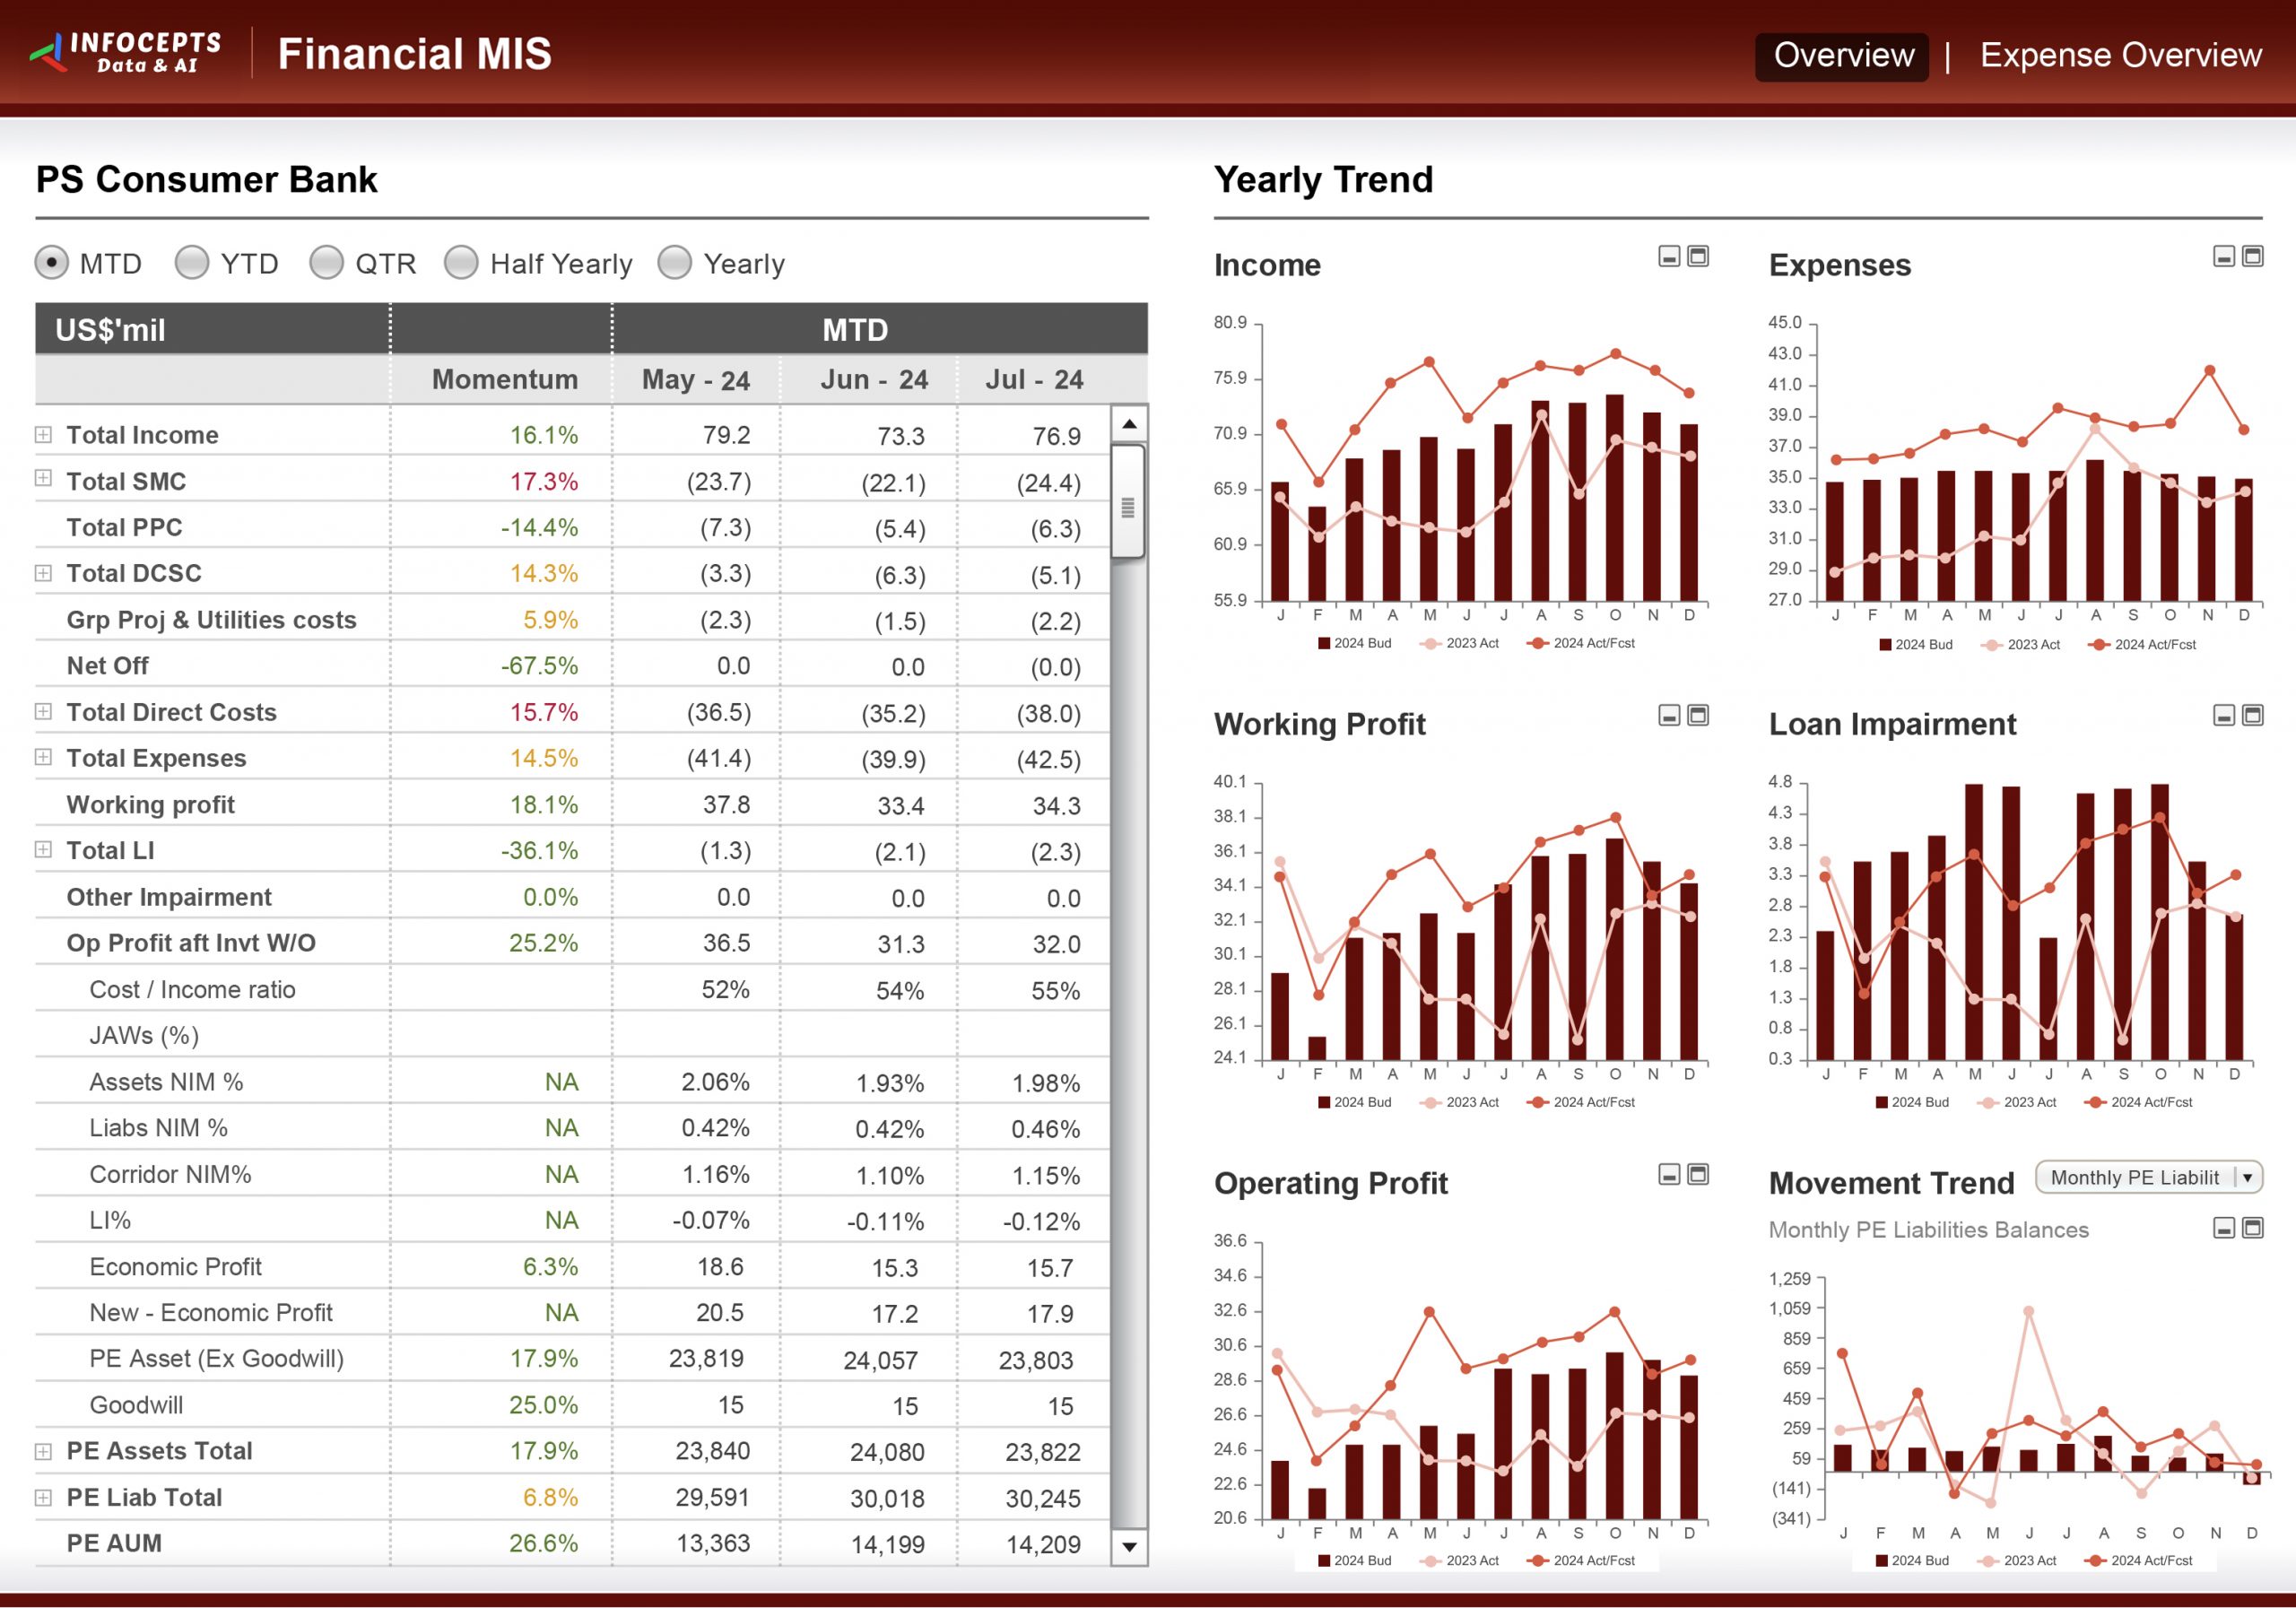
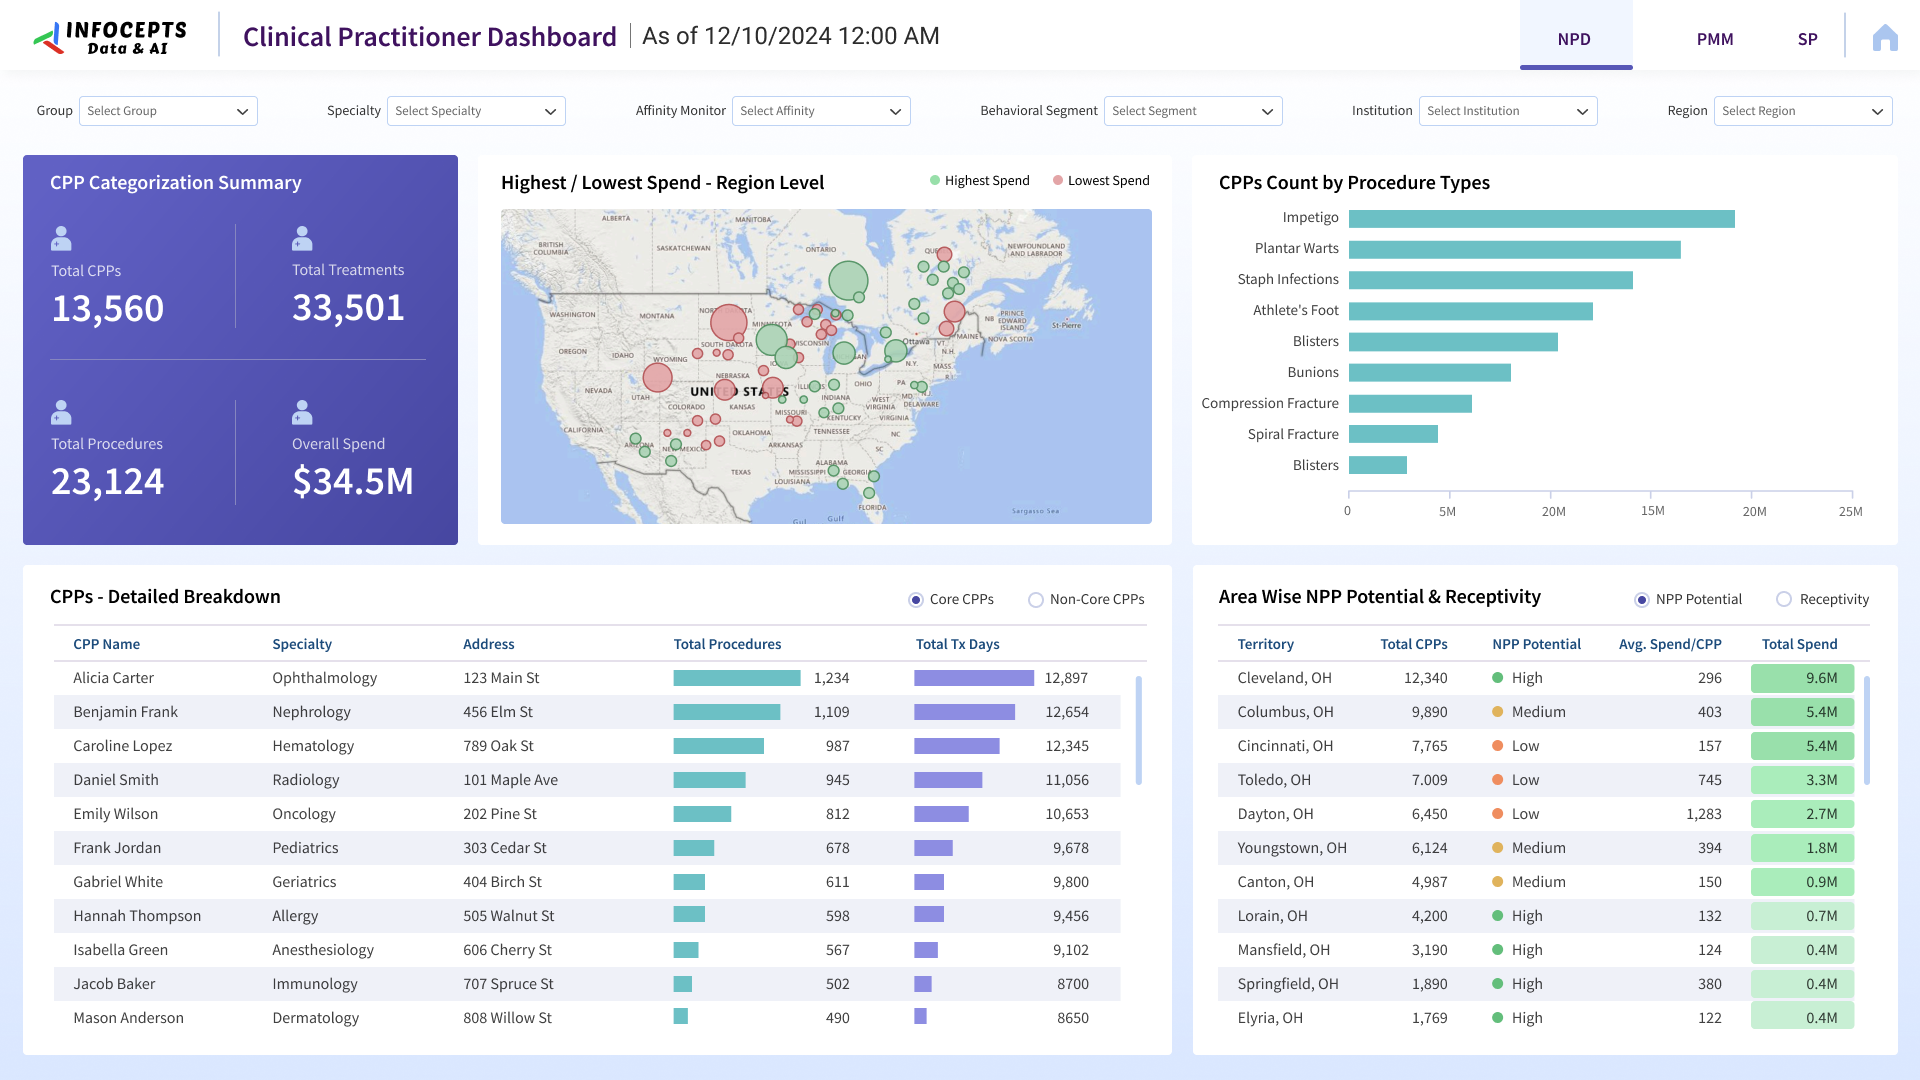
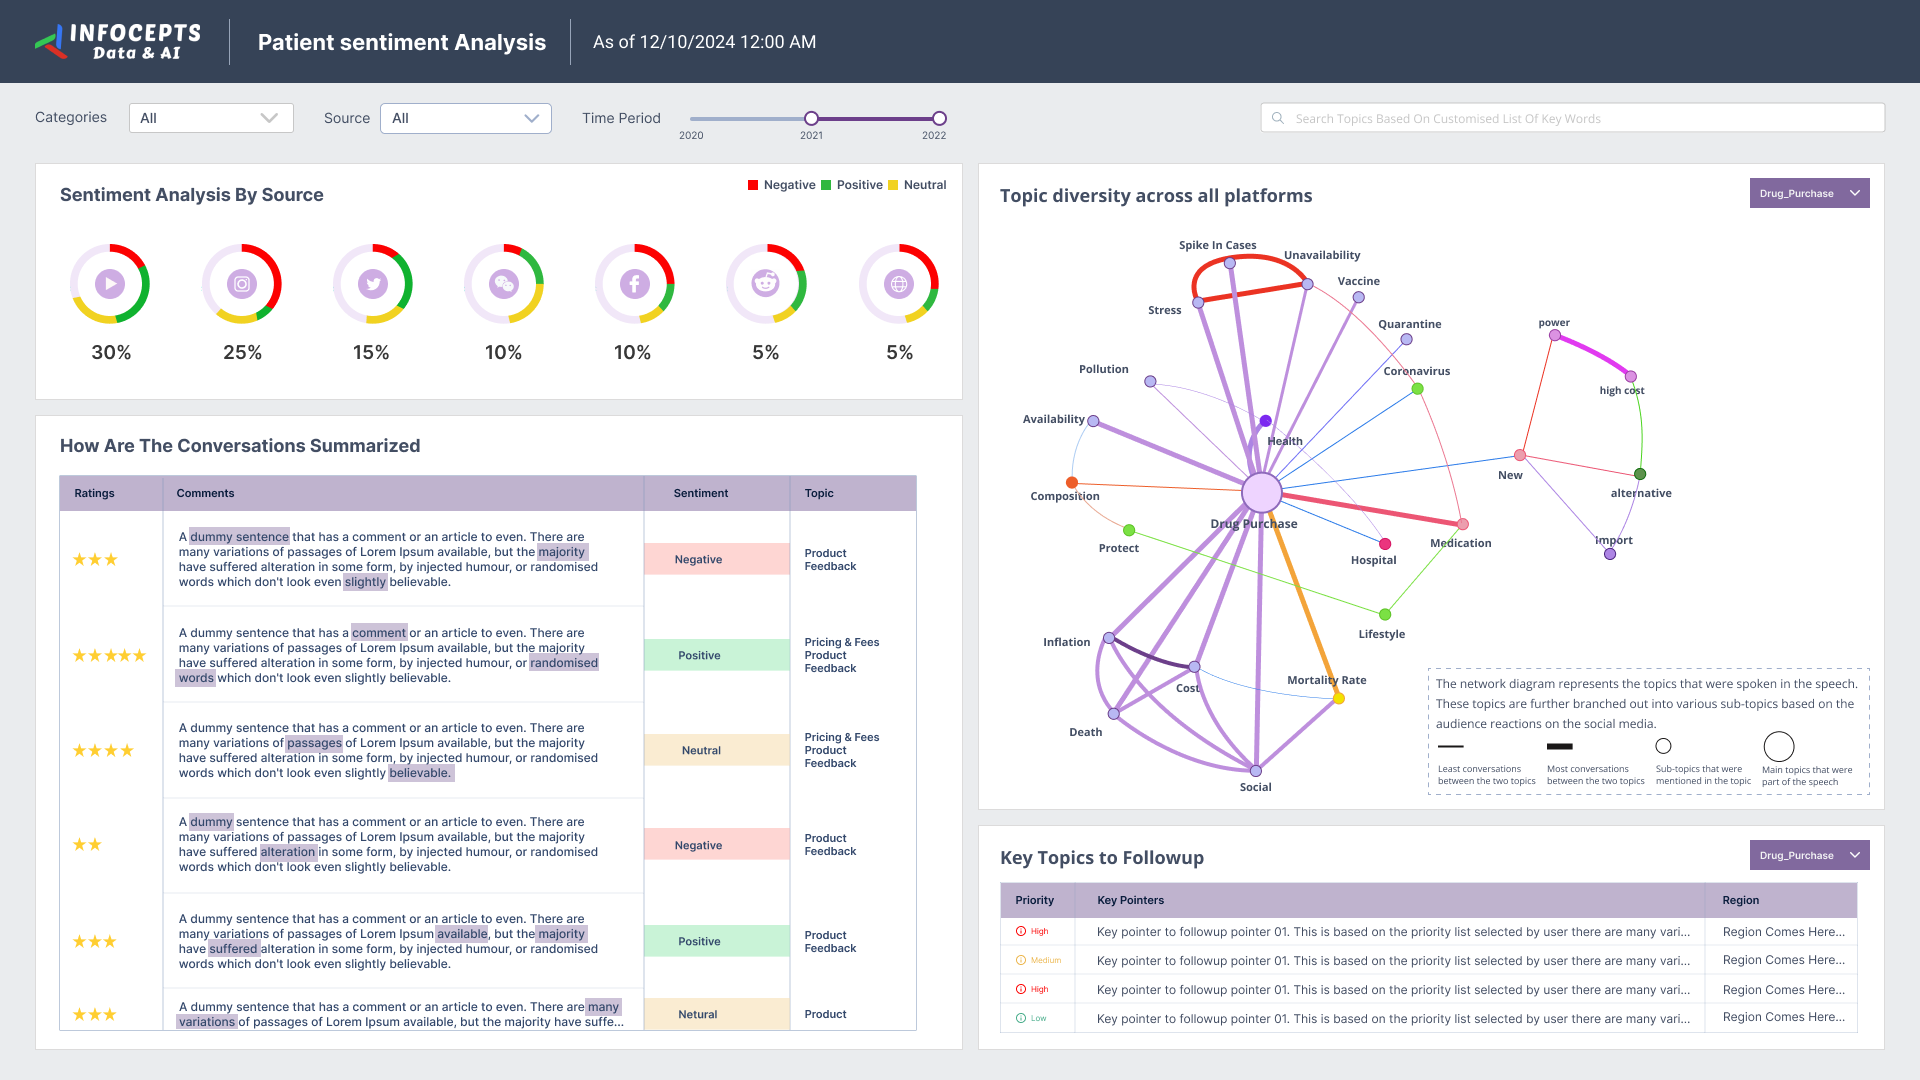
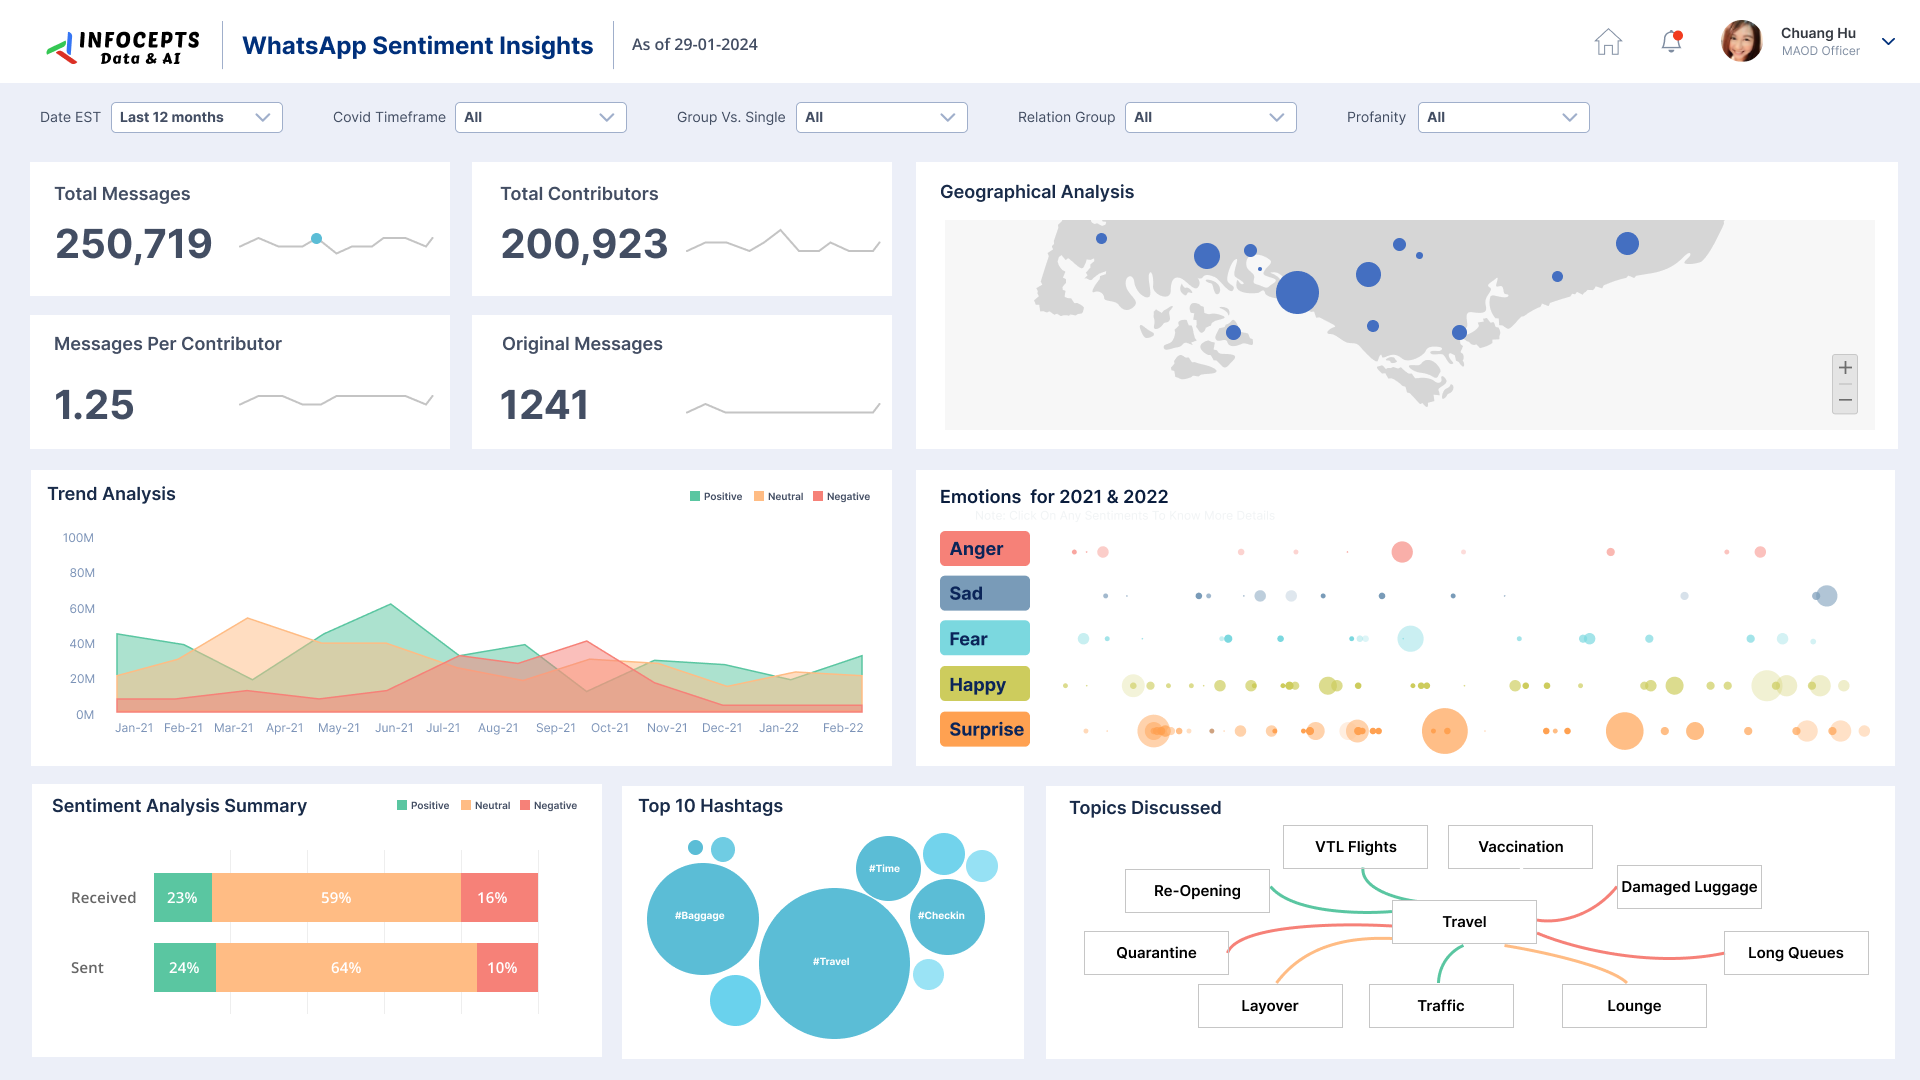
Centralizes group conversation insights by analyzing engagement, sentiment trends, and discussion topics. Key metrics include total participants, active users, average topic discussions, and message volume. With real-time sentiment tracking and AI-powered insights, the dashboard offers intuitive data representation through charts, network graphs, and shape bubbles. Users can filter by sentiment, time range, and trending topics, enabling community managers, analysts, and team leads to make quick, data-driven decisions.
Frequently asked questions
It is the process of using AI to read conversations, reviews, or community discussions and classify the emotion and themes behind them, at a scale no team could manage manually.
Total participants, active users, topic-level discussion volume, and sentiment trends over time, visualized through charts and network graphs rather than raw transcripts.
Community managers, customer experience analysts, and team leads who need to spot a shift in sentiment or a trending topic before it becomes a larger issue.
Yes. Filtering by sentiment, time range, and trending topic is standard, so a team can drill from an overall trend into the specific conversations driving it.
Natural language processing models classify sentiment and extract topics in real time. Infocepts builds this as part of its applied AI and data science work.
Sentiment is one input into a larger customer analytics picture. Pairing it with a BI platform lets teams see sentiment alongside revenue, support, and retention metrics in one place.

 Pranali Lanjewar