



21%
Reduced time to insight
58%
Increase in research spending
44%
Increase in informed decision-making
39%
Increase in positive investor sentiment
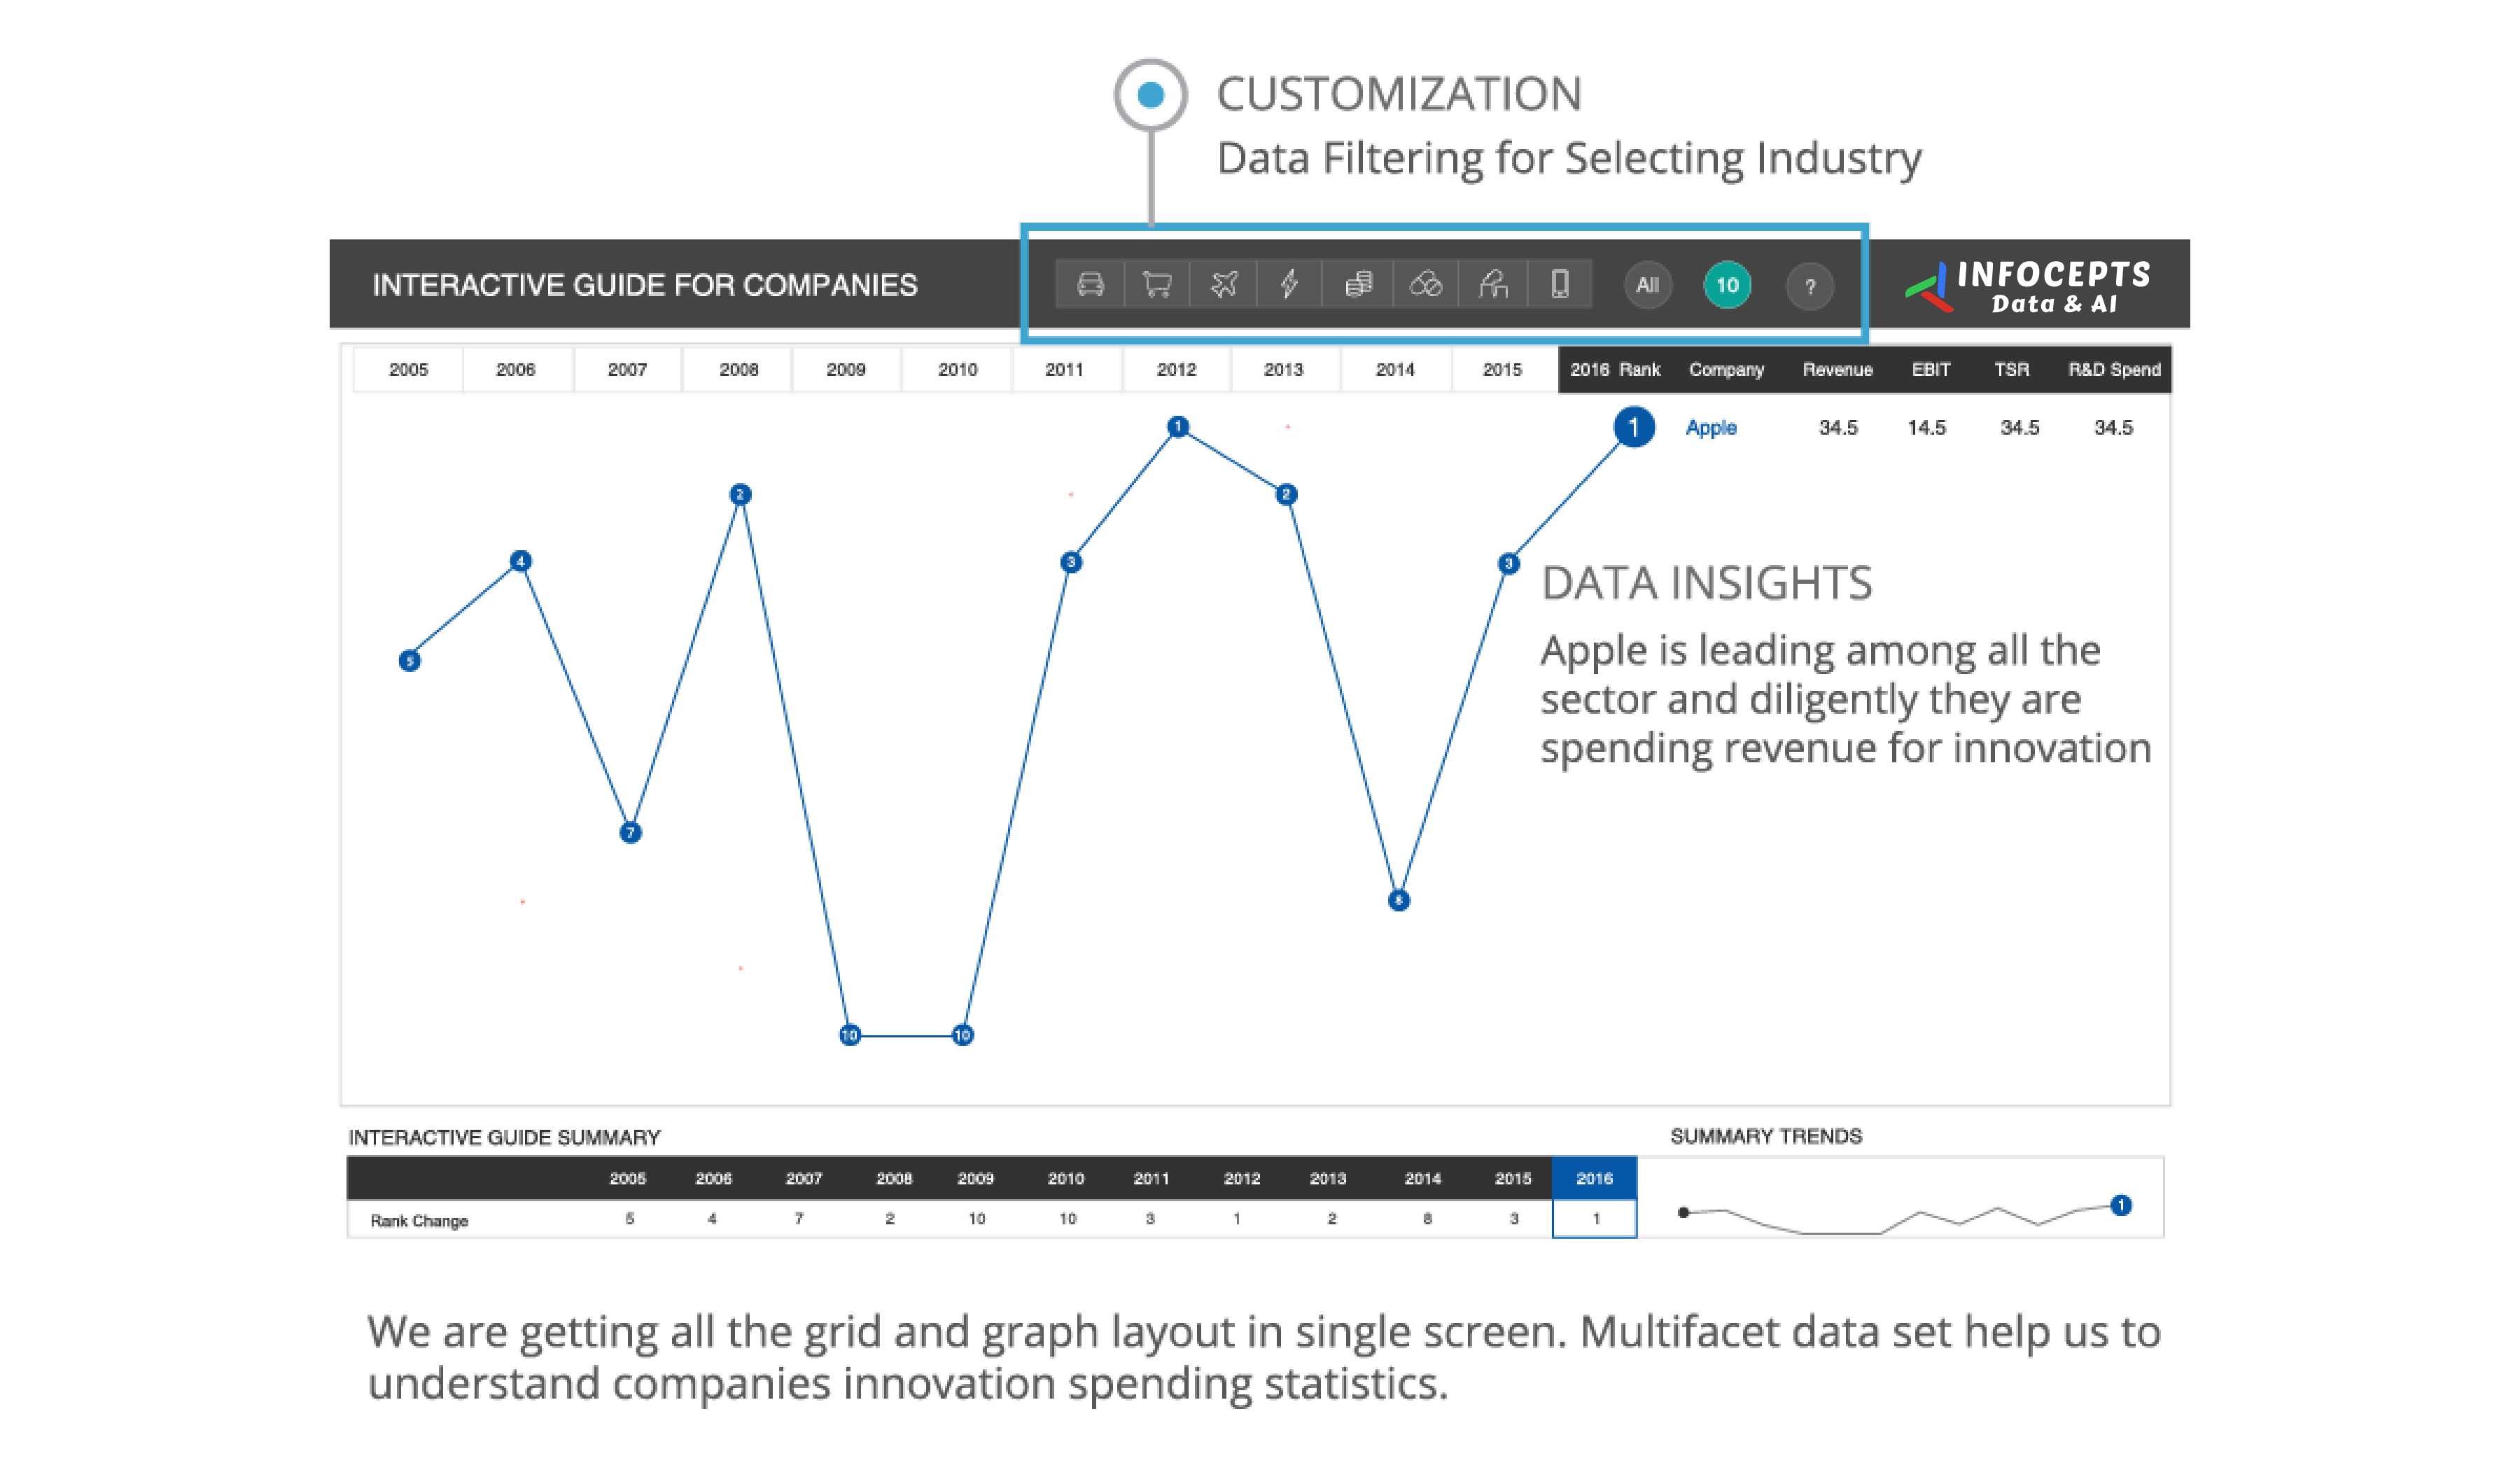
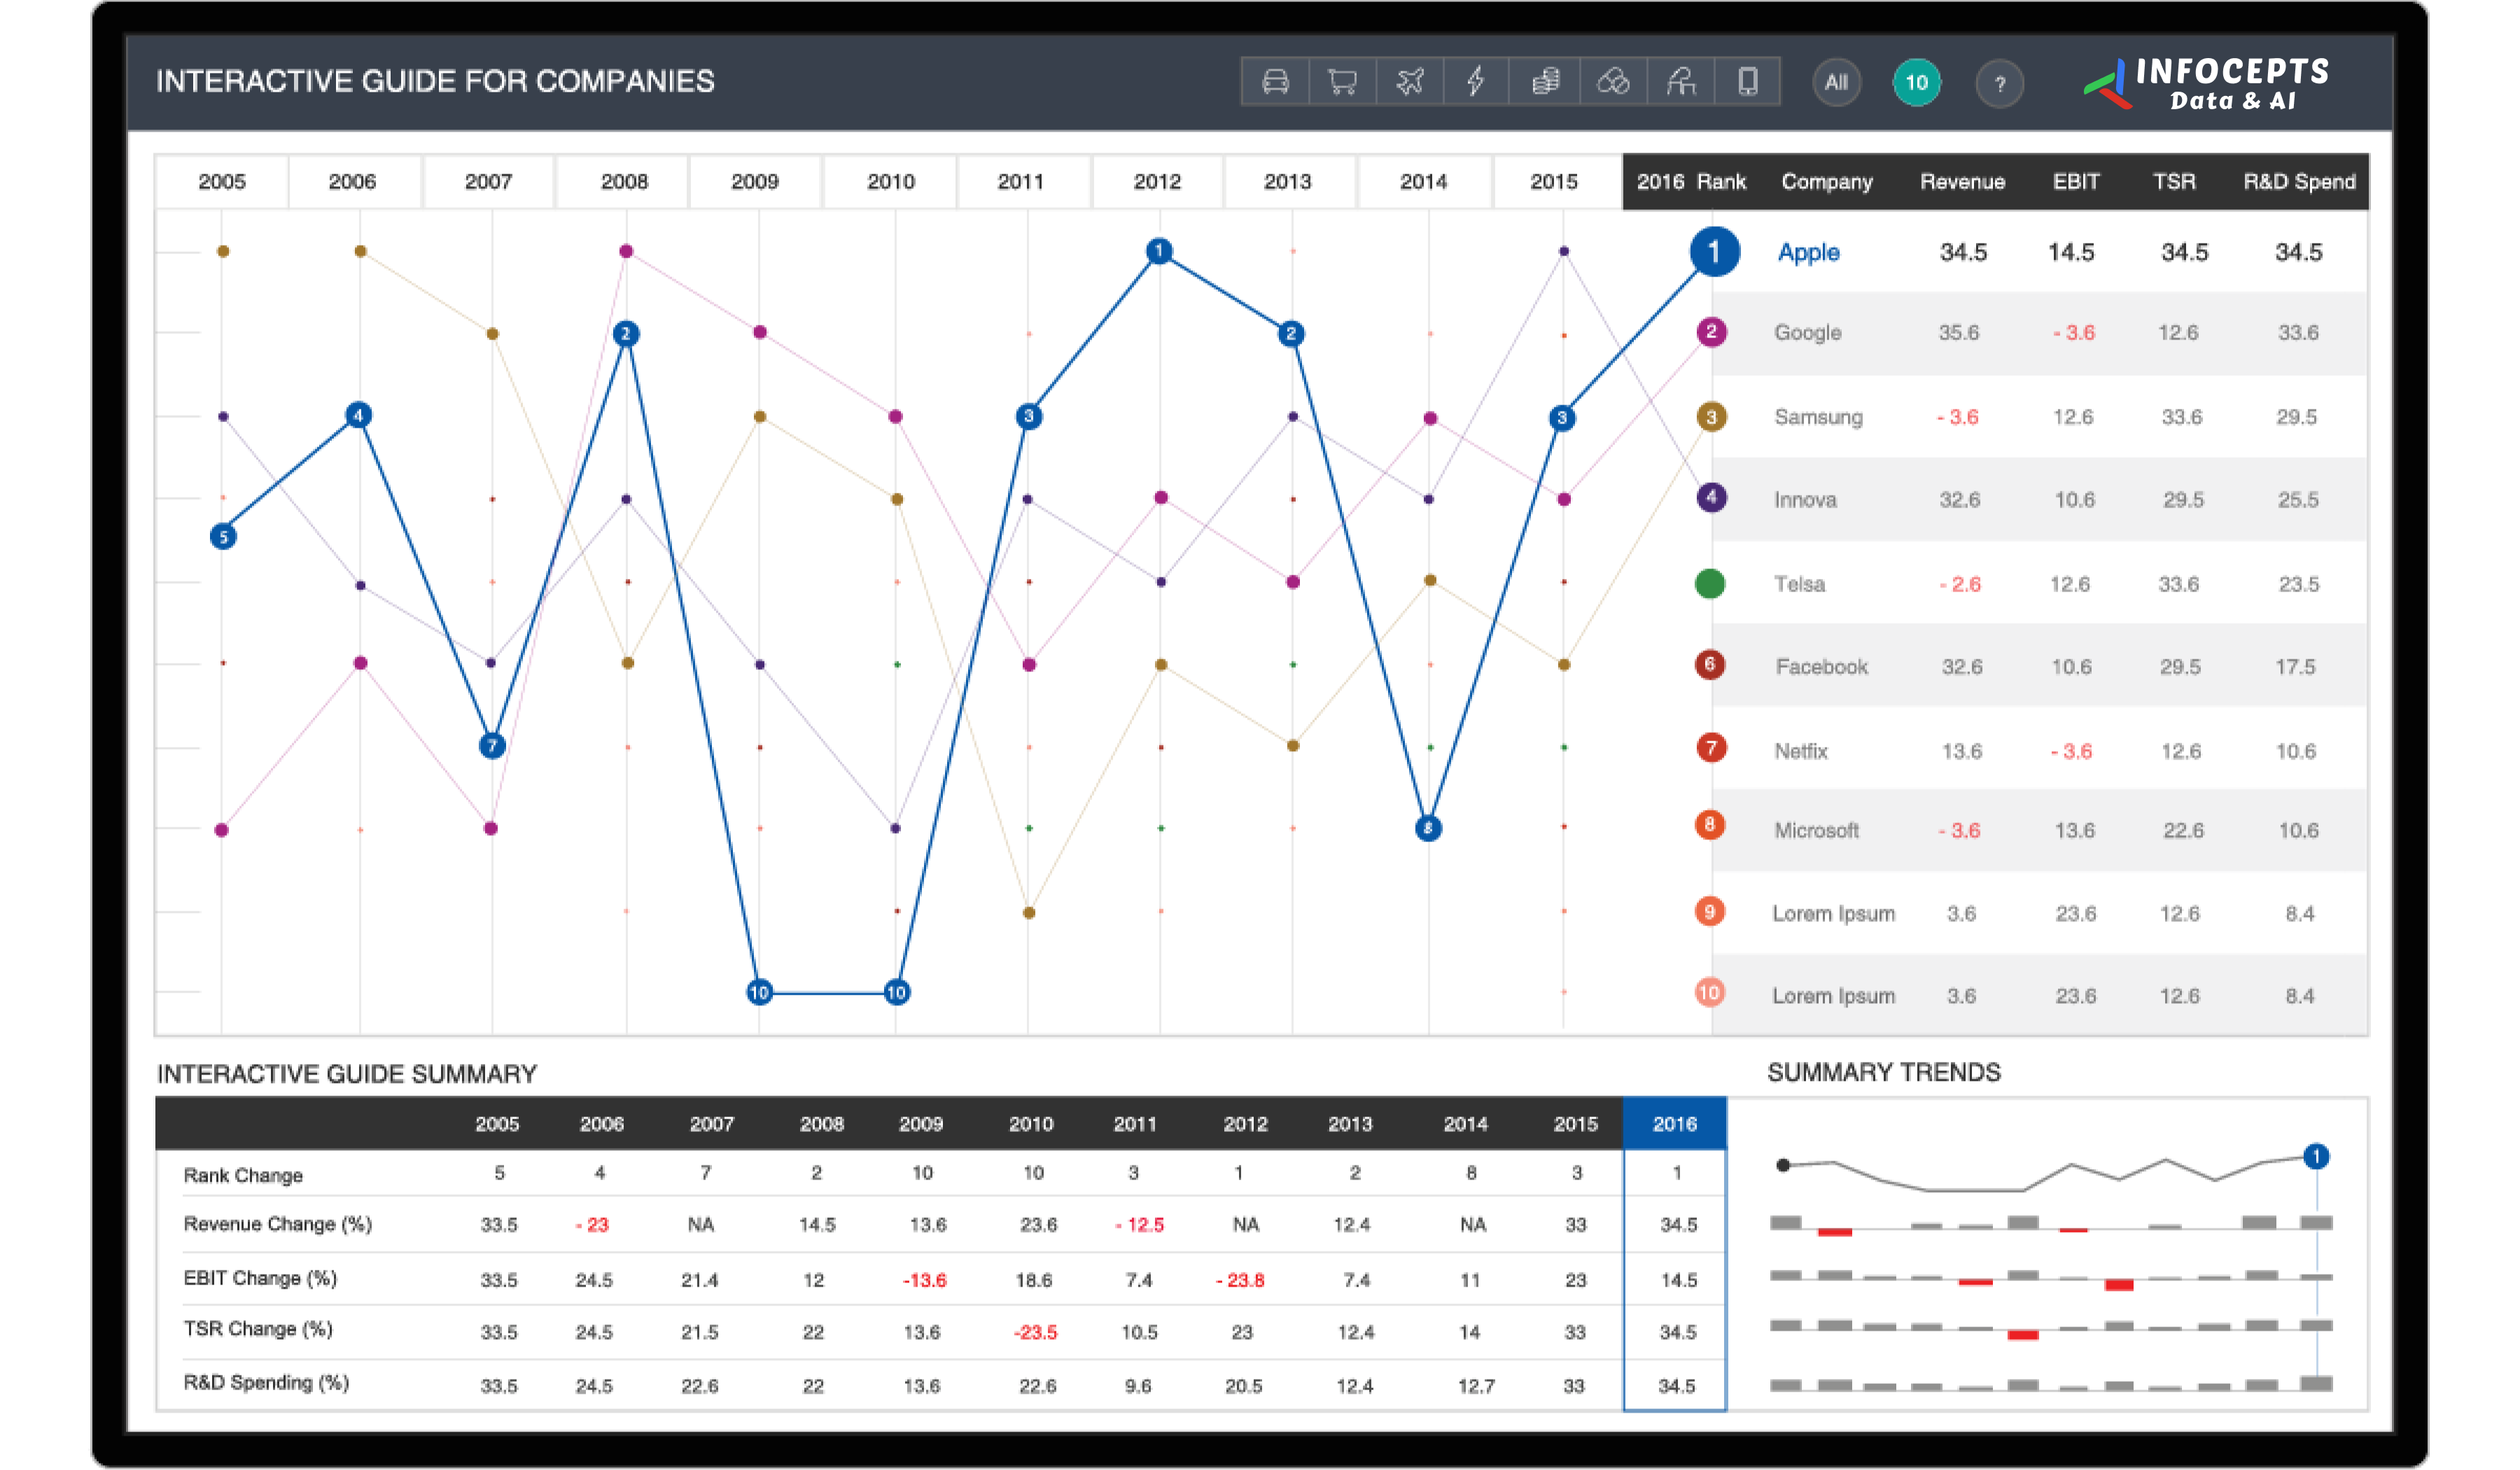
Staying ahead in innovation requires strategic investment in research and development. The Corporate Innovation Budget Dashboard by Infocepts enables businesses, investors, and researchers to compare the R&D spending of top innovative companies, uncovering key trends that drive rankings and business performance.
This interactive dashboard offers a comparative view of company rankings over 11 years, linking R&D investments to revenue growth, EBIT (Earnings Before Interest & Taxes), and TSR (Total Shareholder Return). With data-driven insights, businesses can assess market positioning, track competitor spending, and optimize innovation strategies for maximum impact.
Frequently asked questions
It compares R&D spending across top innovative companies against outcomes like revenue growth, EBIT, and total shareholder return, so investment decisions are grounded in what has actually correlated with performance.
A single year of R&D spend data can be noisy; an 11-year view shows whether a spending pattern reliably correlates with performance or was a one-time result.
Businesses, investors, and researchers assessing innovation strategy and market positioning relative to competitors.
Where to prioritize innovation investment and how a company’s R&D spend compares to competitors driving stronger financial outcomes.
By connecting financial and R&D data into a BI platform through Business Analytics services, scoped with Data & AI Strategy work.

 Pranali Lanjewar
 admin
admin