




37%
Reduced Time to Insights
53%
Increased Infrastructure Preparedness
21%
Reduced Mortality Rate
11%
Increased Treatment Access
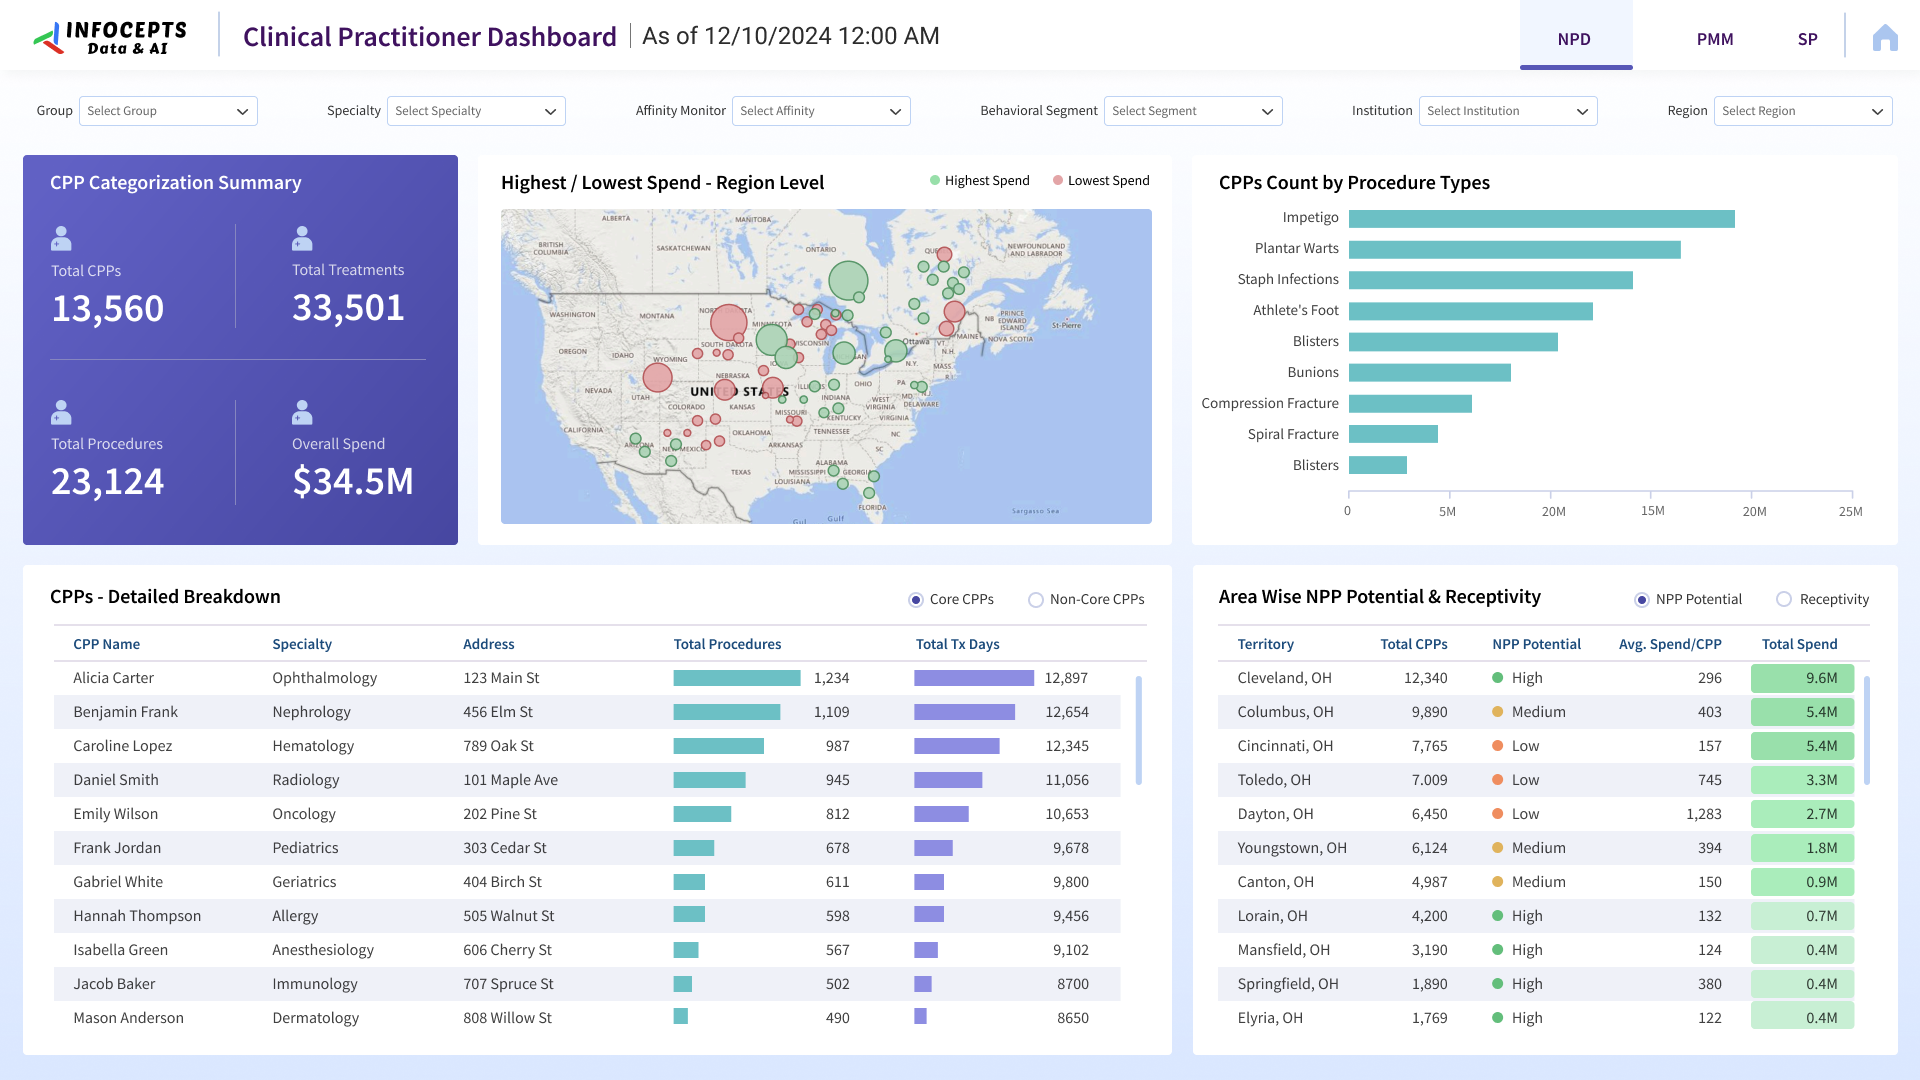
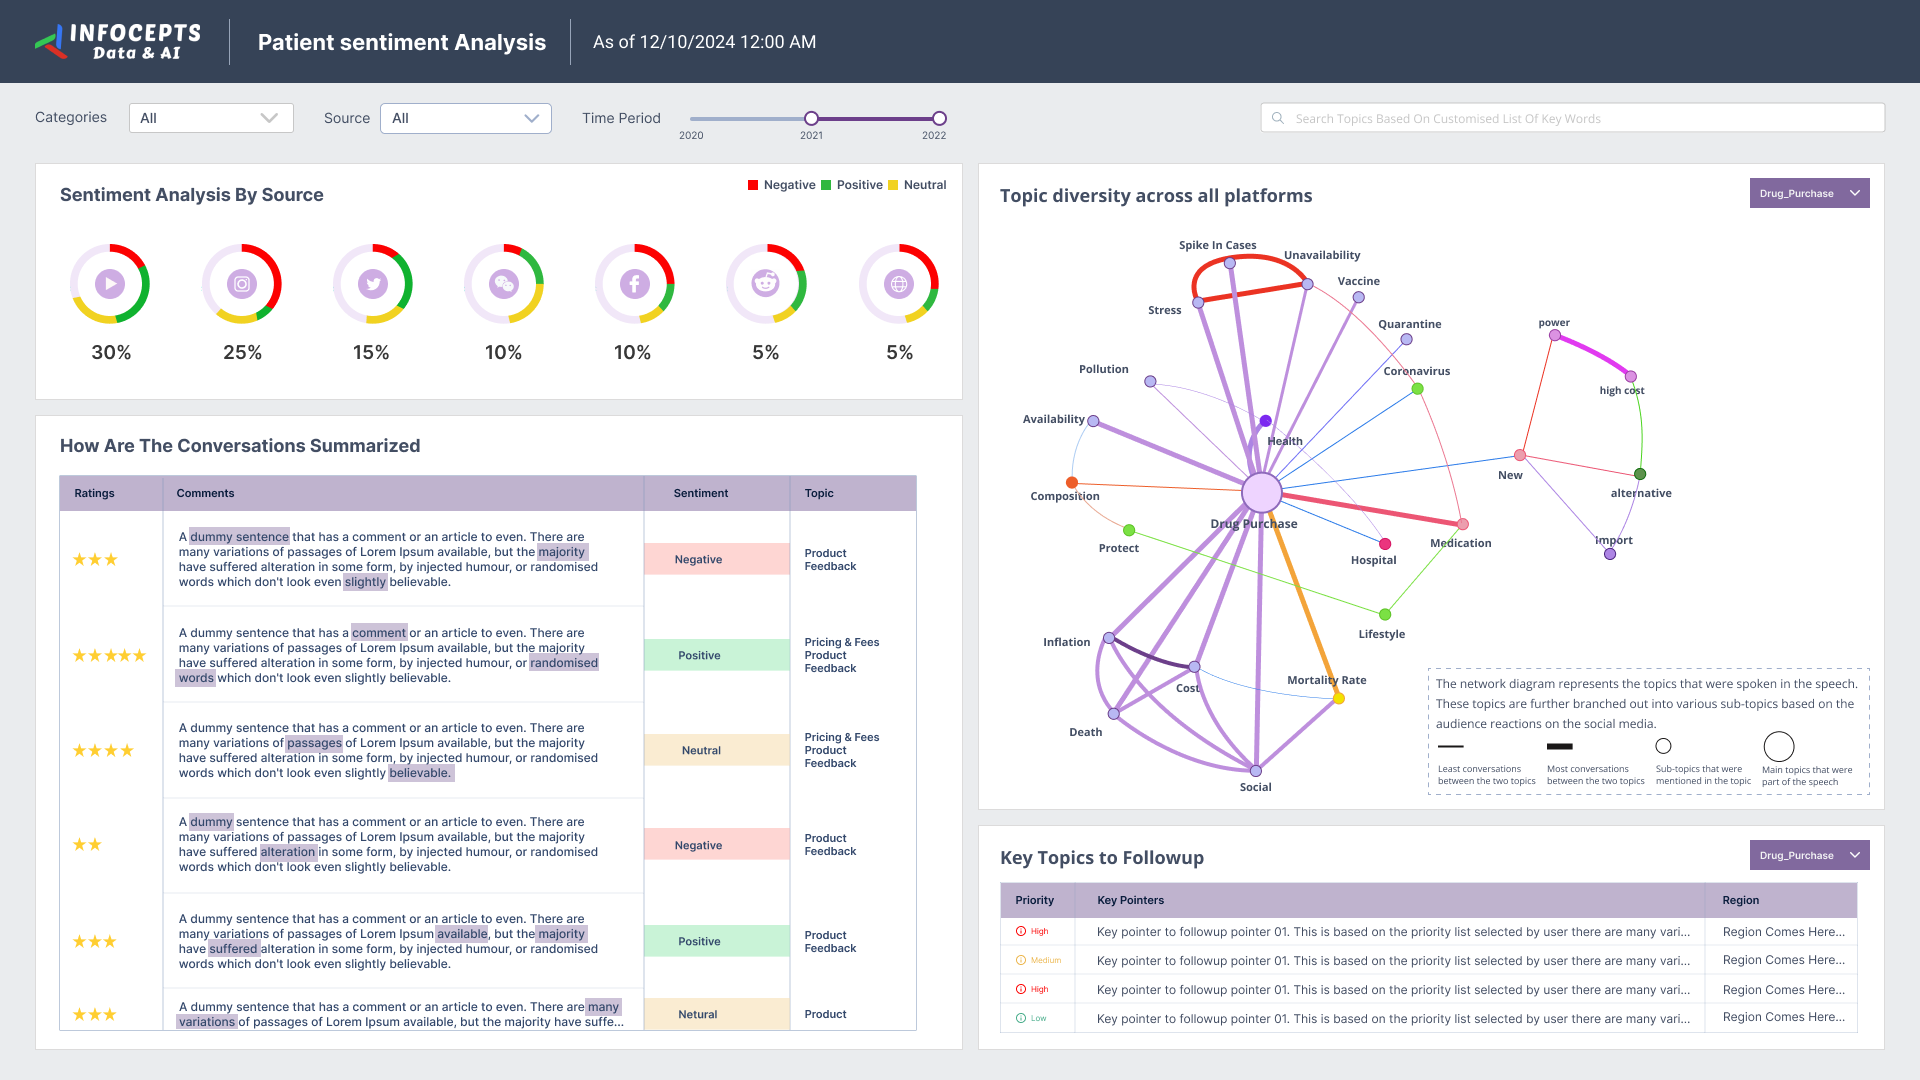
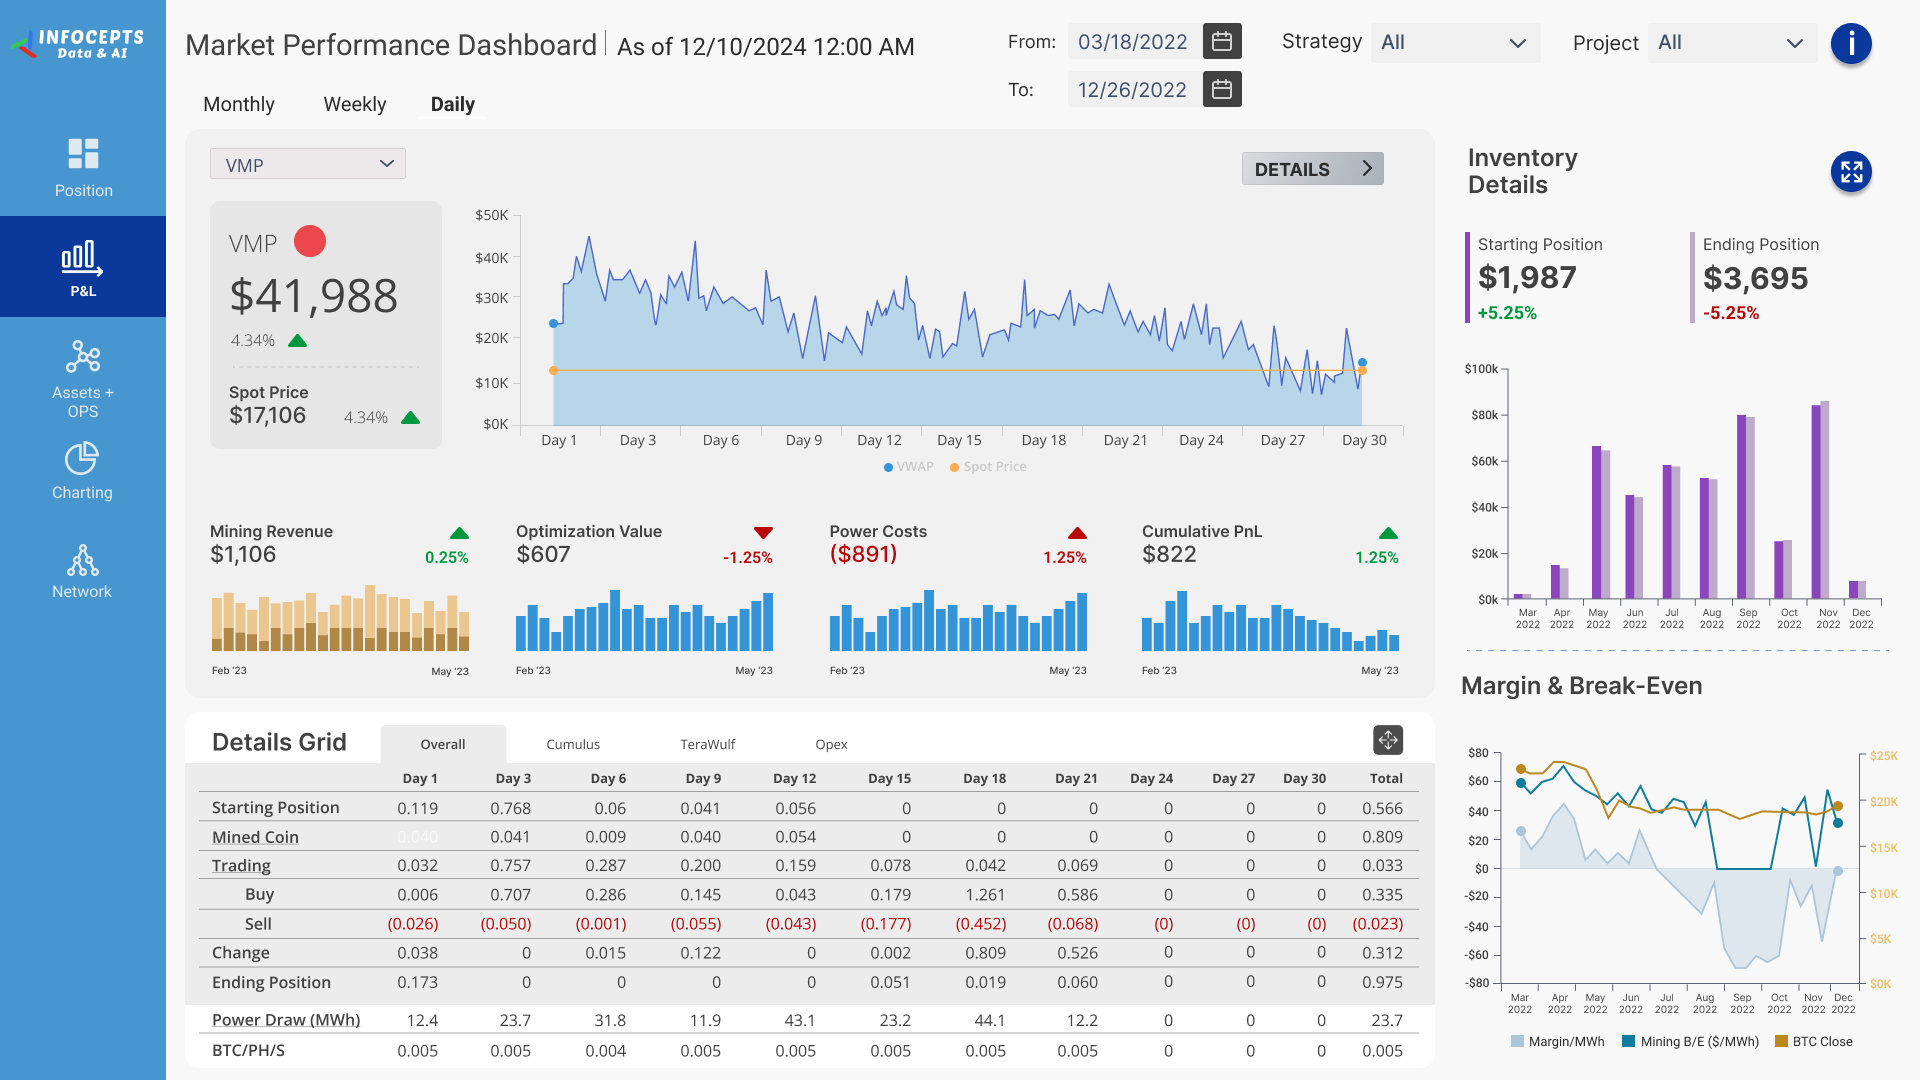
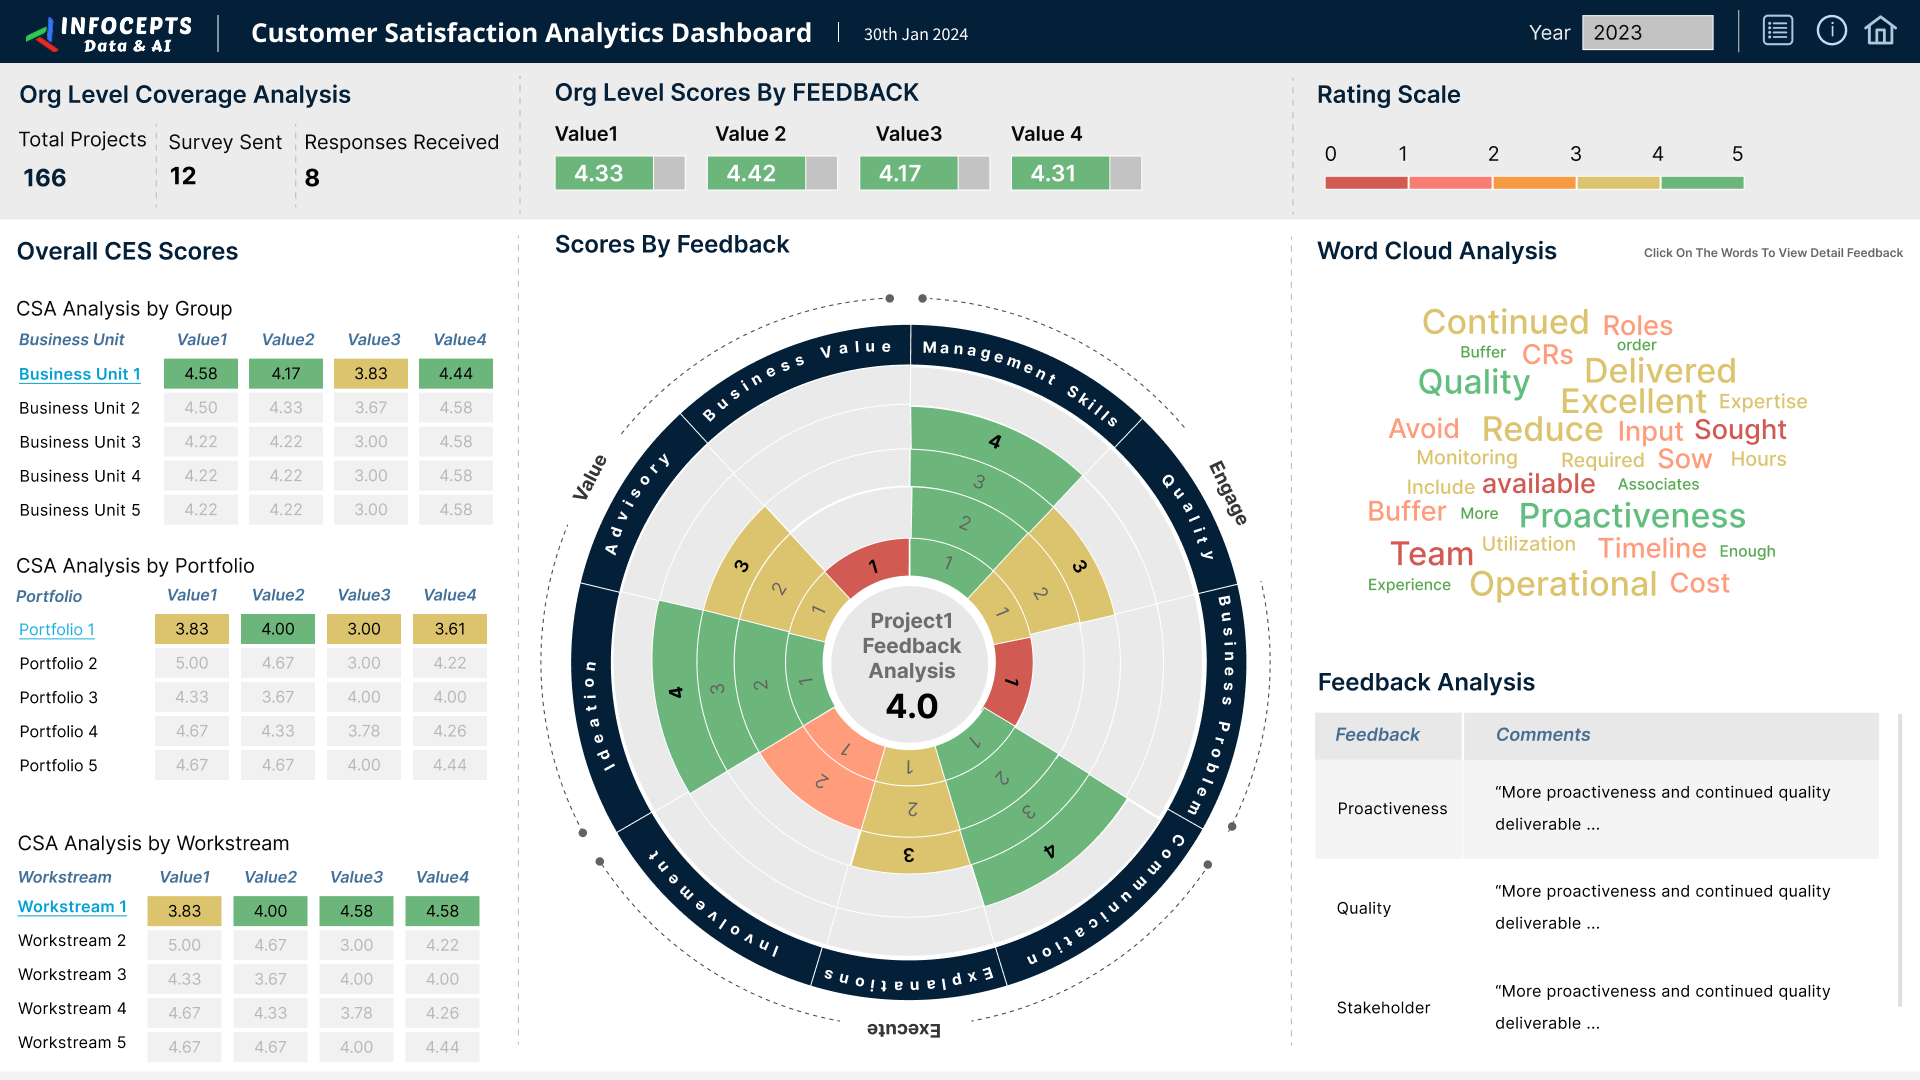
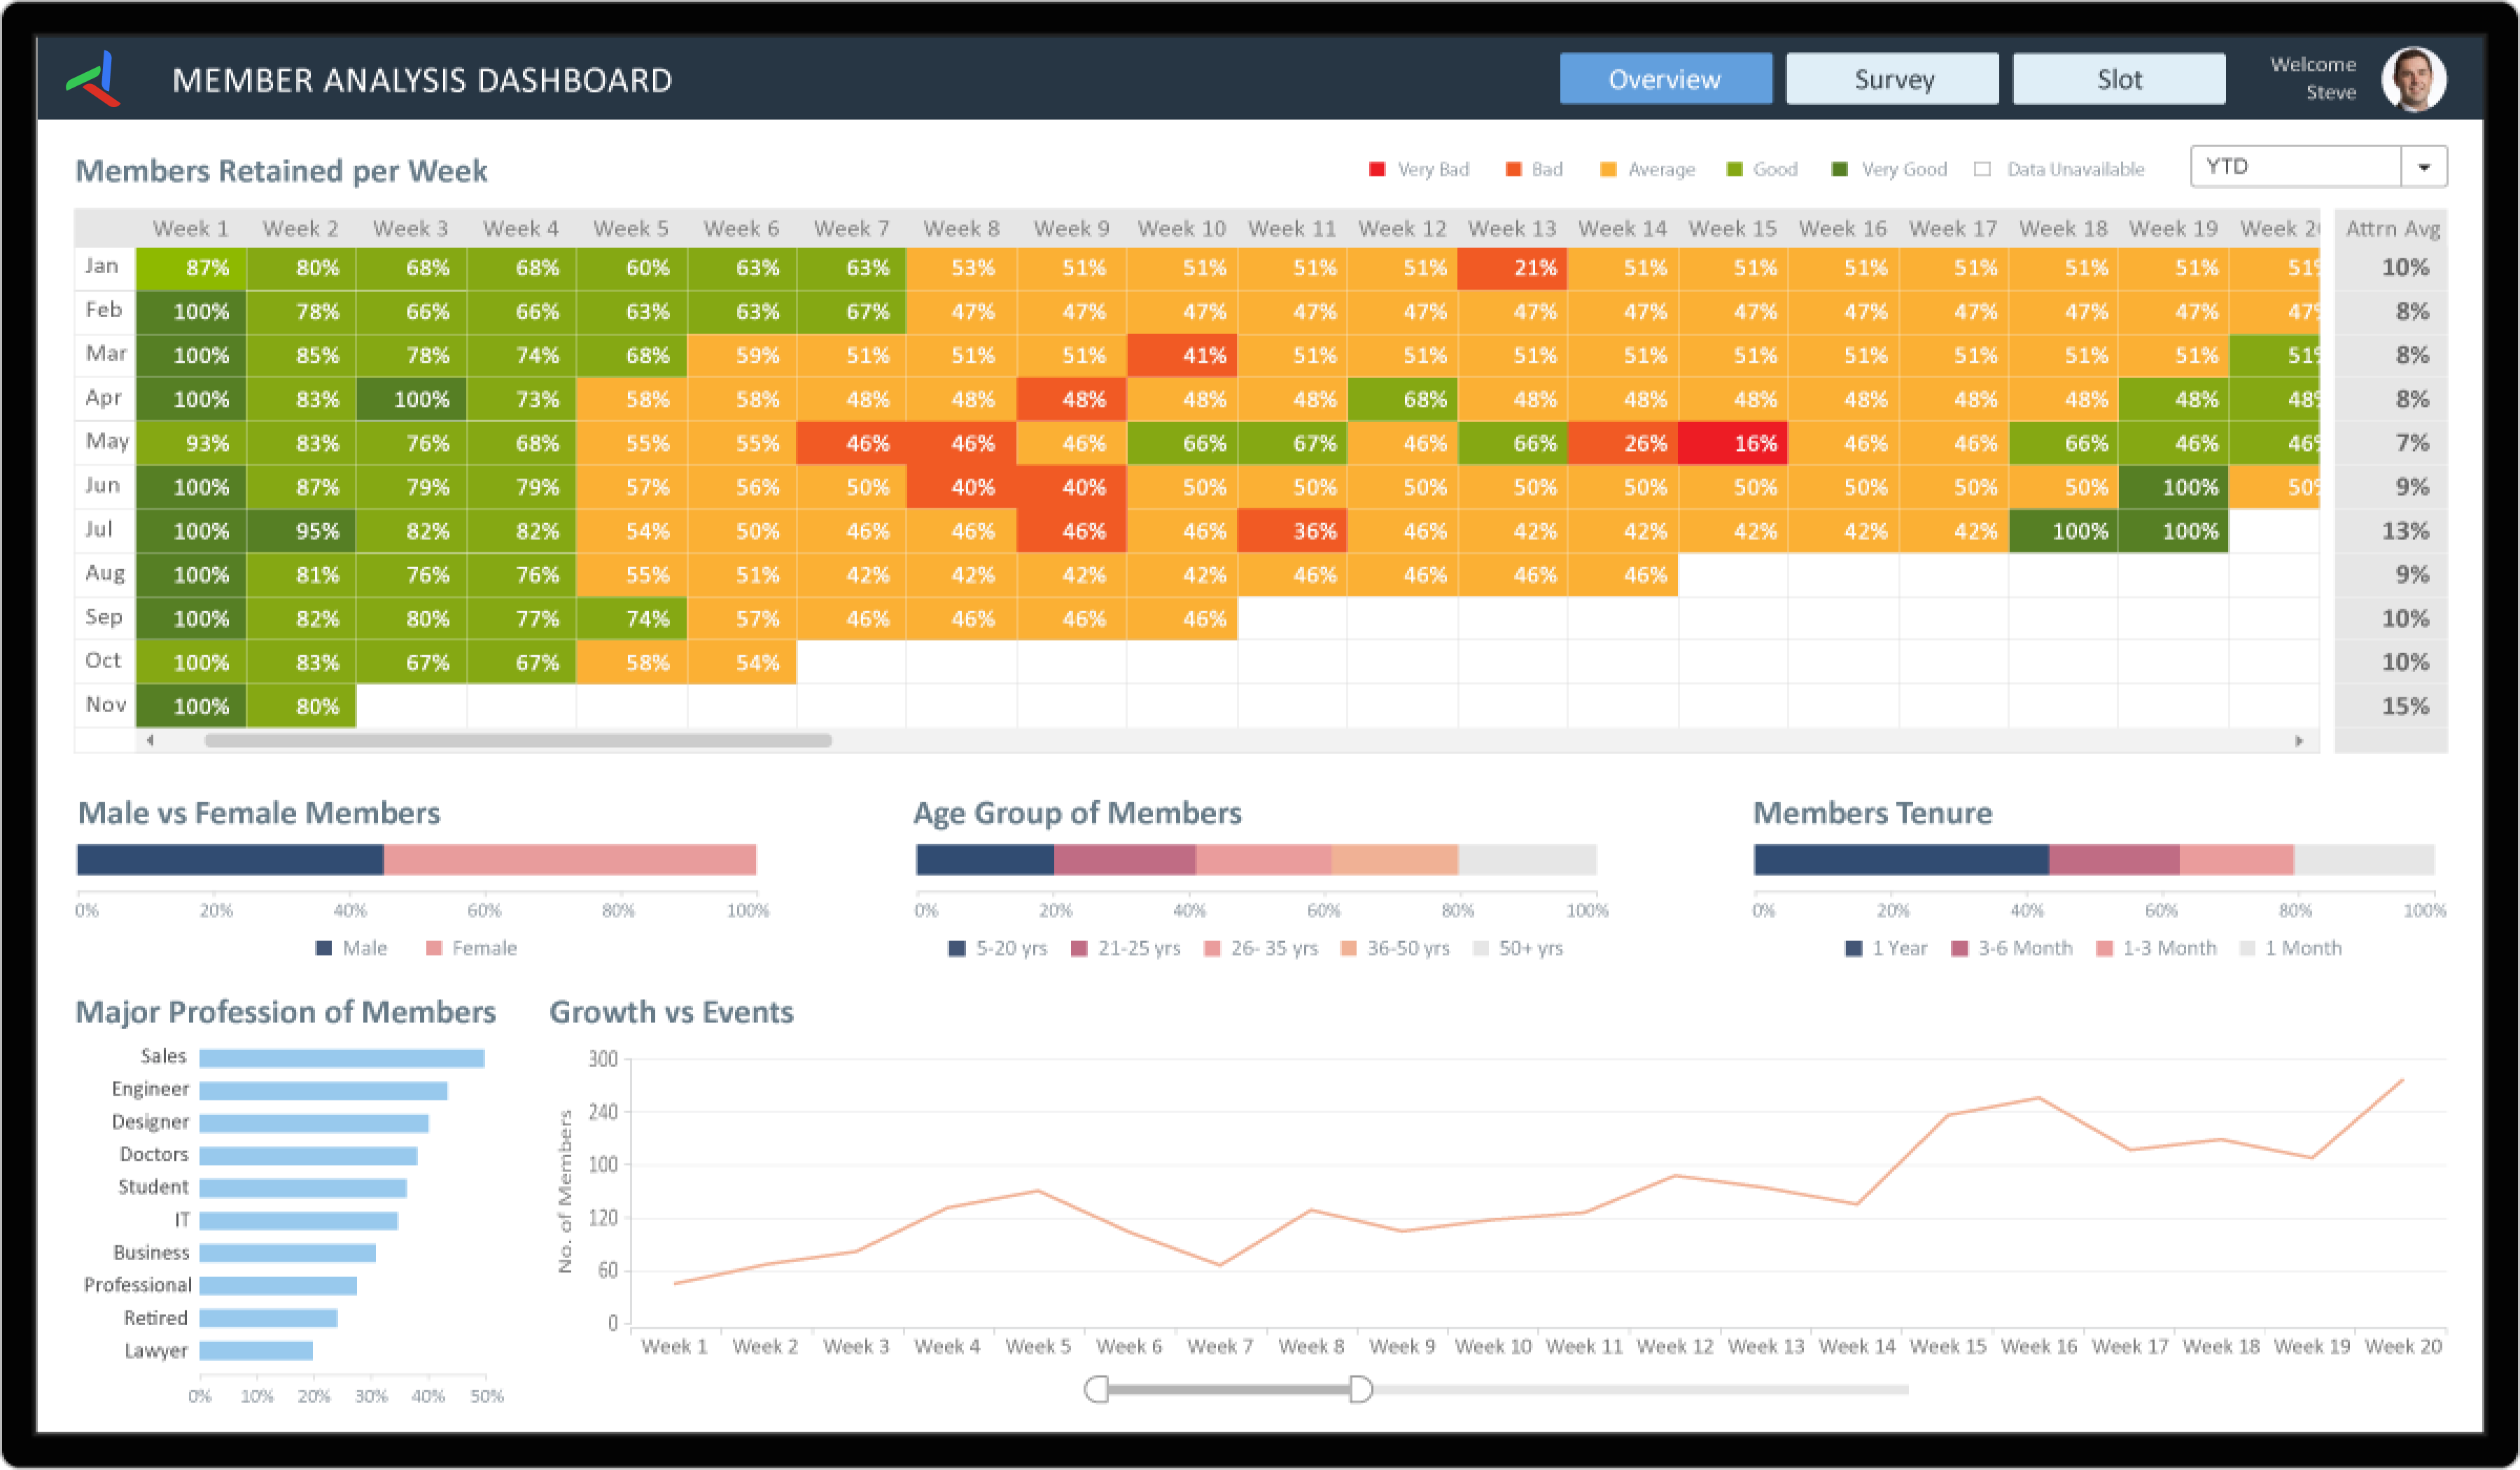
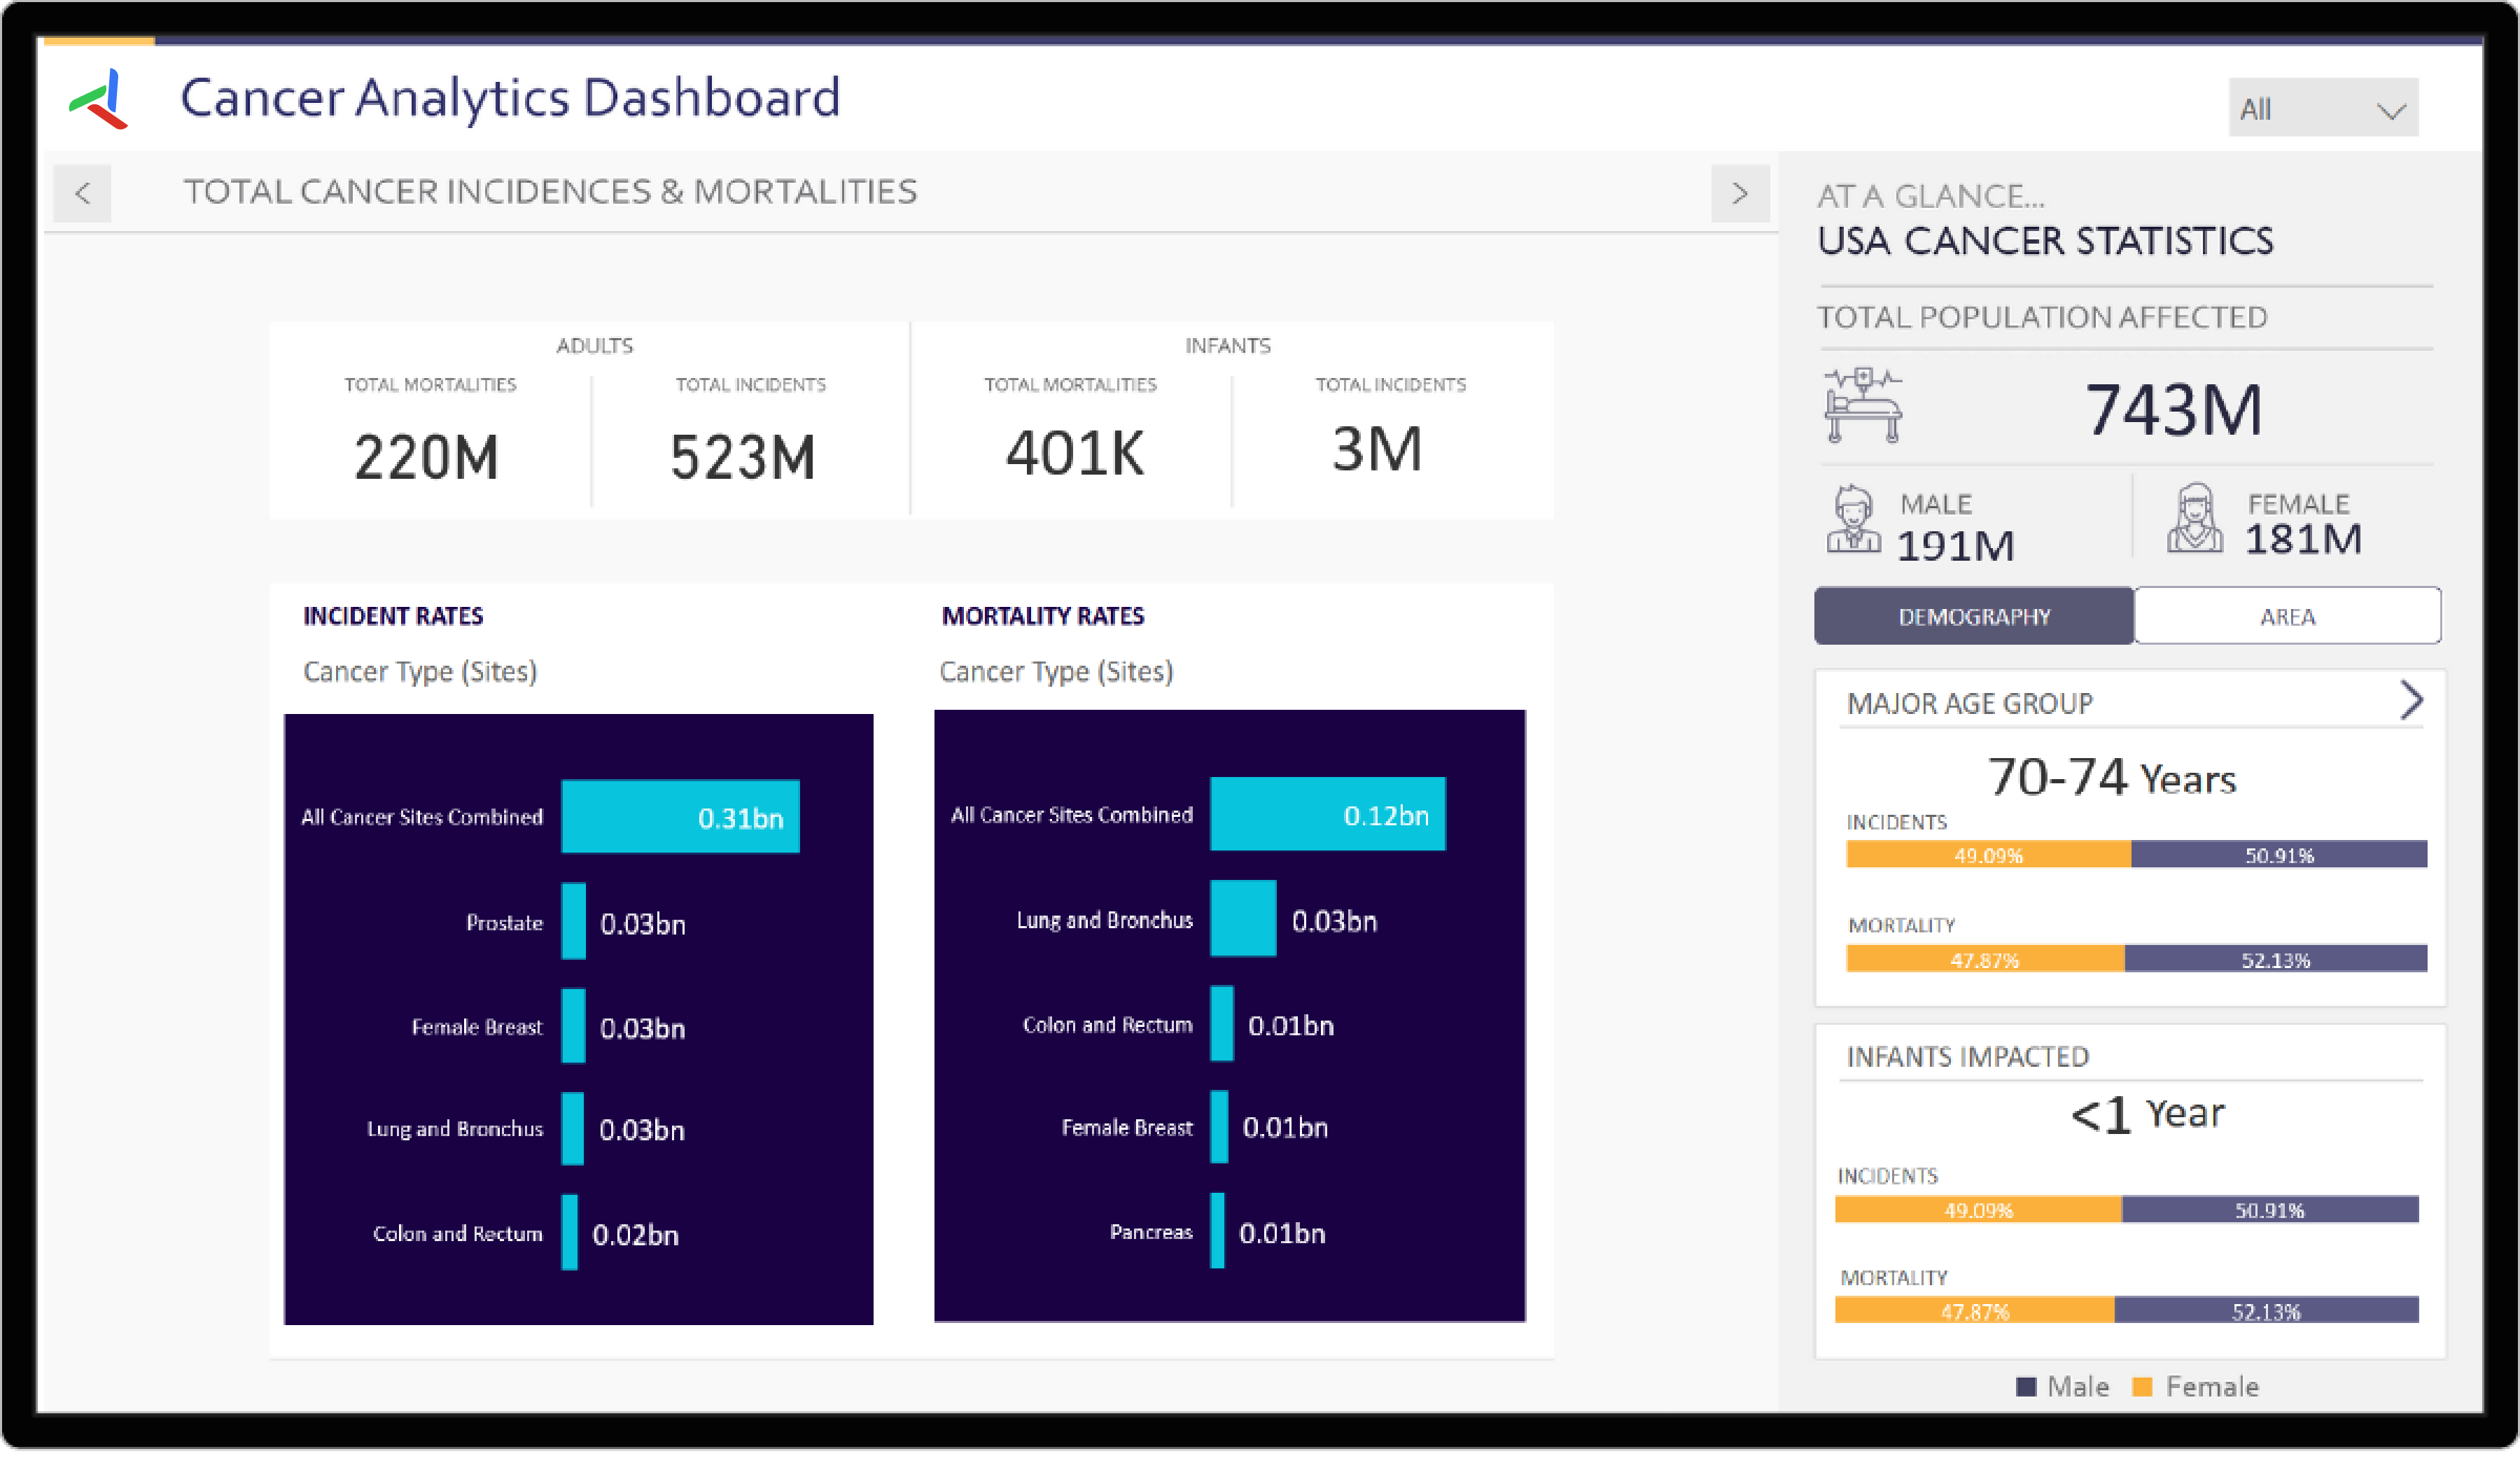
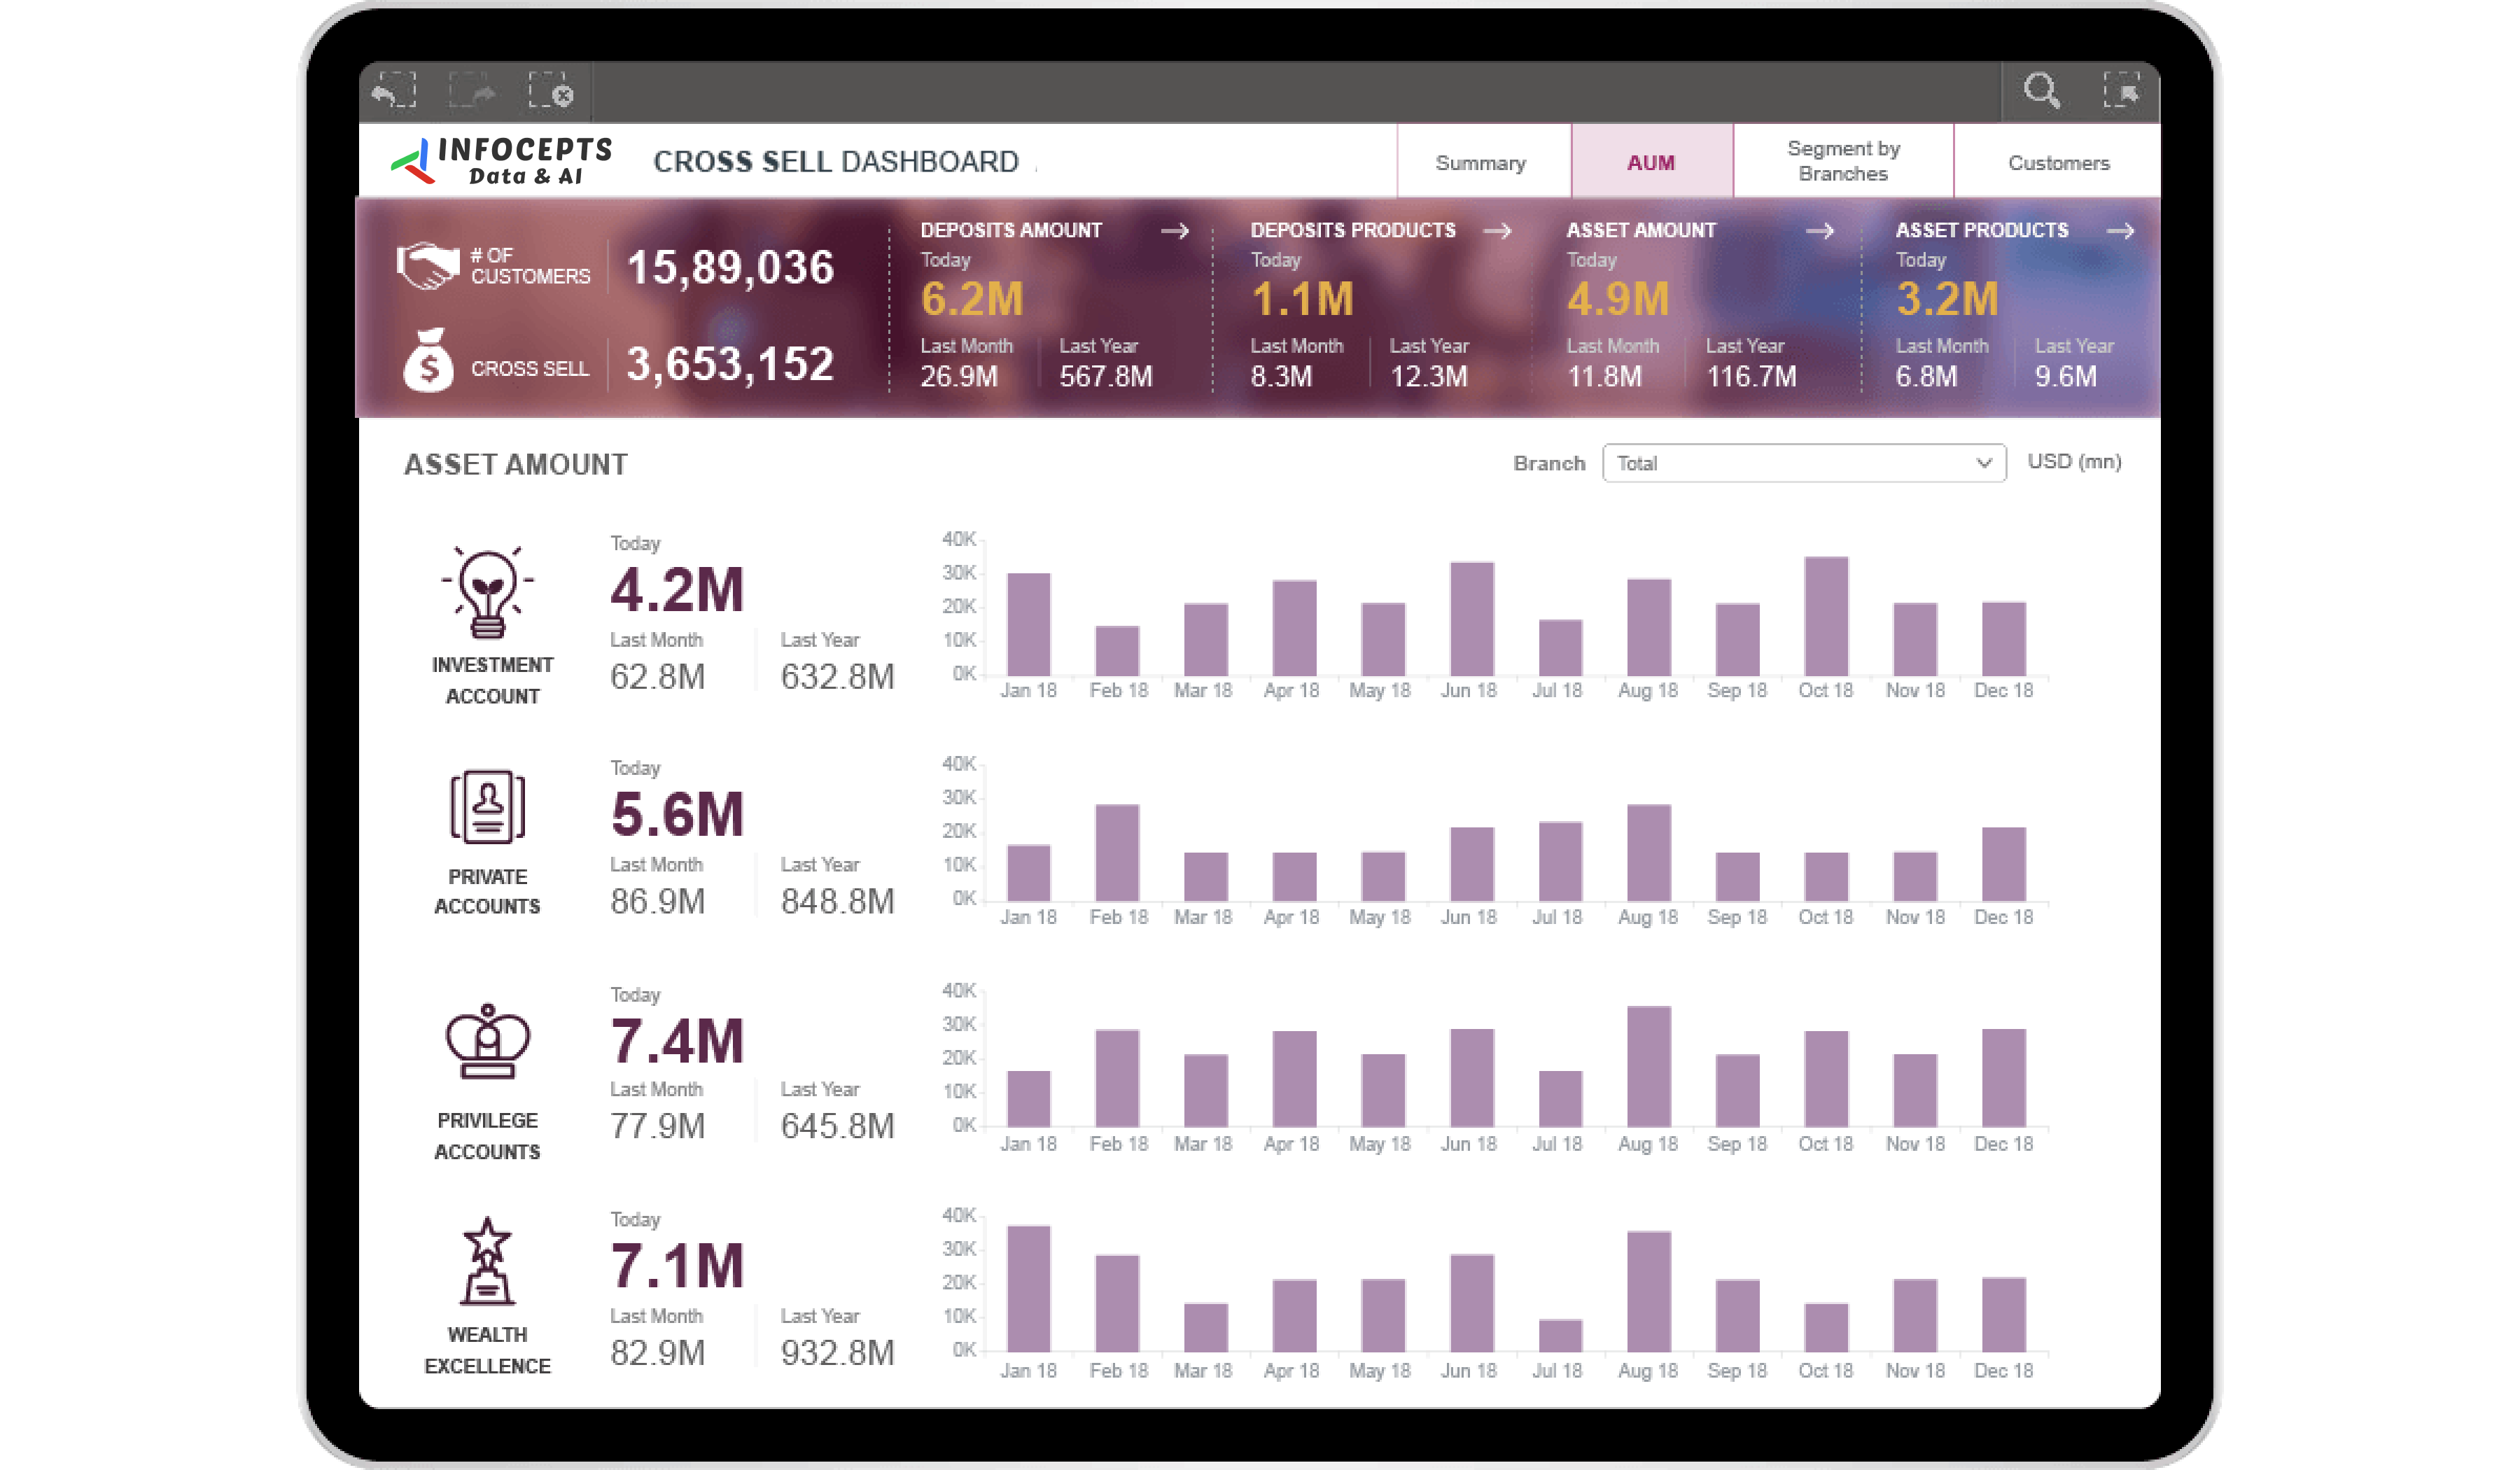
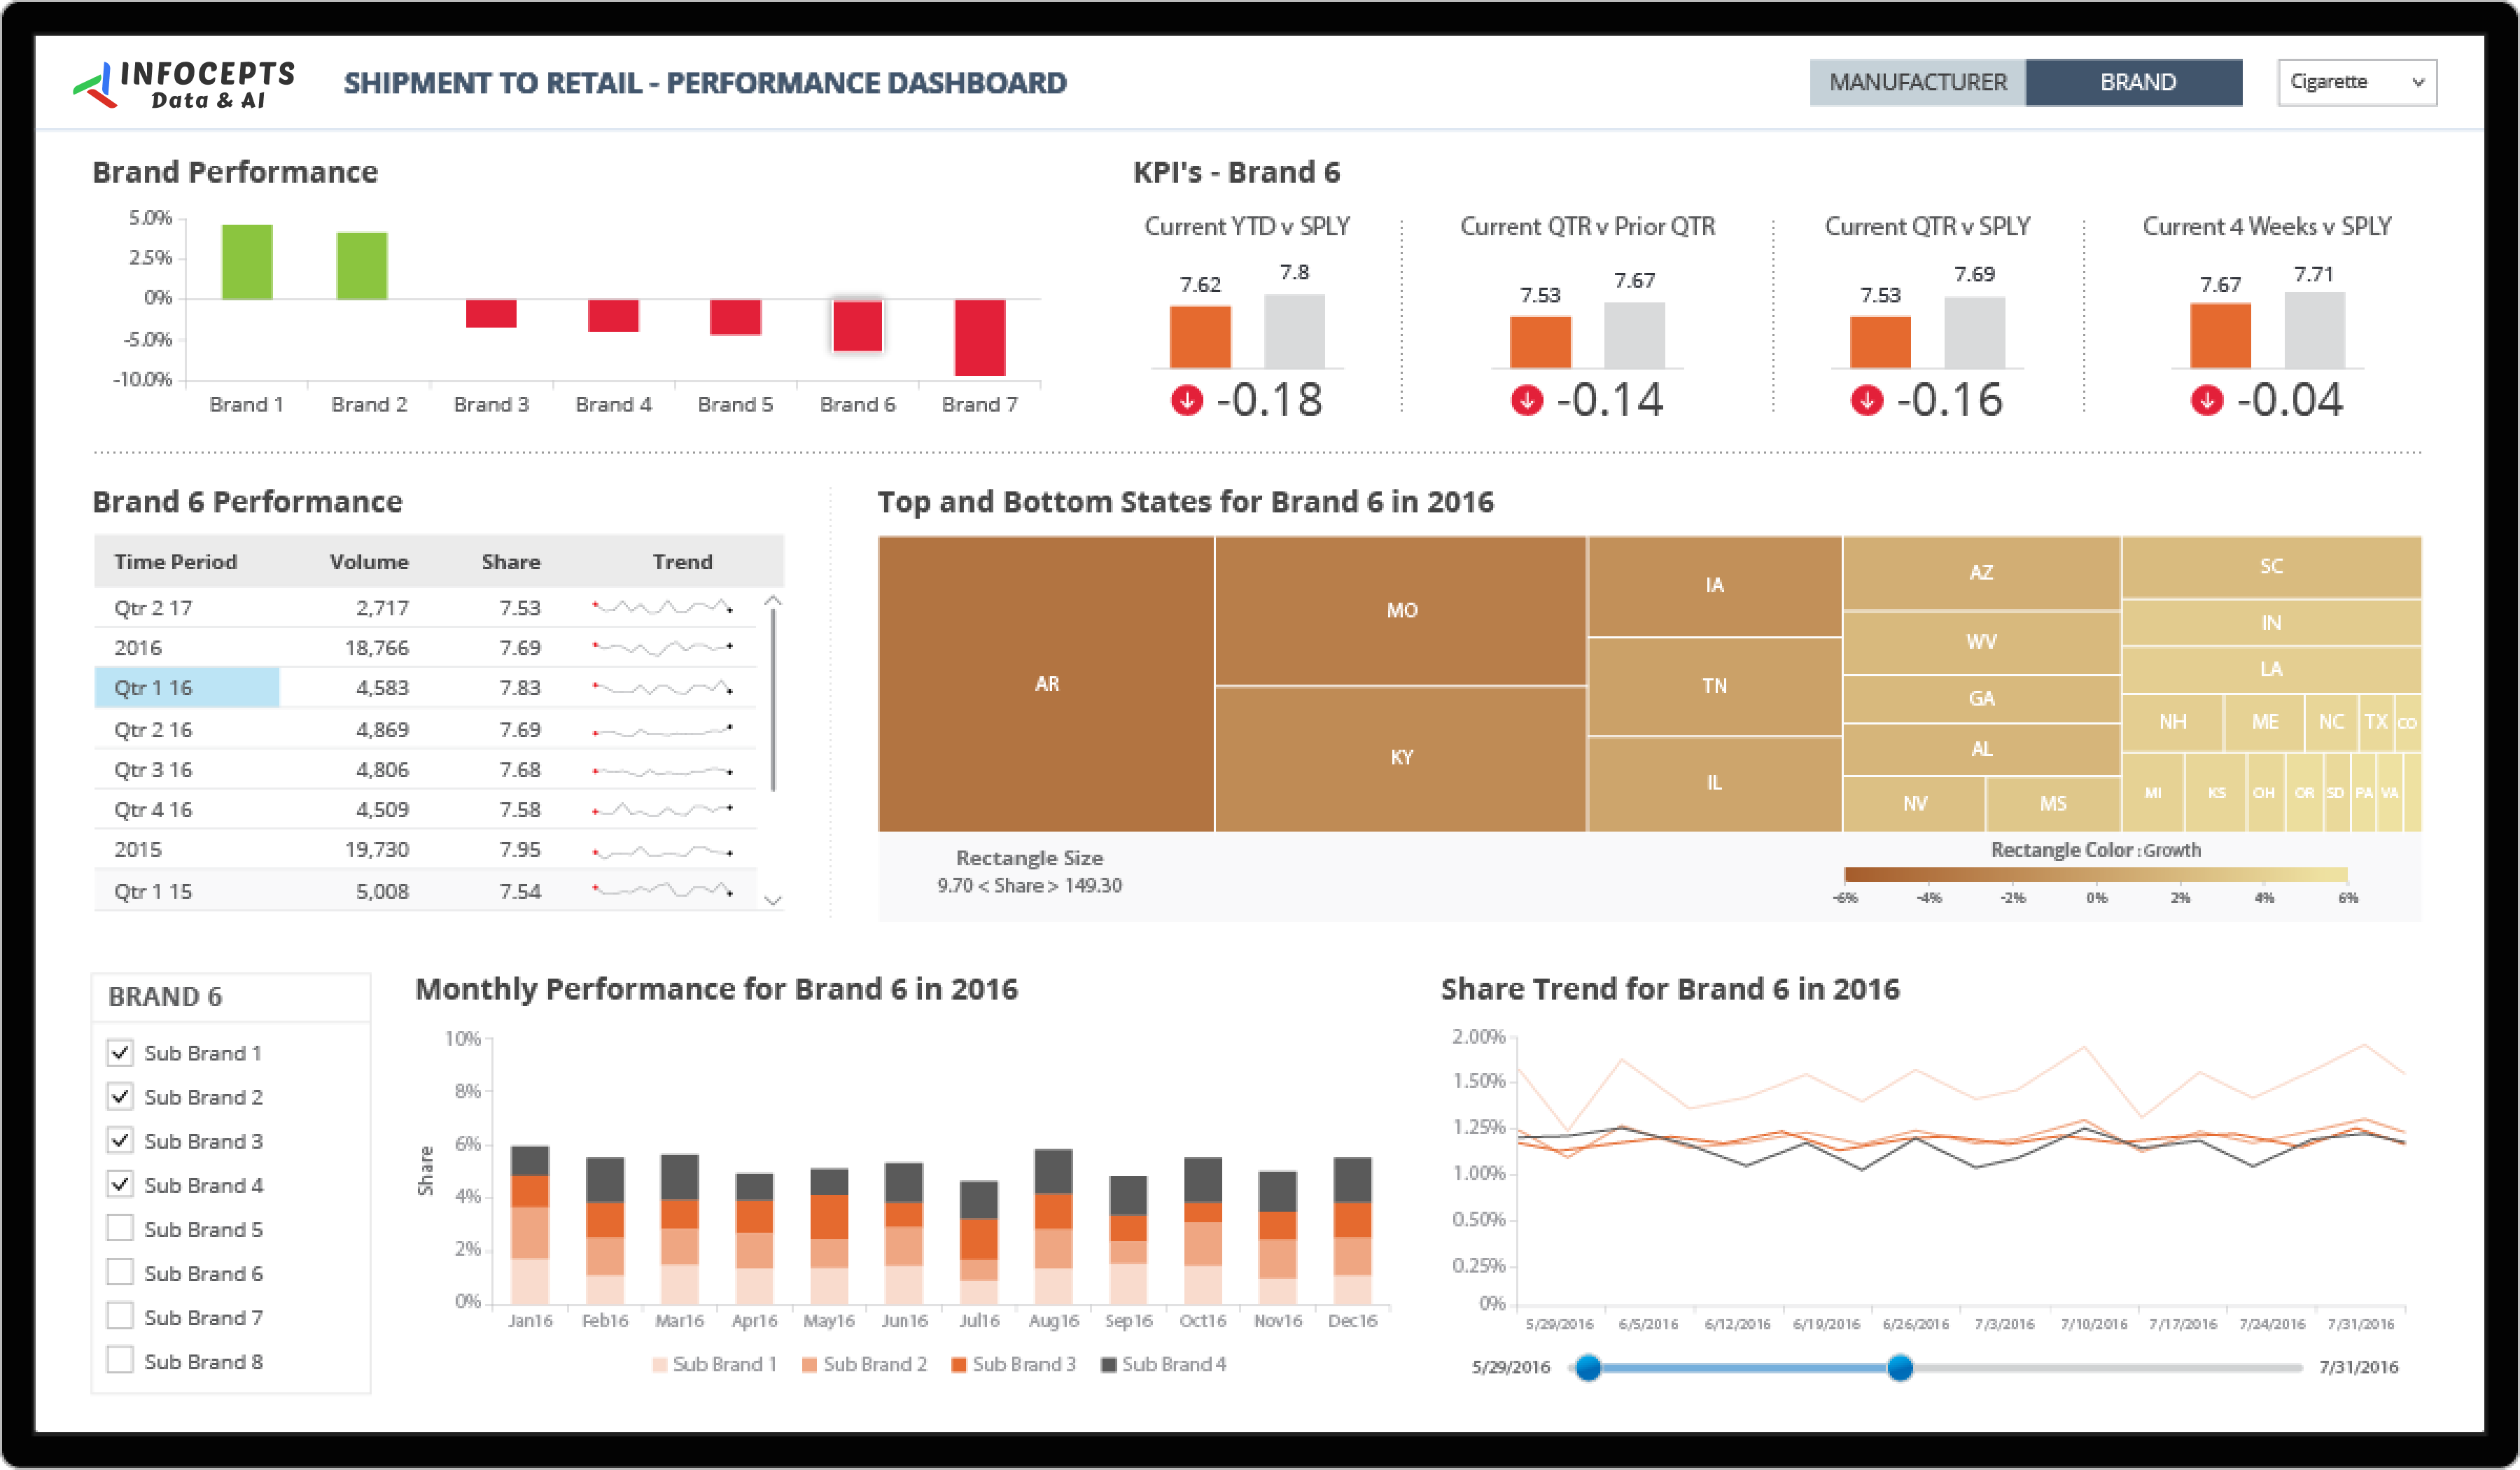
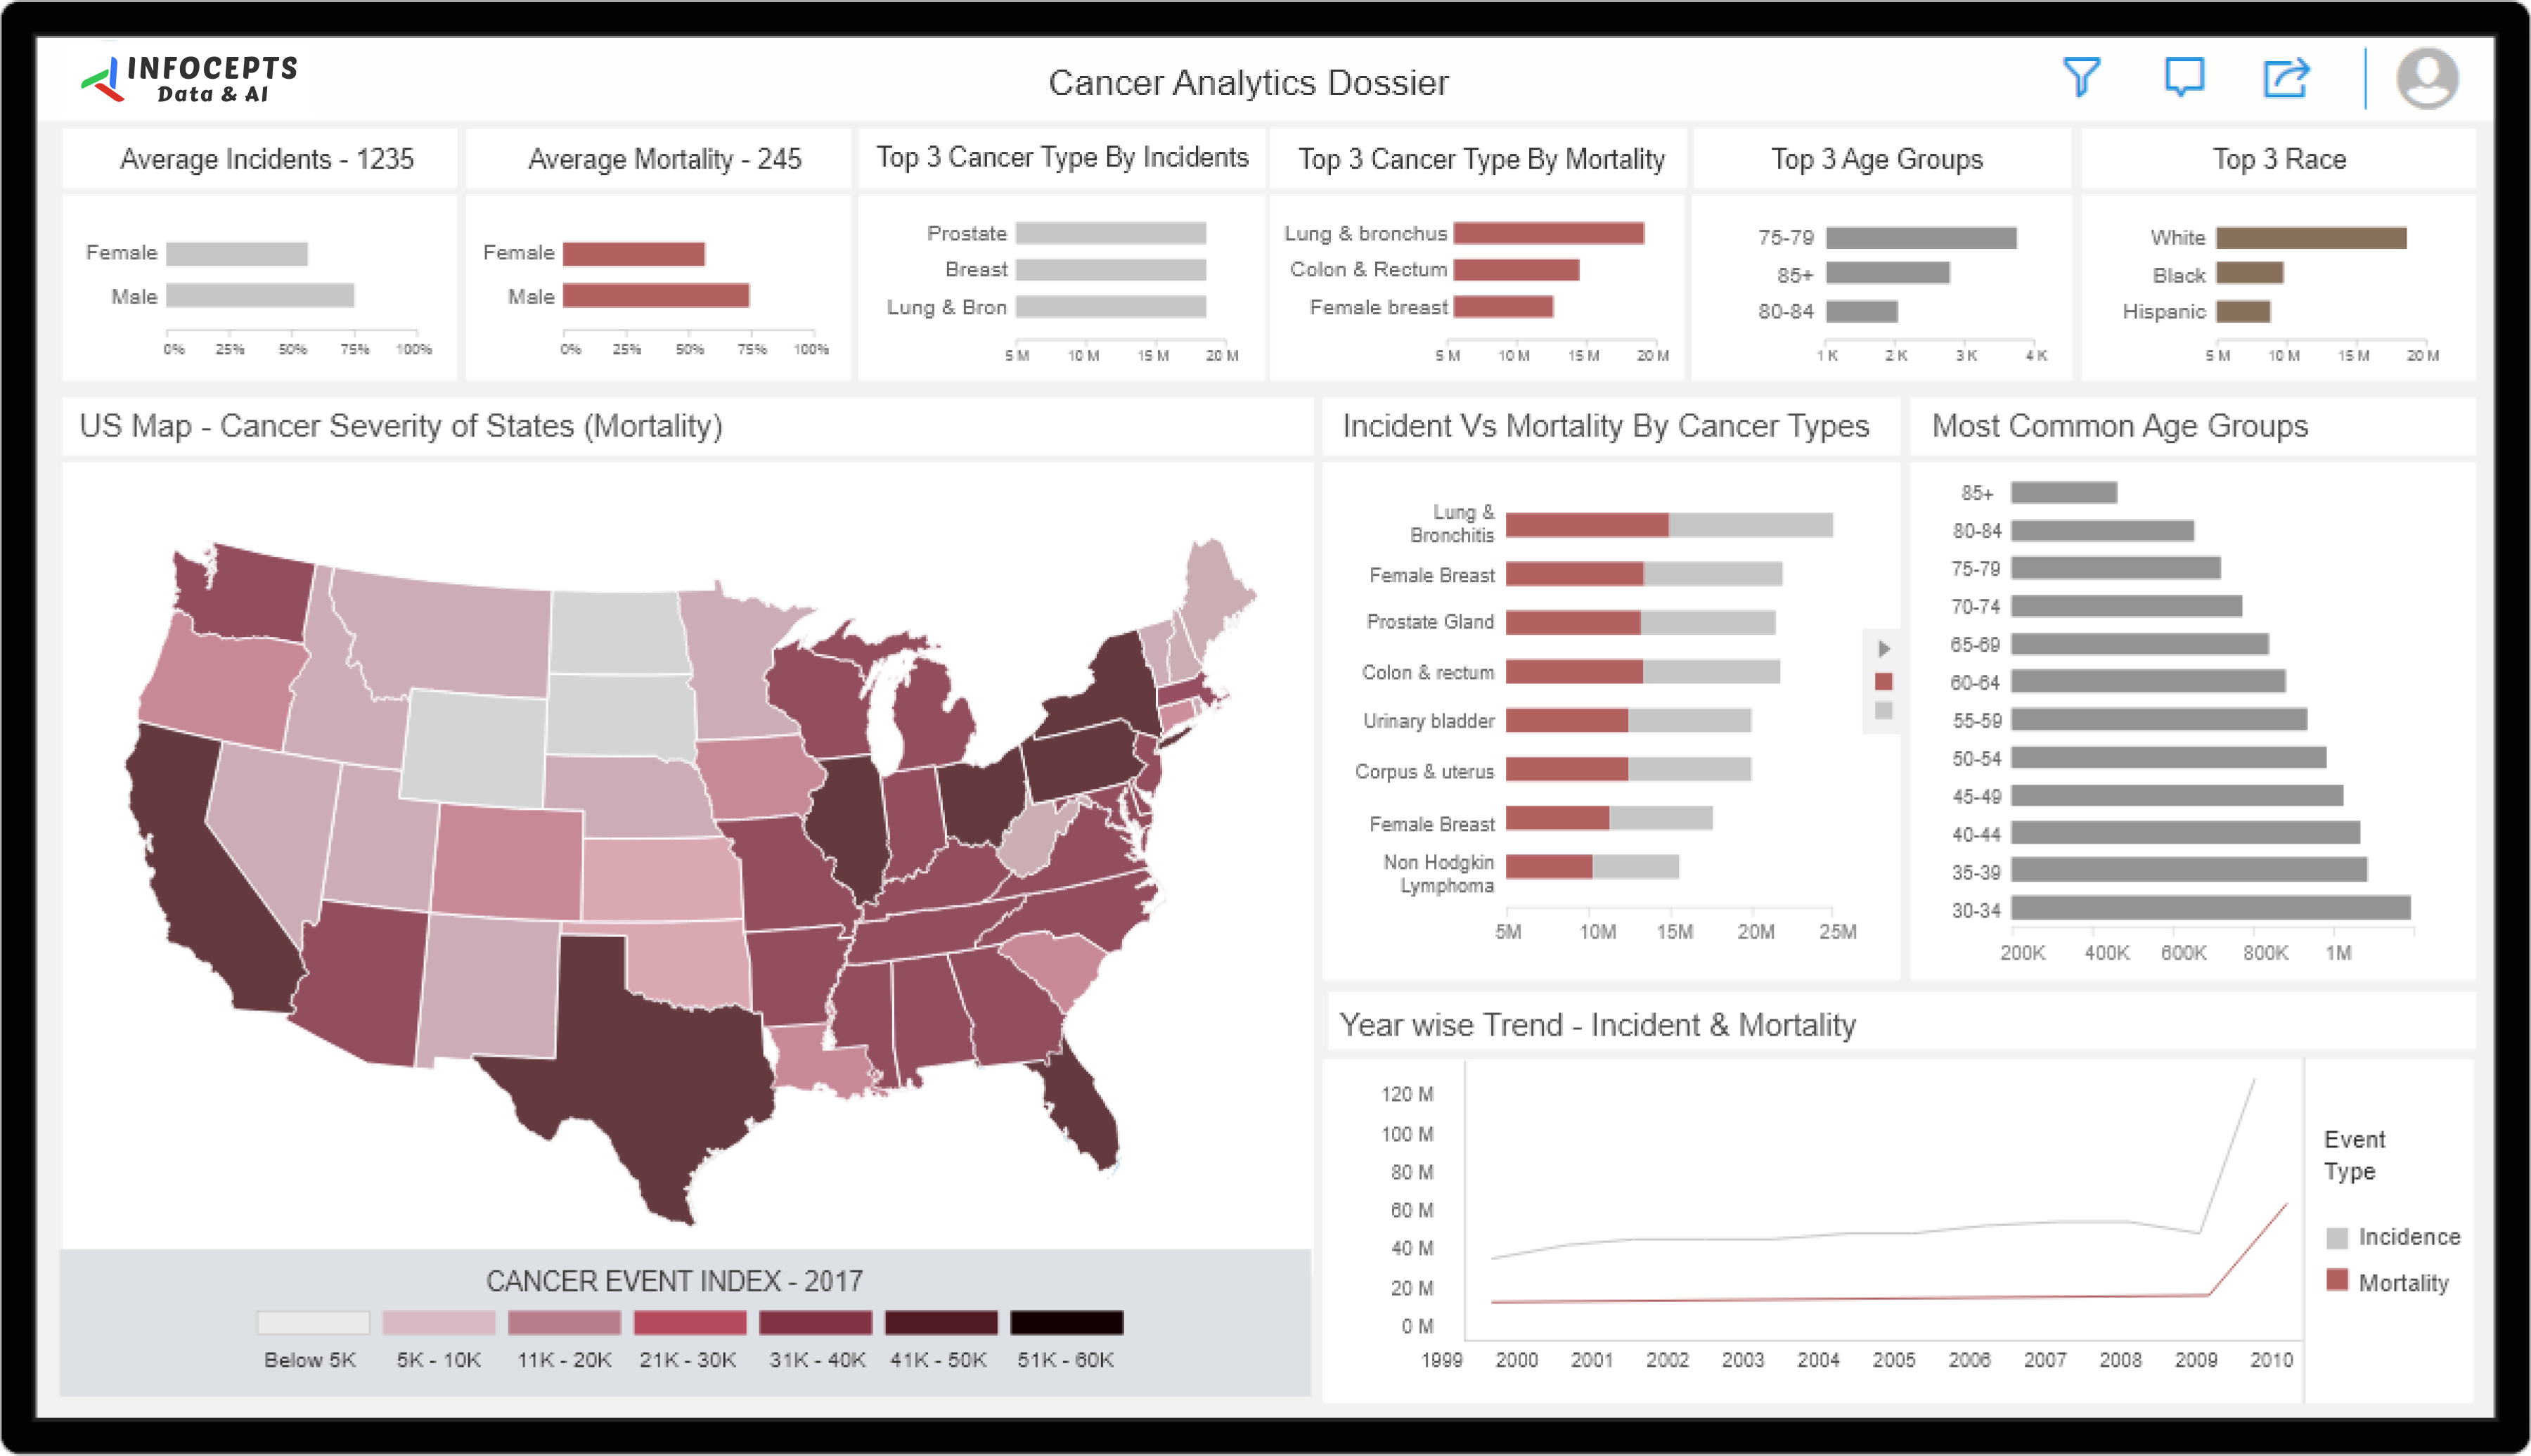
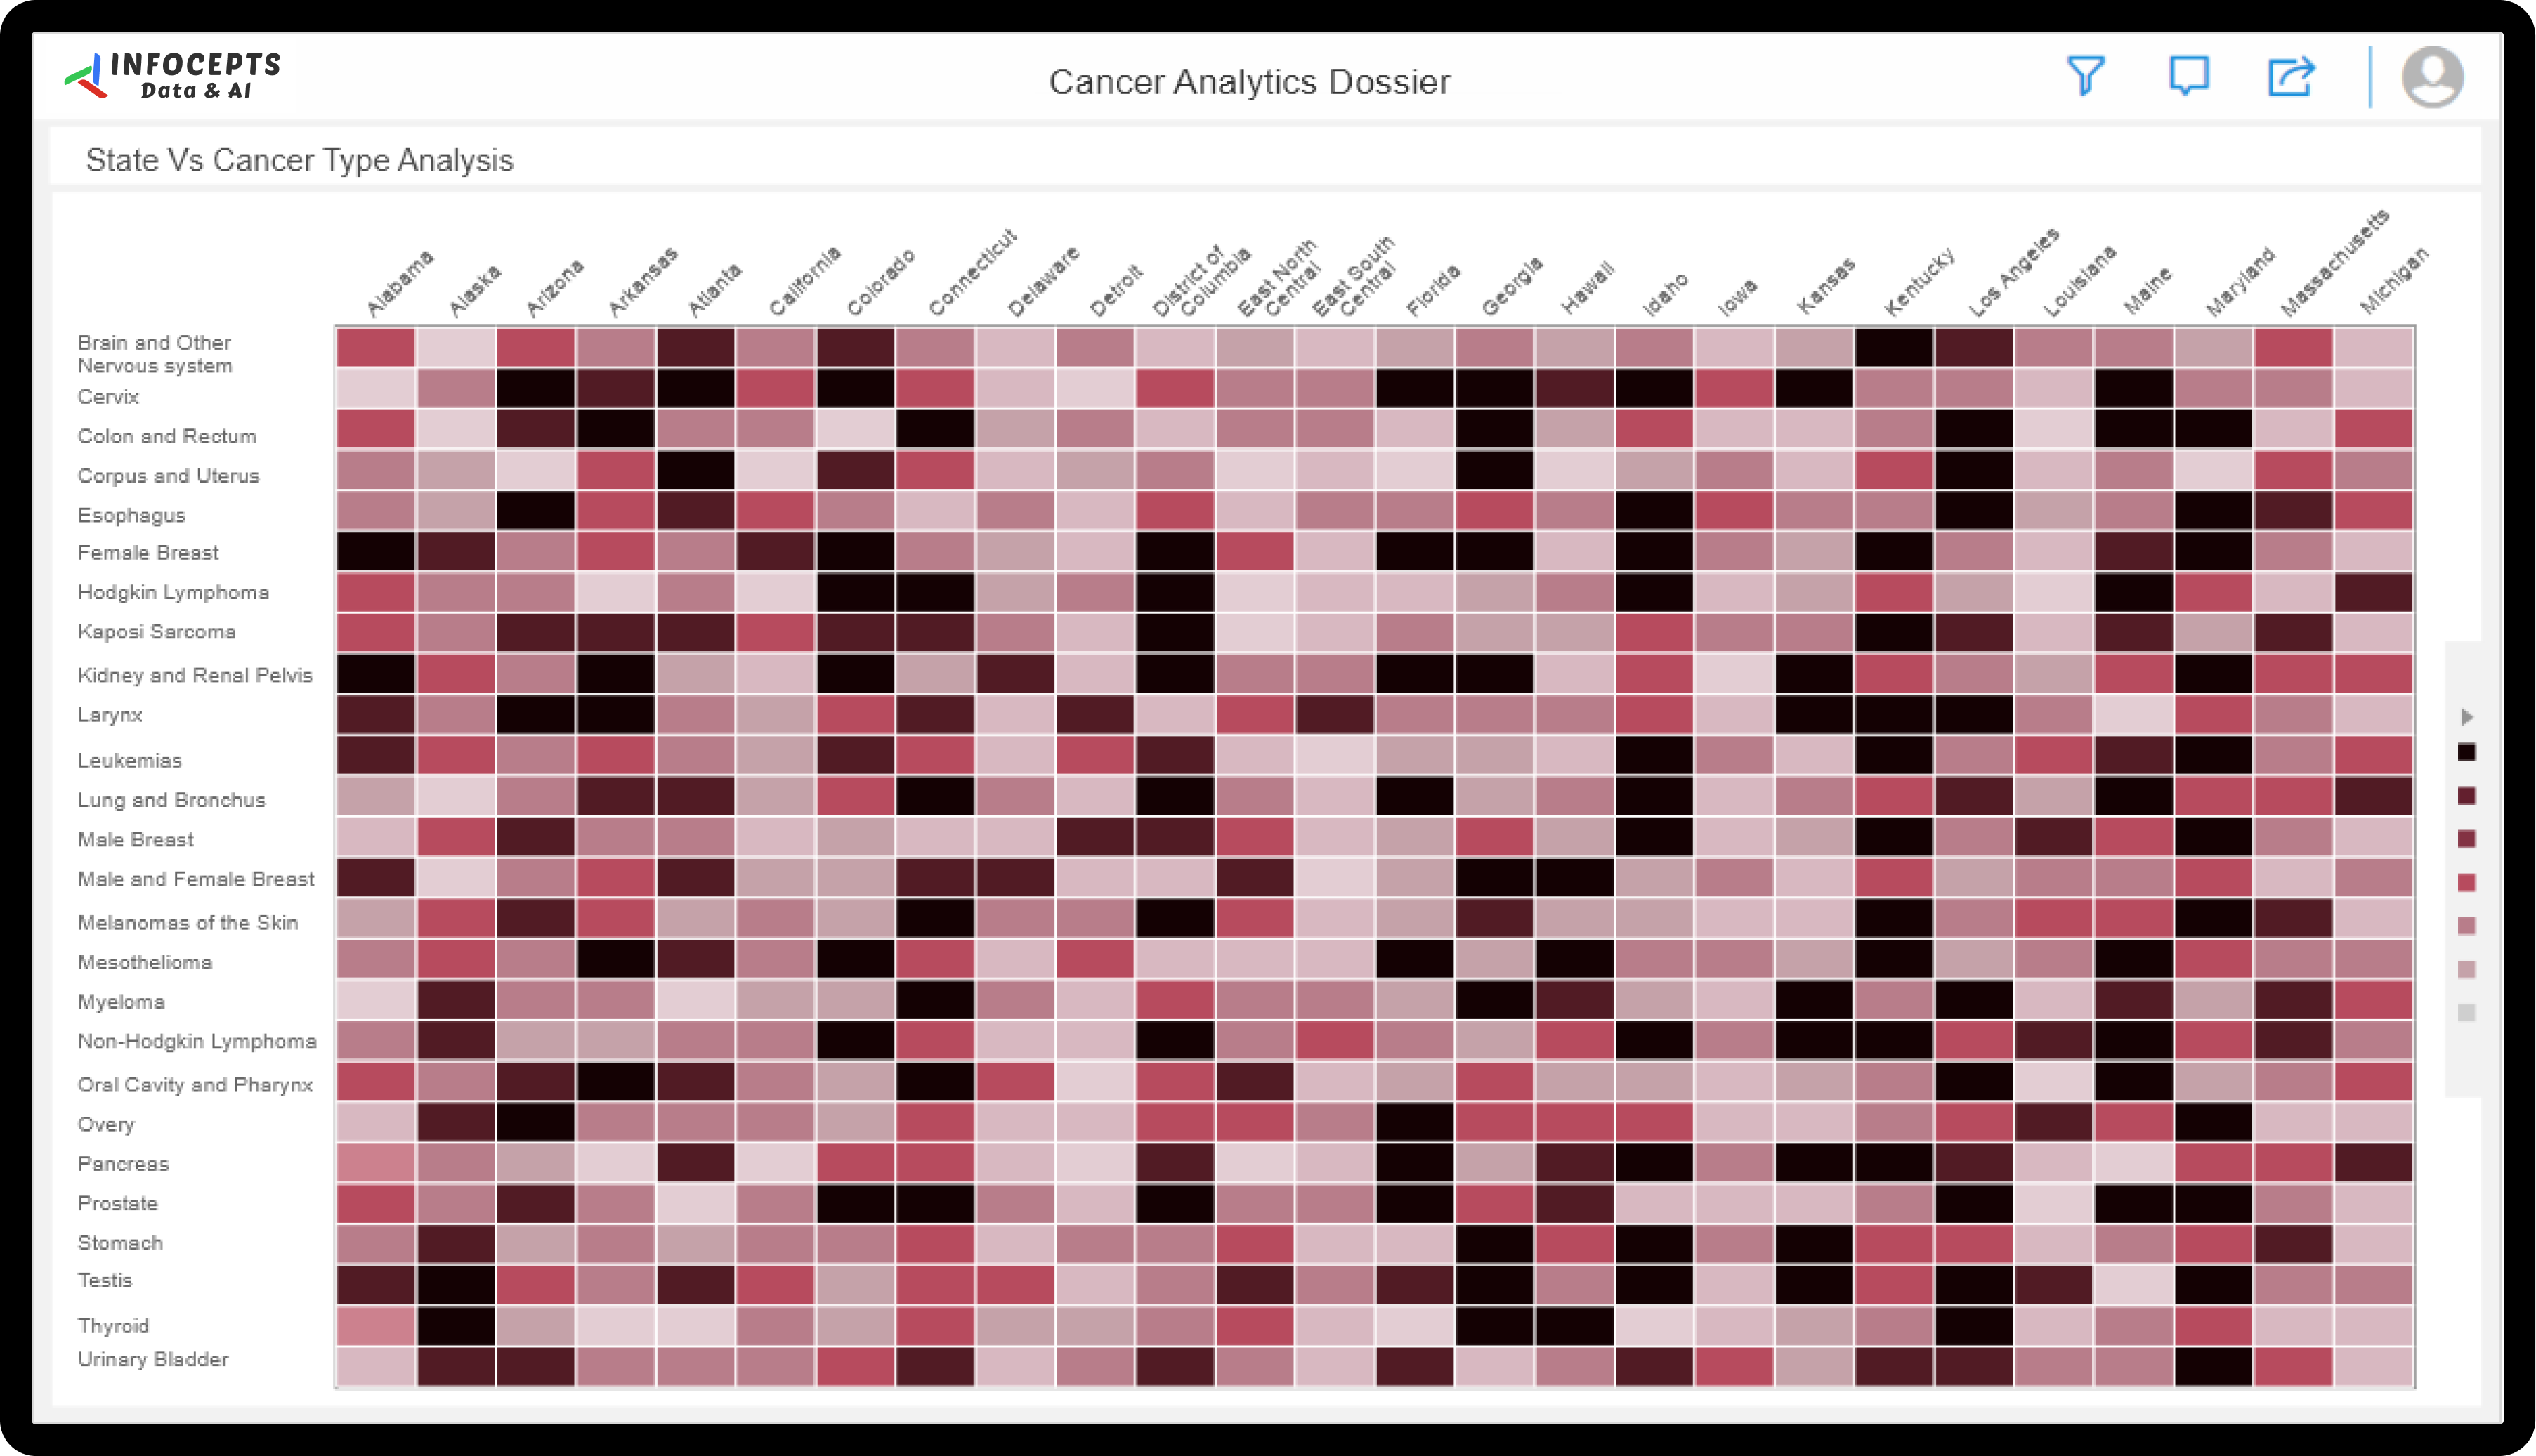
The Cancer Analytics App provides healthcare professionals, hospitals, pharma companies, and patients with critical insights on cancer incidence, prevalence, and distribution across the U.S. By analyzing cancer types, geographies, age, gender, and race, the app enables informed decision-making that can significantly improve health outcomes. This tool empowers stakeholders to improve infrastructure preparedness, reduce mortality rates, and enhance treatment accessibility.
Frequently asked questions
It analyzes cancer incidence, prevalence, and distribution by type, geography, age, gender, and race, giving healthcare professionals and pharma companies a population-level view instead of scattered regional reports.
Seeing where prevalence is rising by geography lets hospitals and health systems plan treatment capacity ahead of demand rather than after facilities are already strained.
Healthcare professionals, hospitals, pharma companies, and public health stakeholders making decisions about treatment access and resource allocation.
No. It operates at the population level, tracking incidence and prevalence trends rather than individual patient records.
Cancer incidence often varies meaningfully by age, gender, and race; breaking data down this way surfaces disparities a single national average would hide.
By structuring public health and demographic data into a BI platform through Business Analytics services, drawing on Life Sciences industry work.

 Pranali Lanjewar