



31%
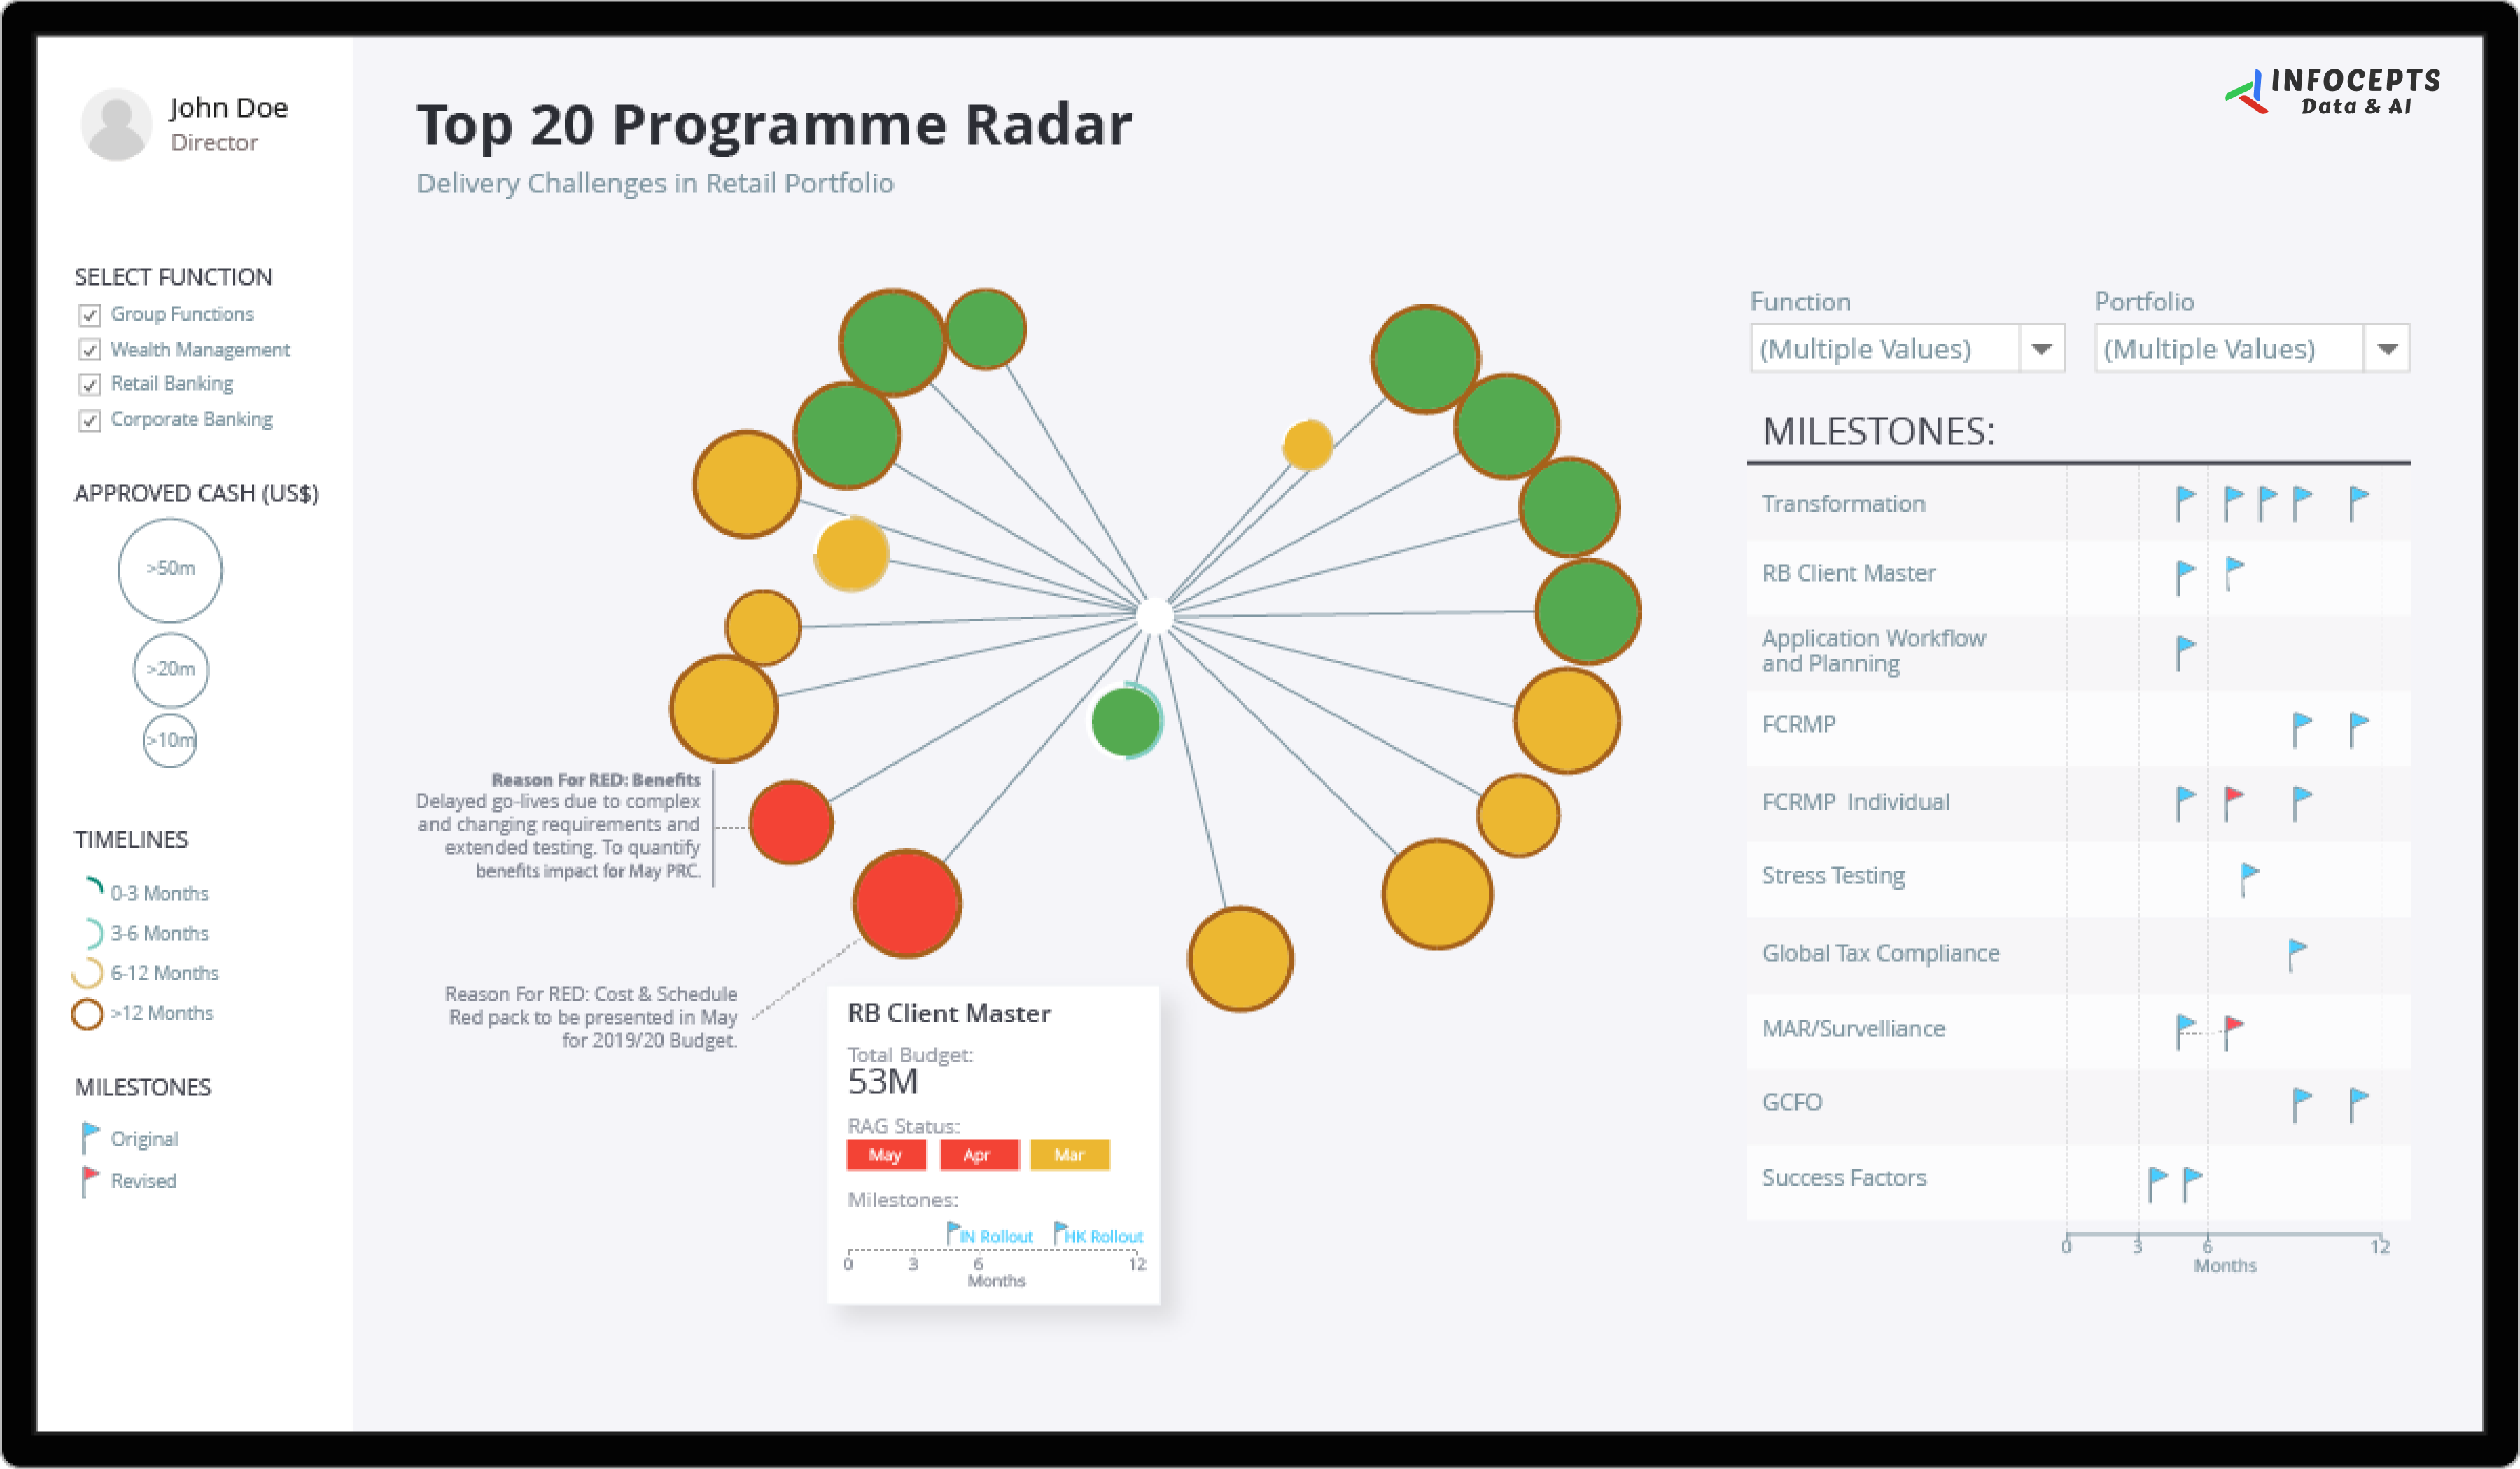
Reduced overhead budget variance
53%
Rate of return on investment
36%
Profit Increase
42%
Increase in capital income
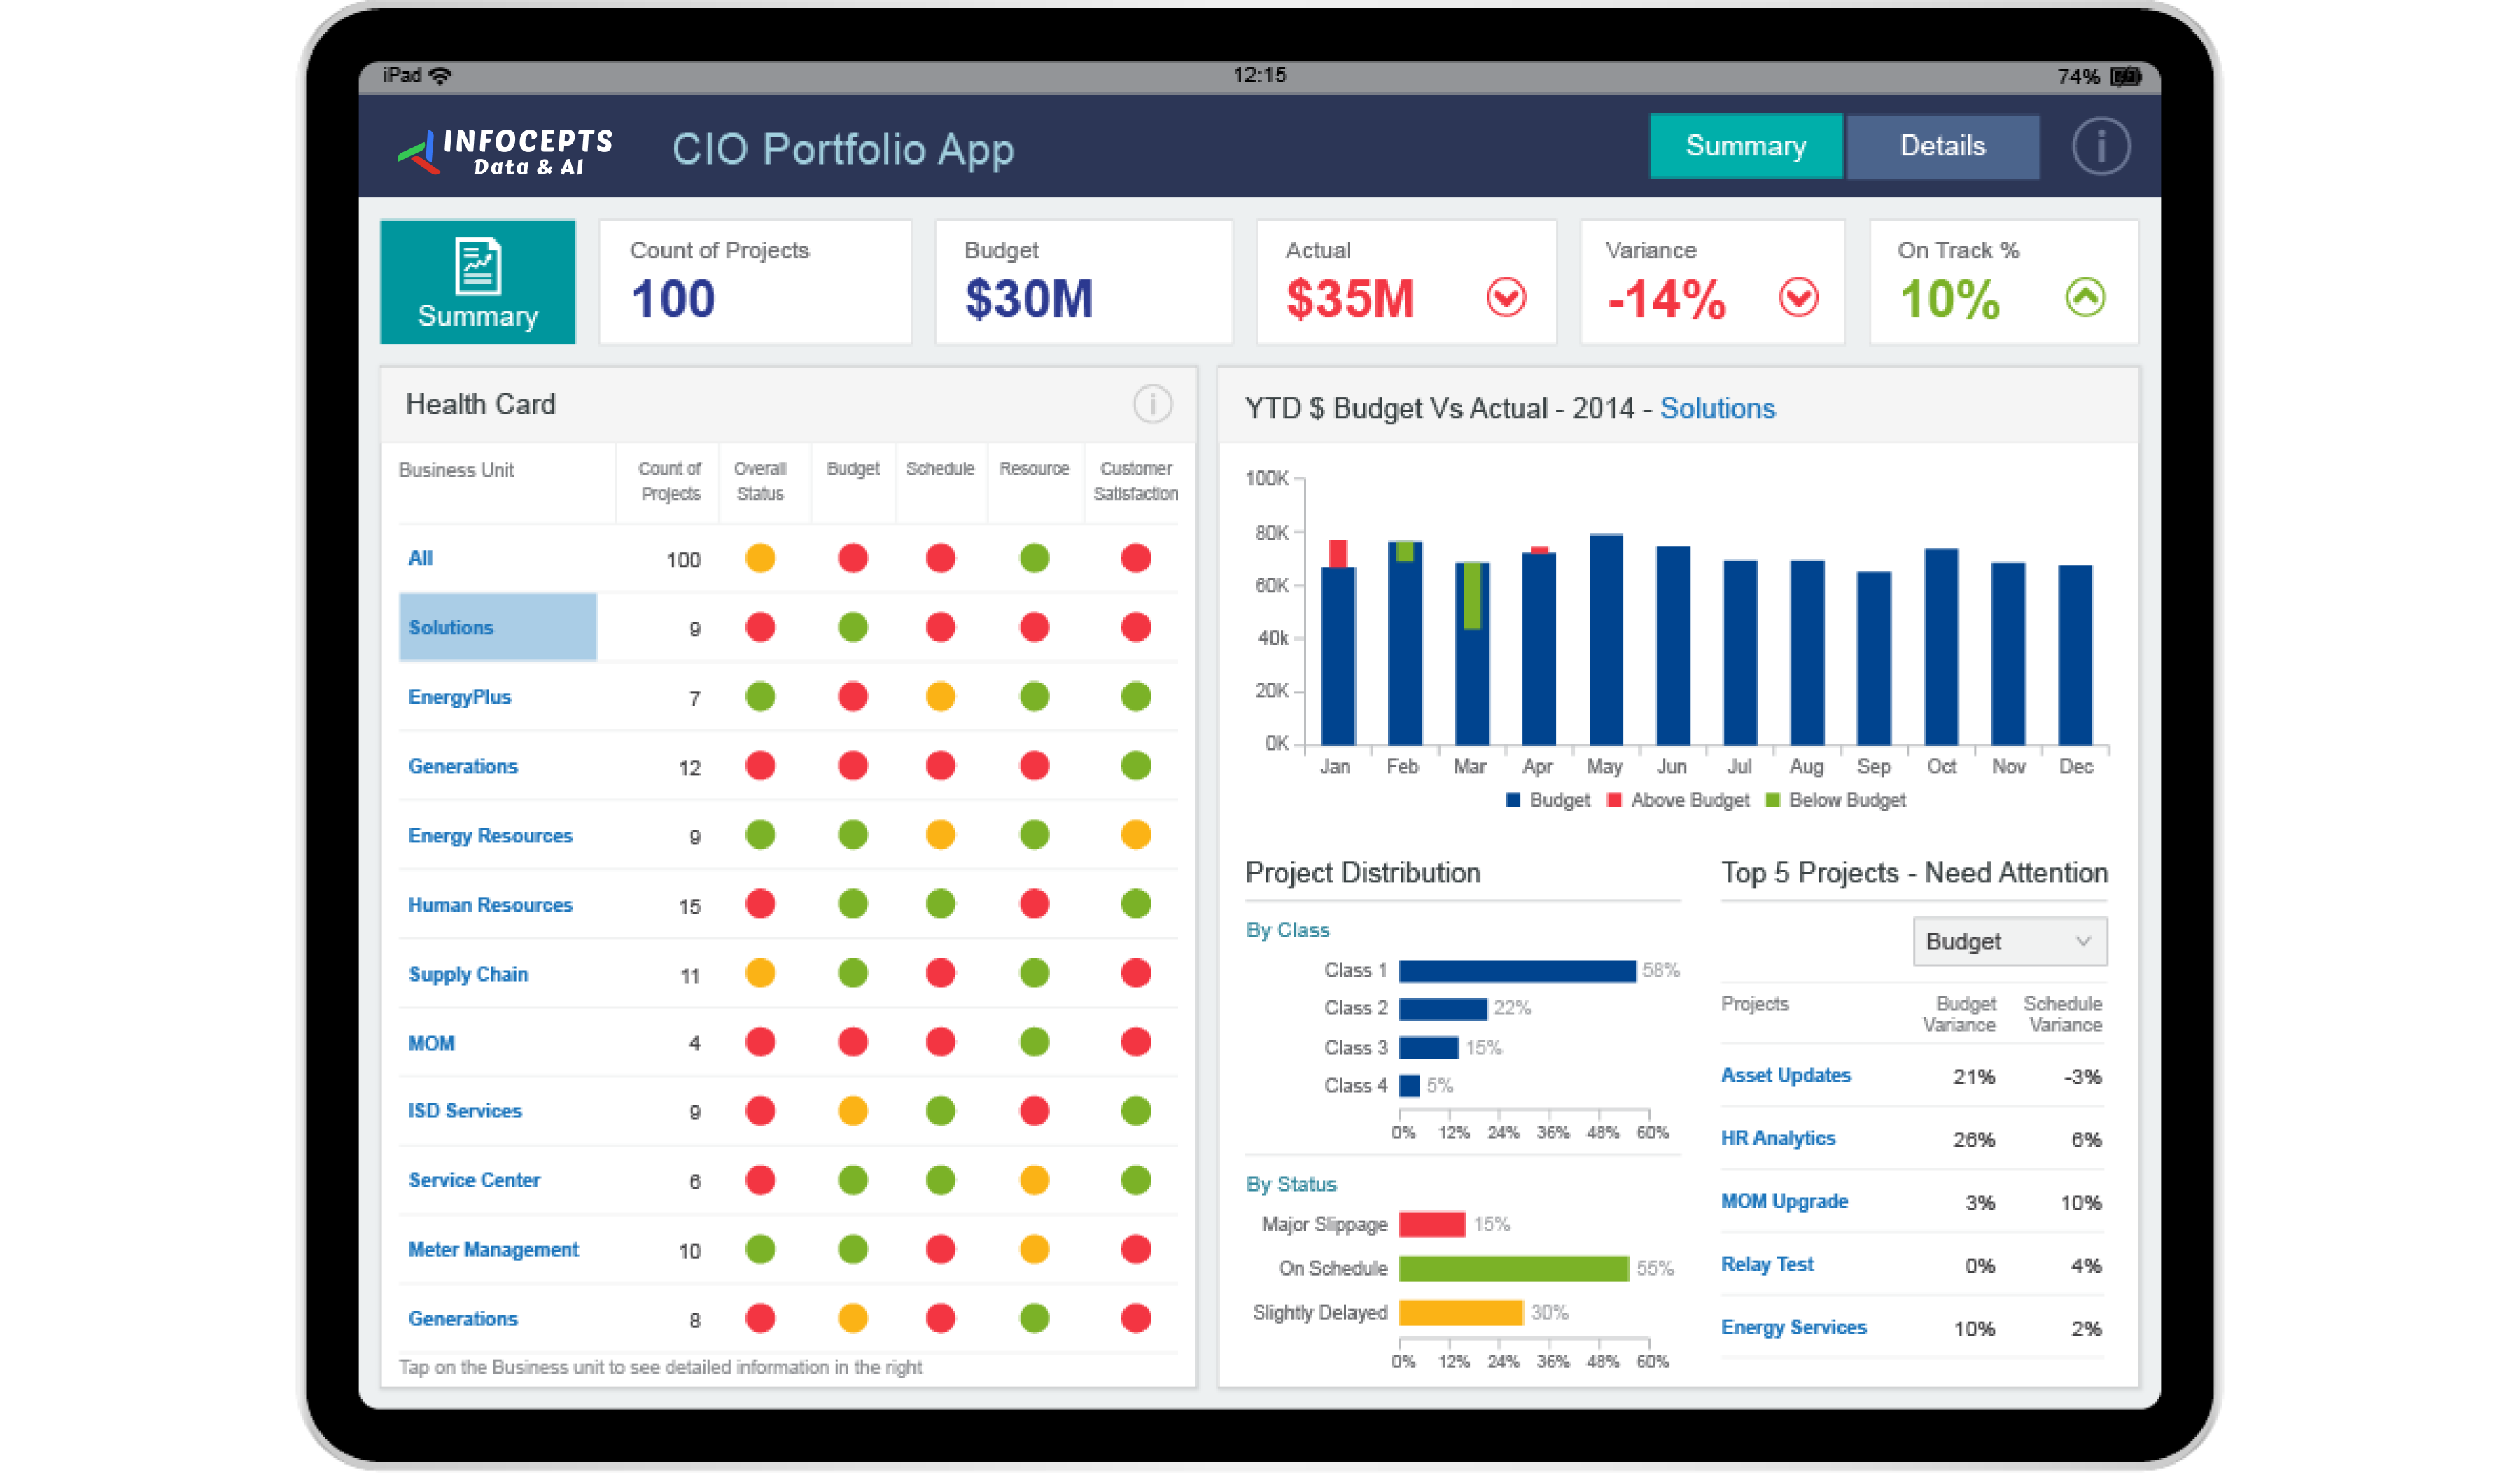
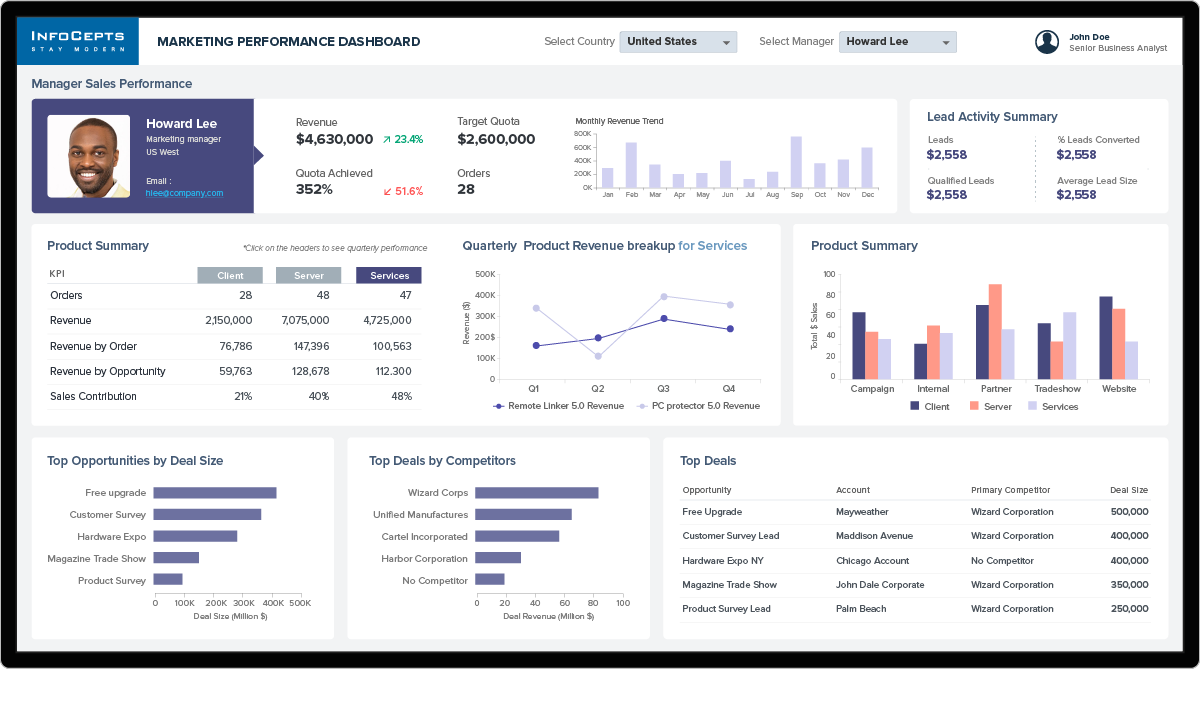
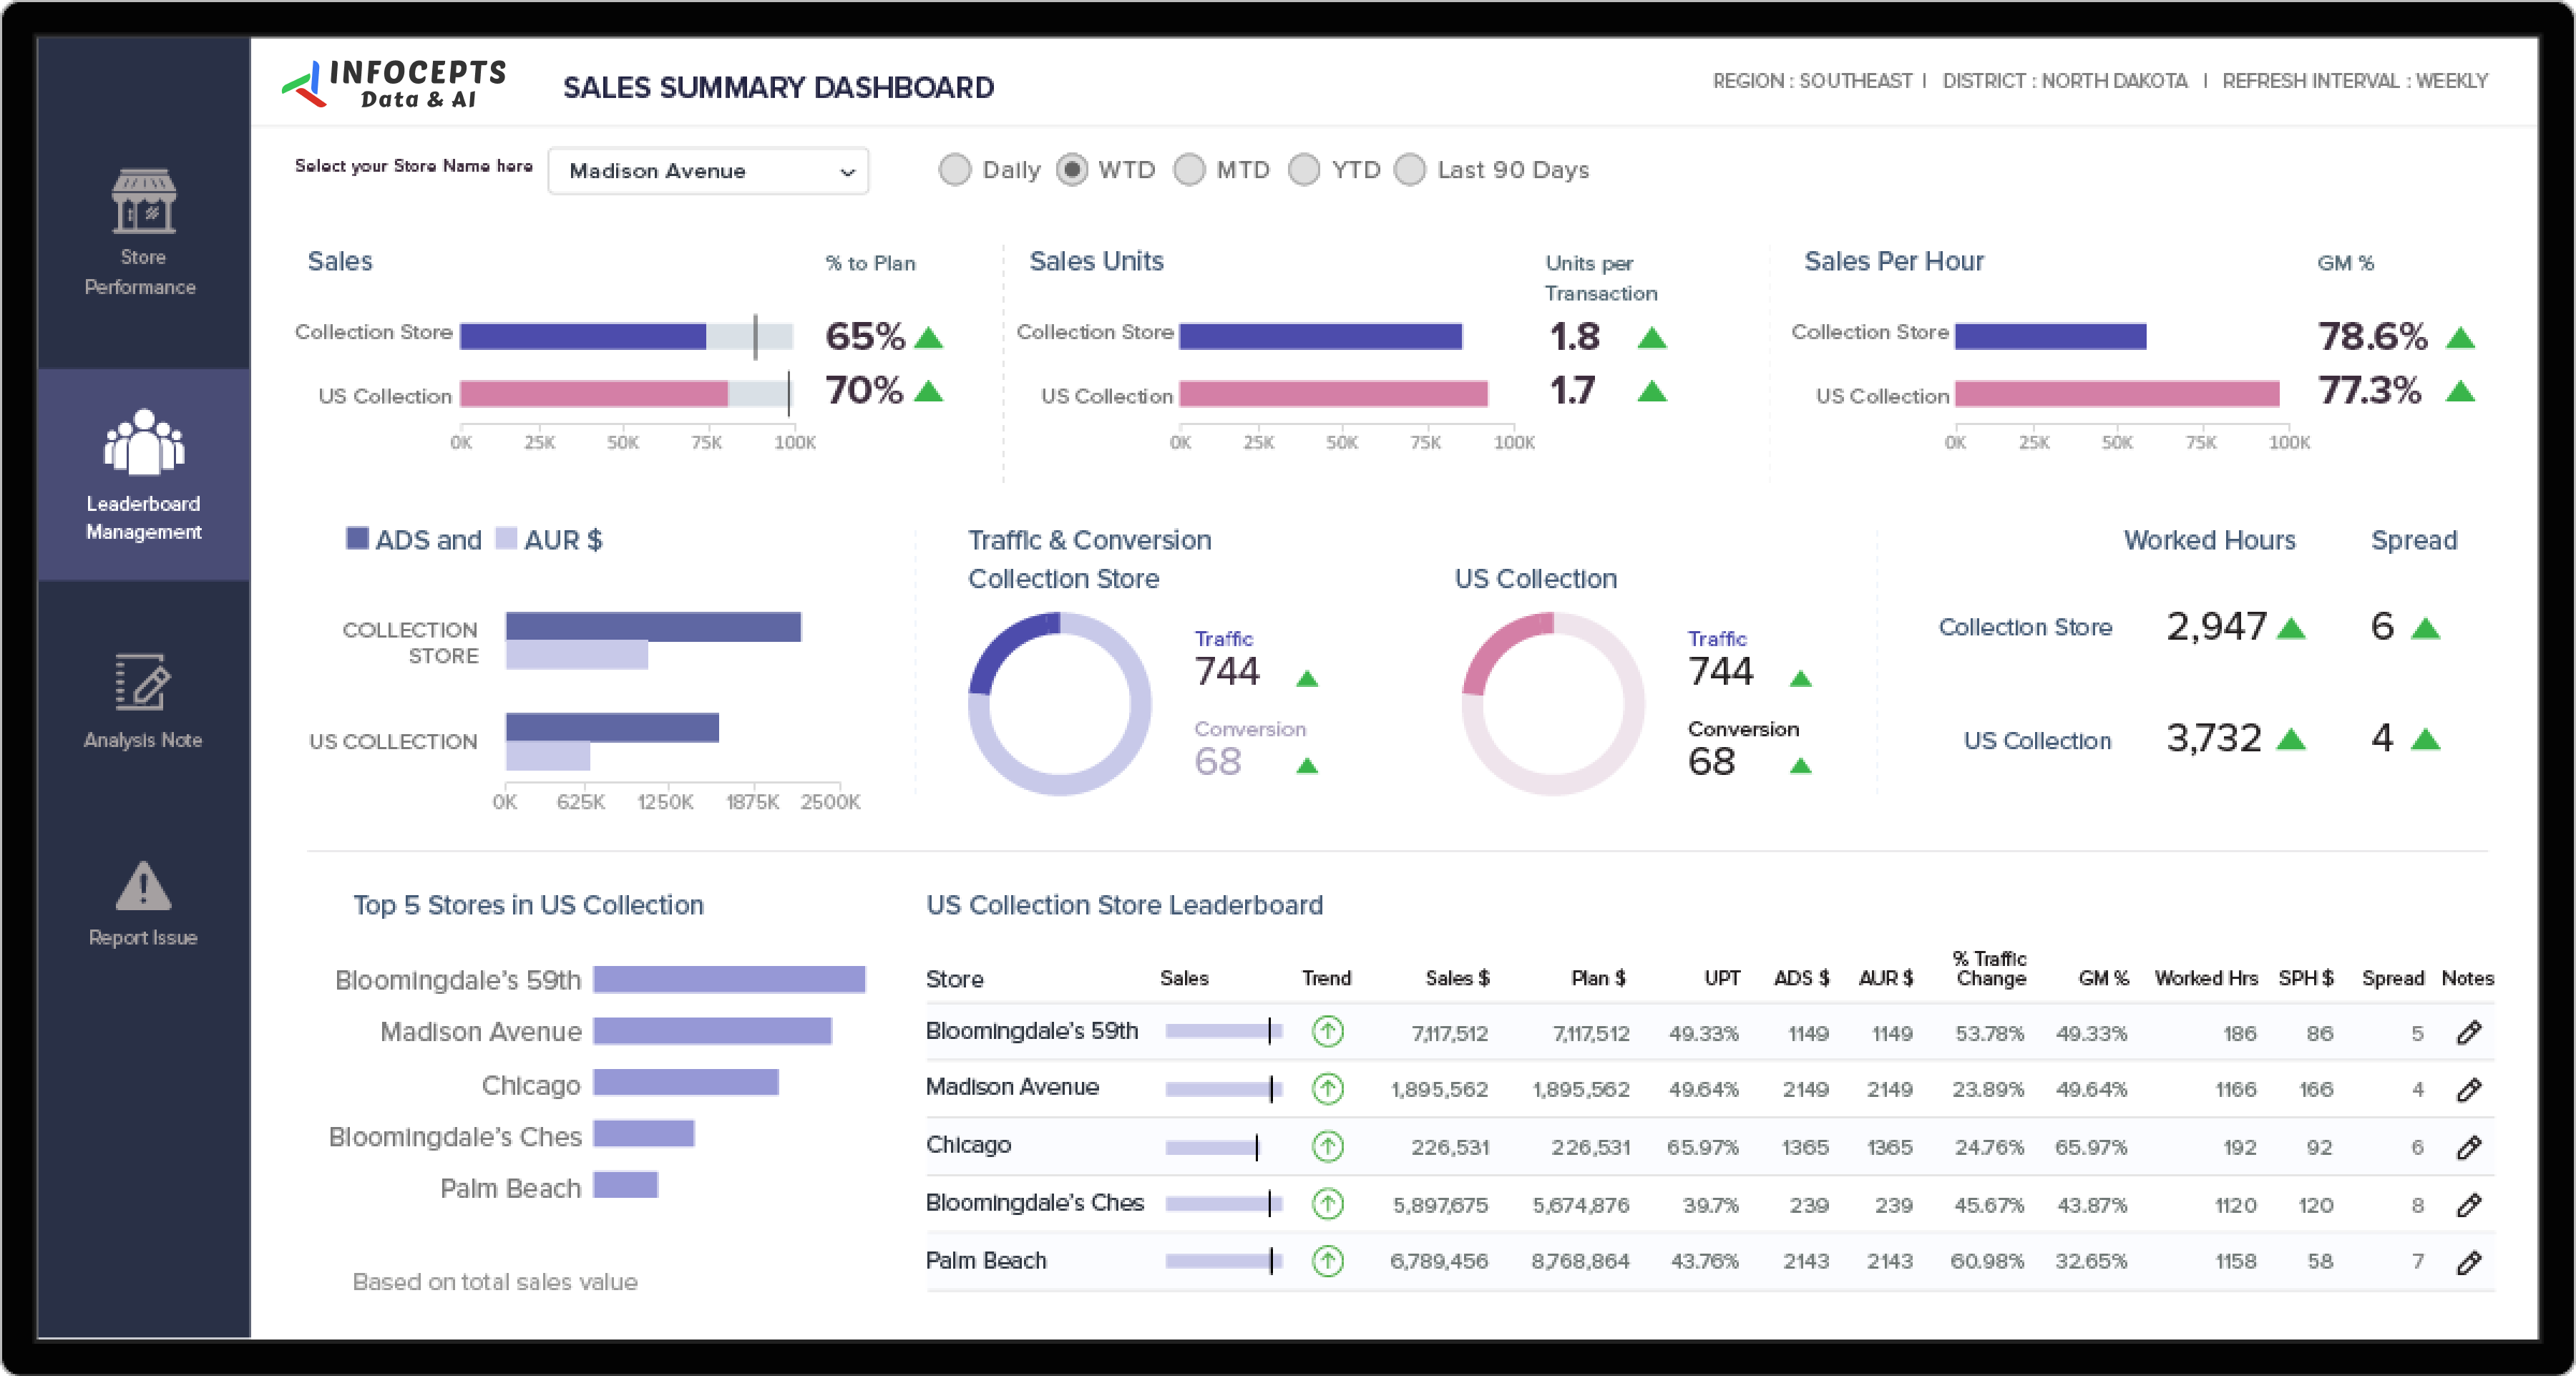
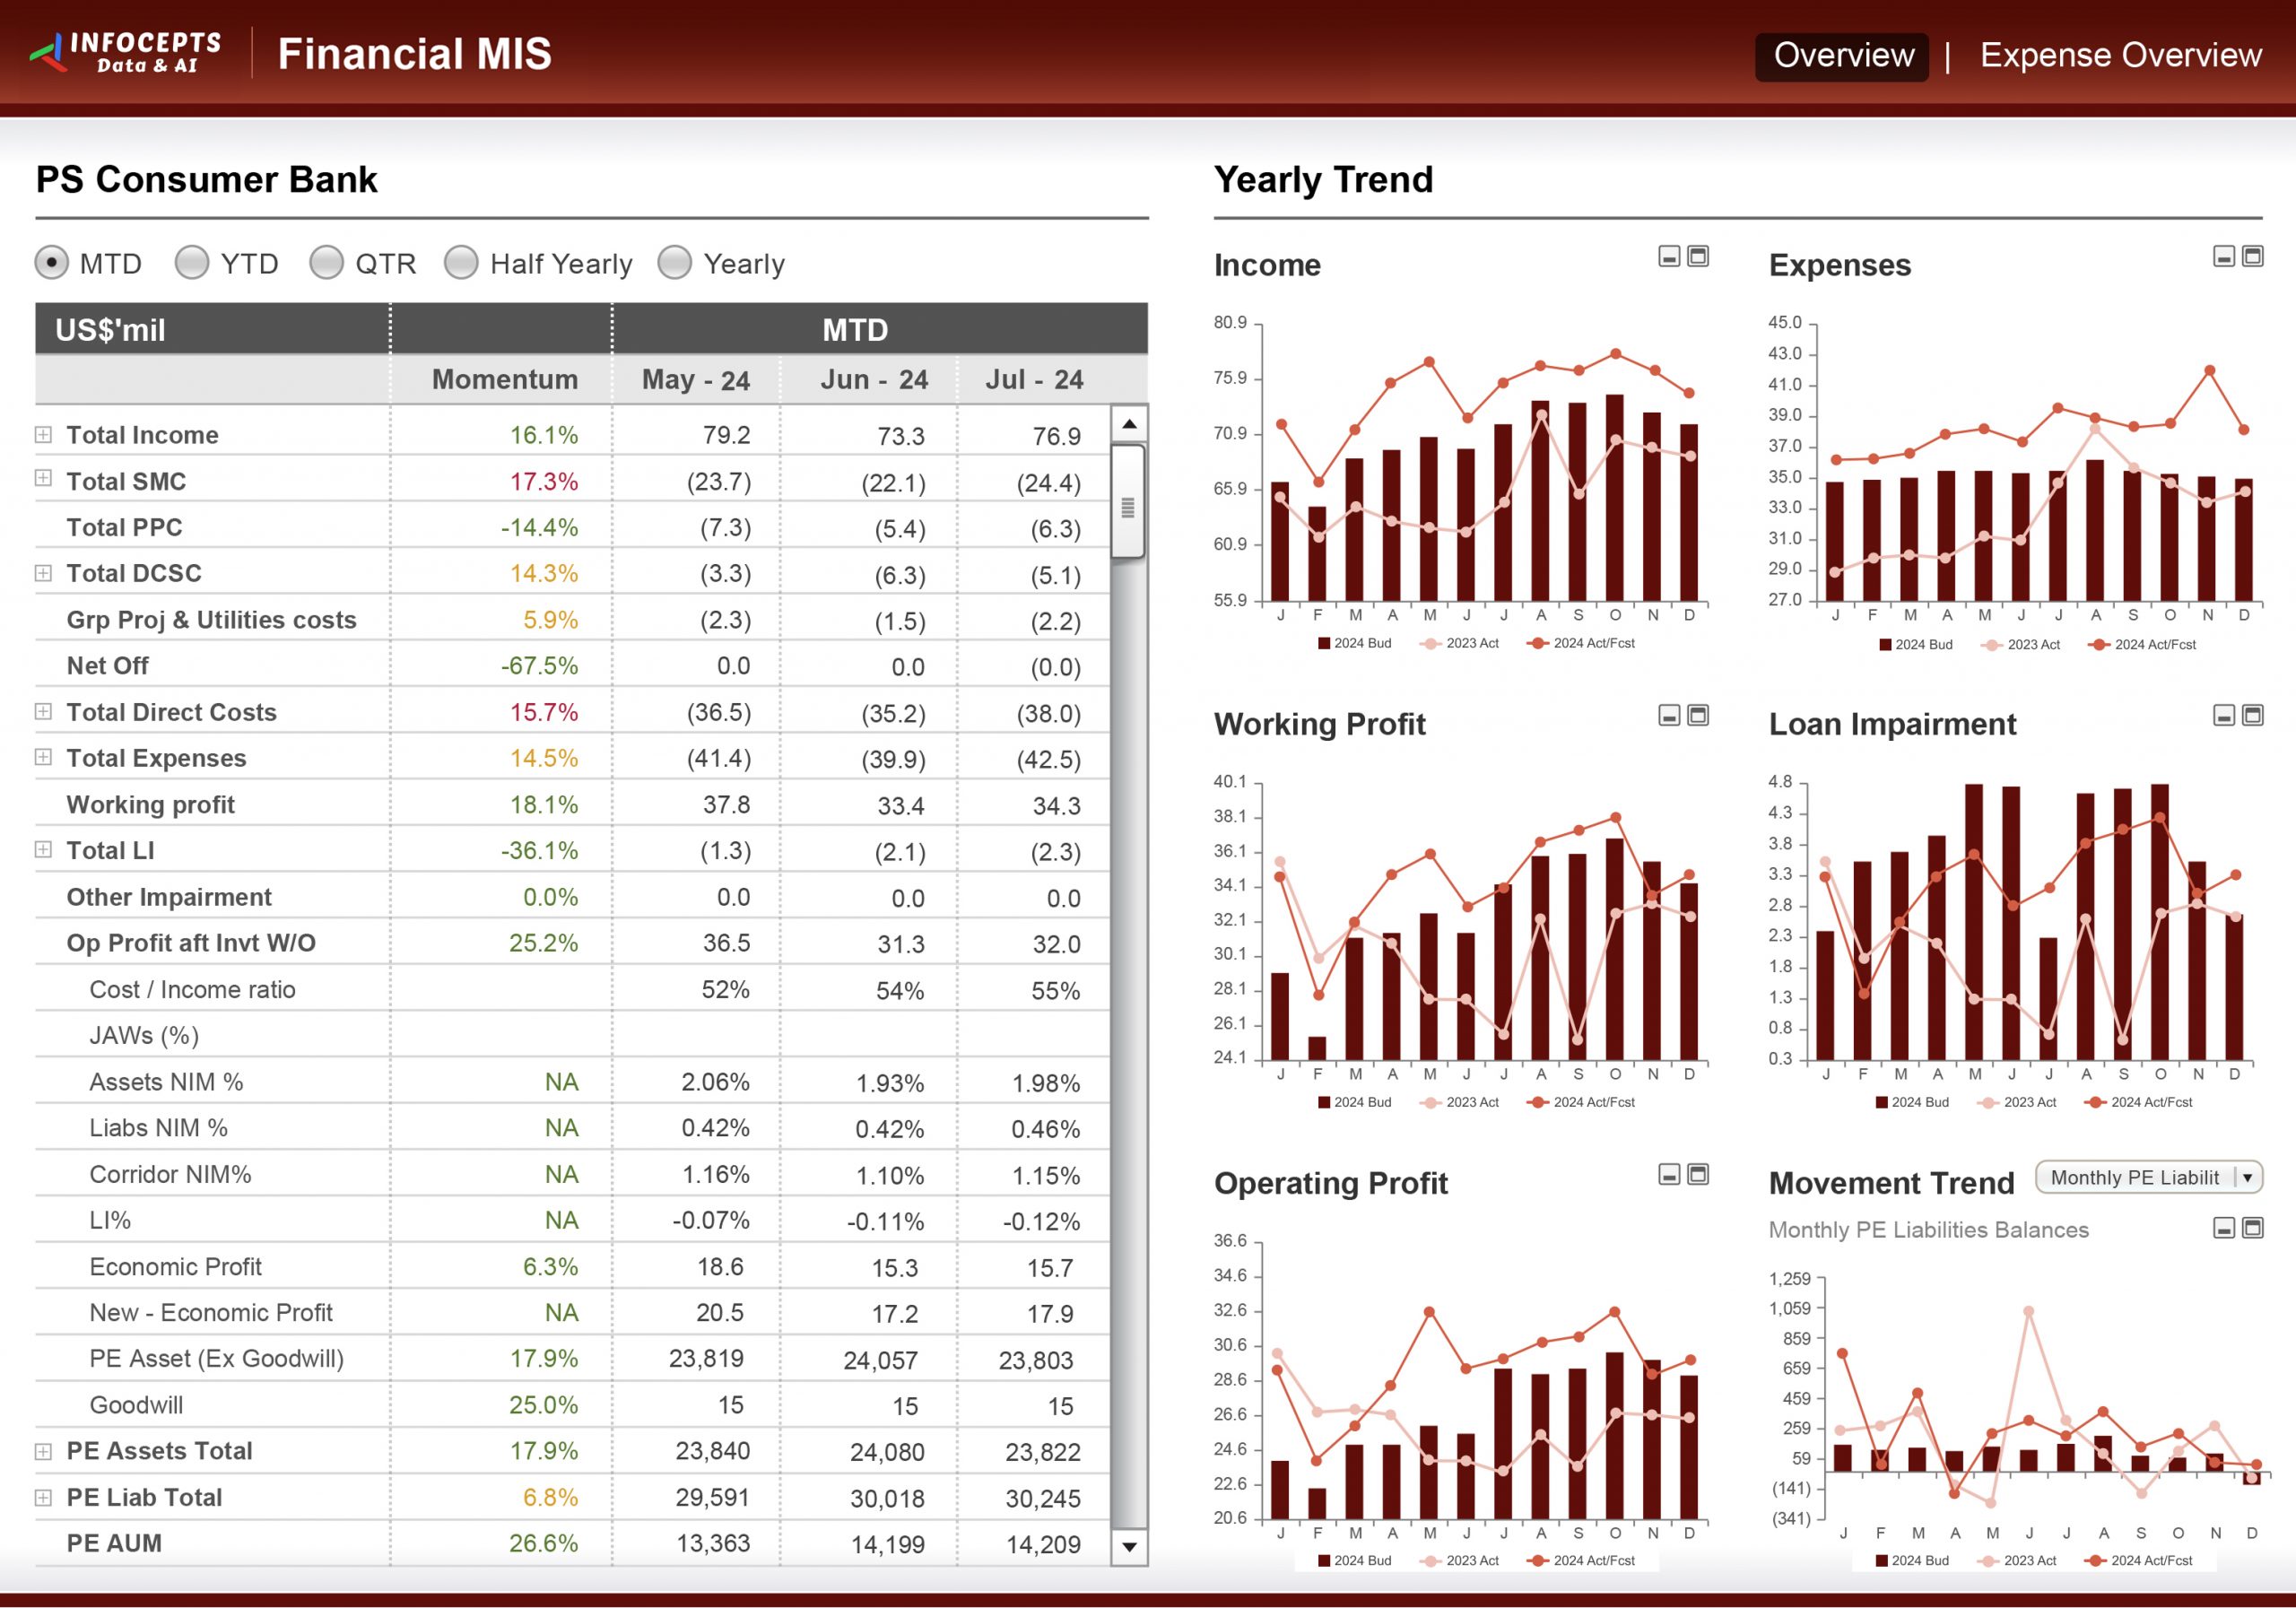
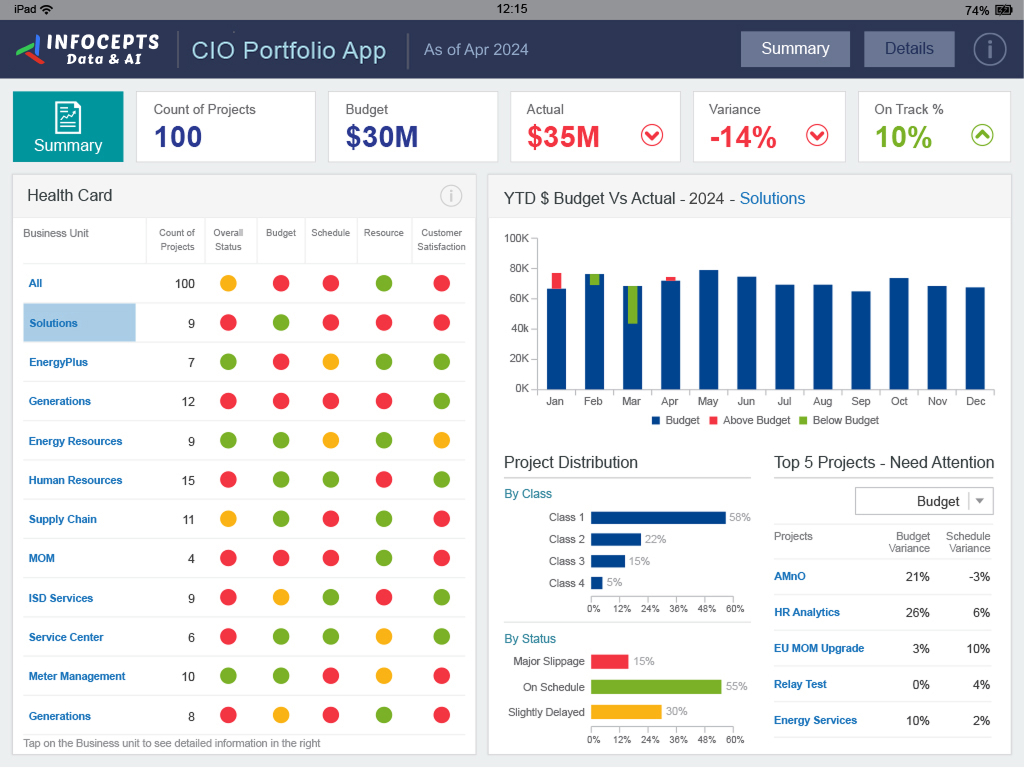
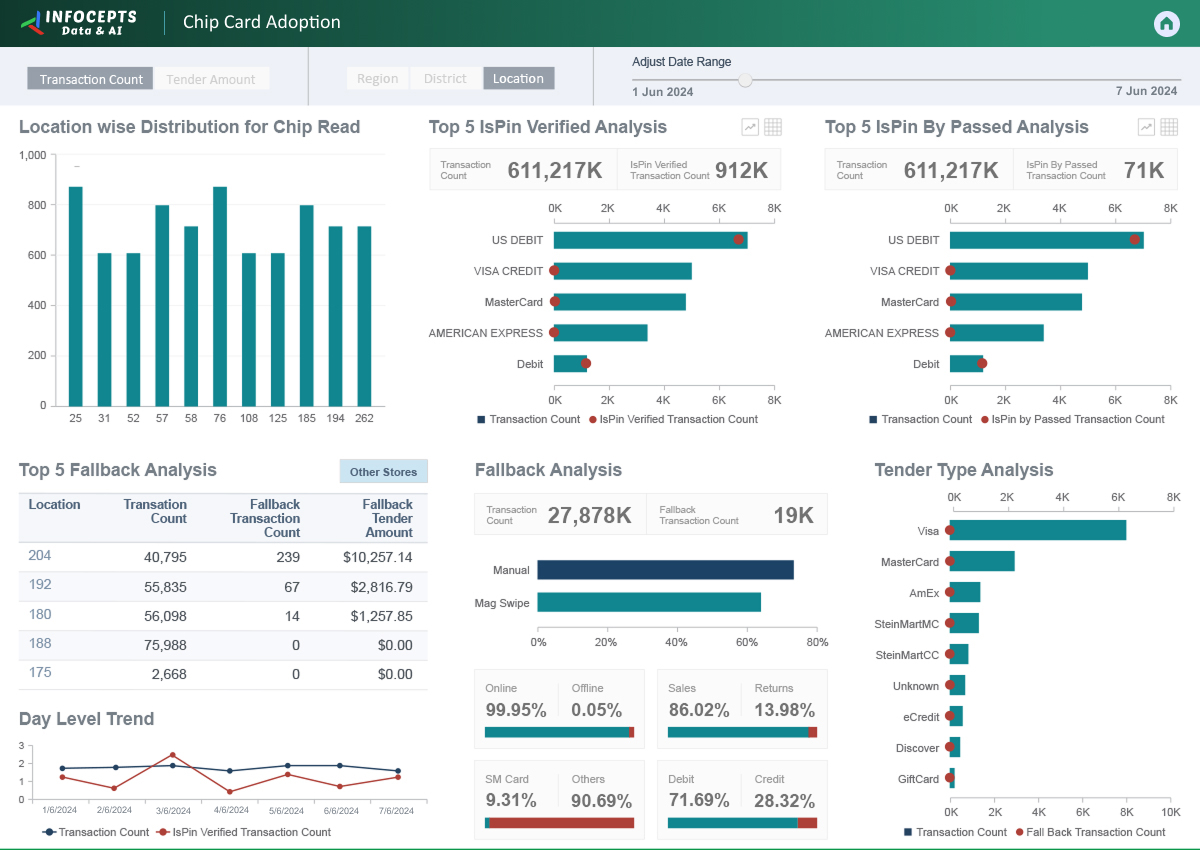
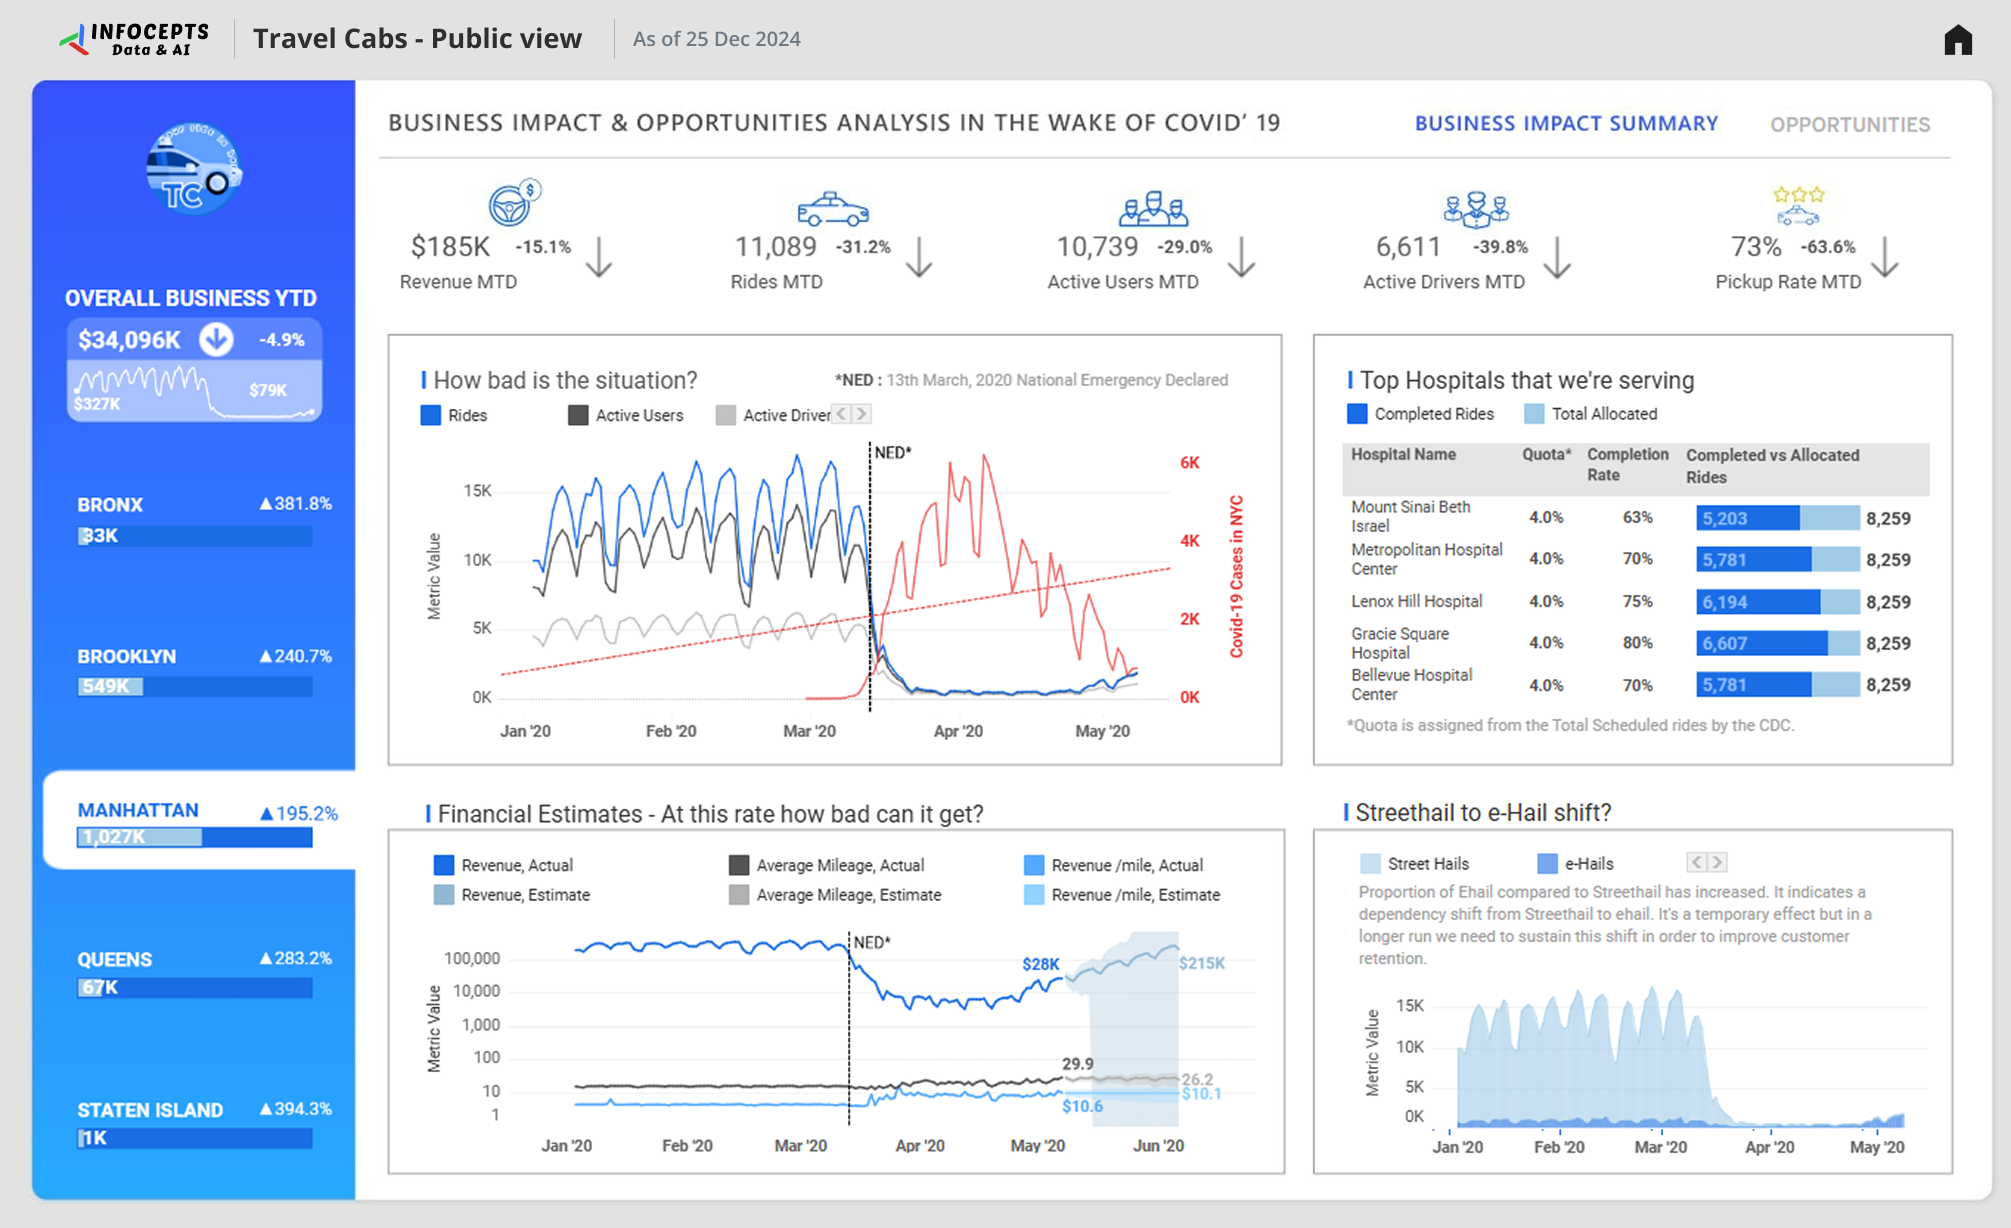
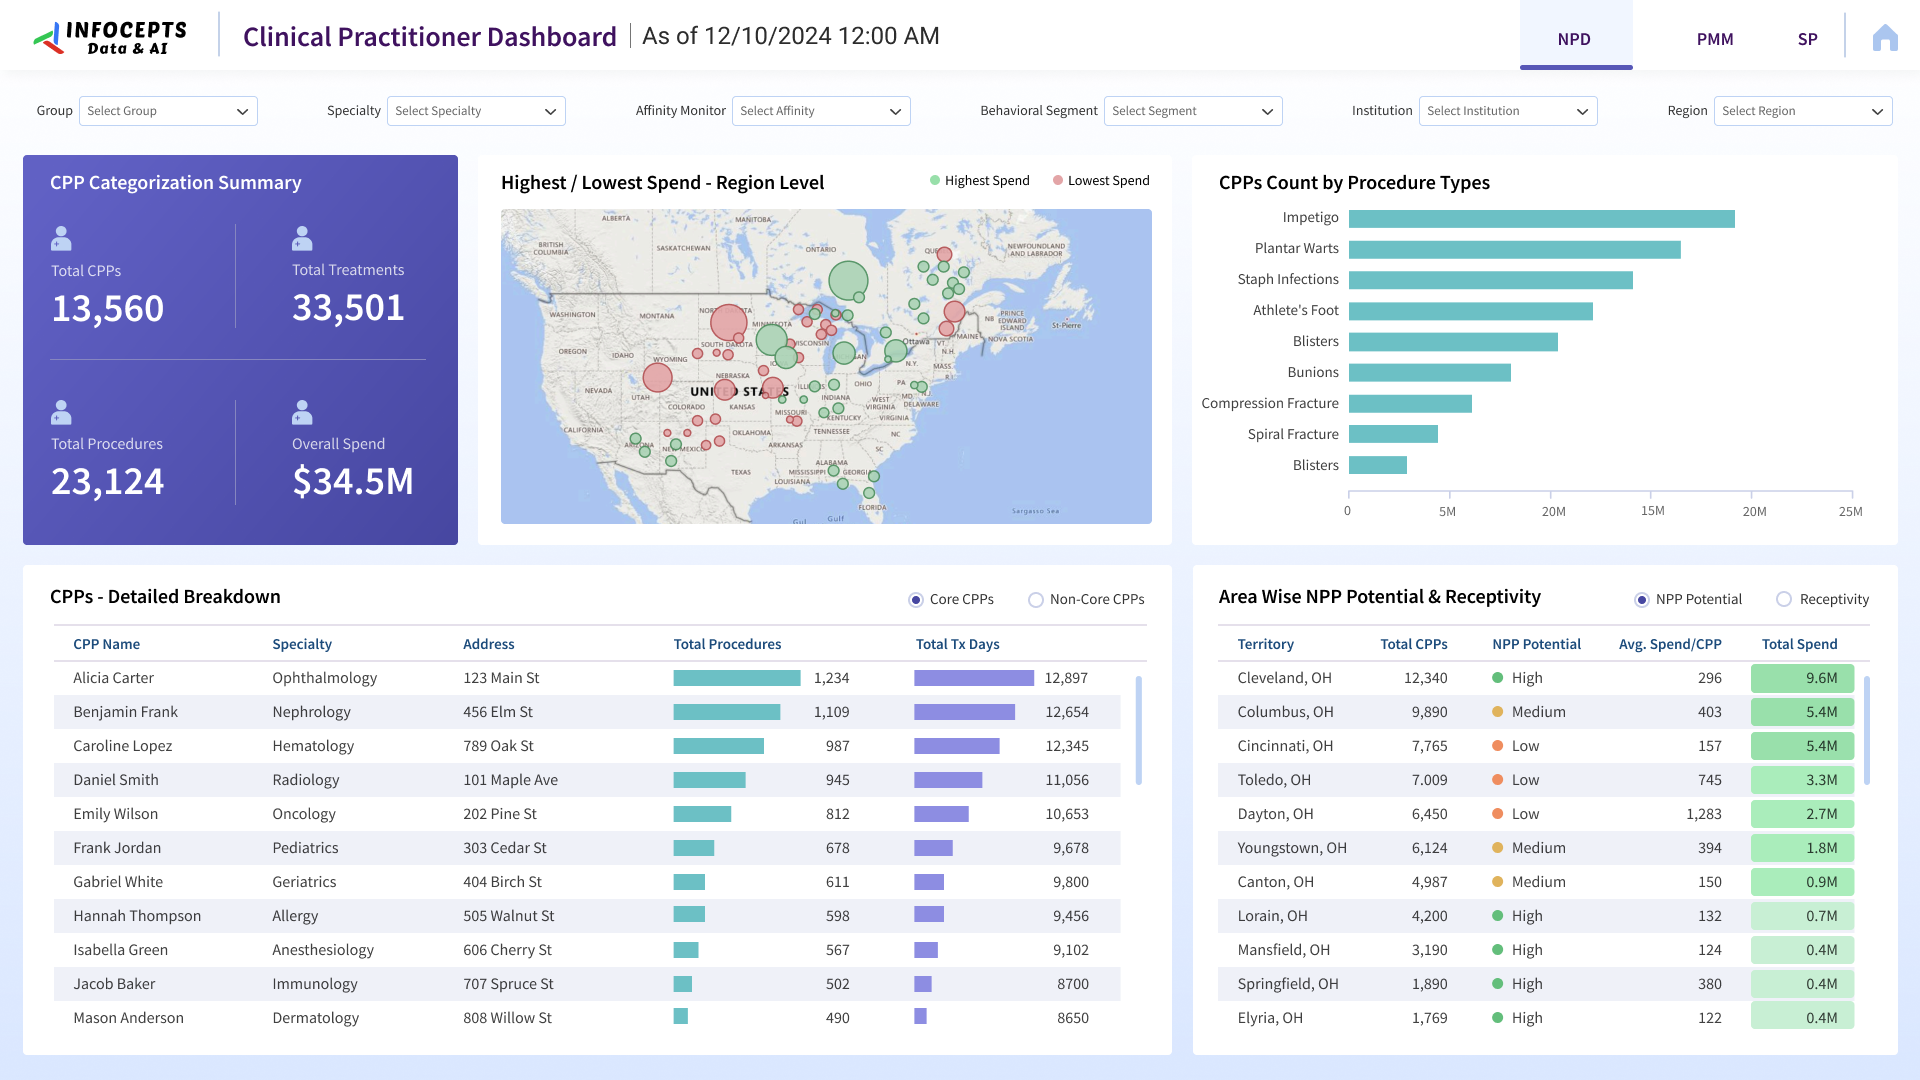
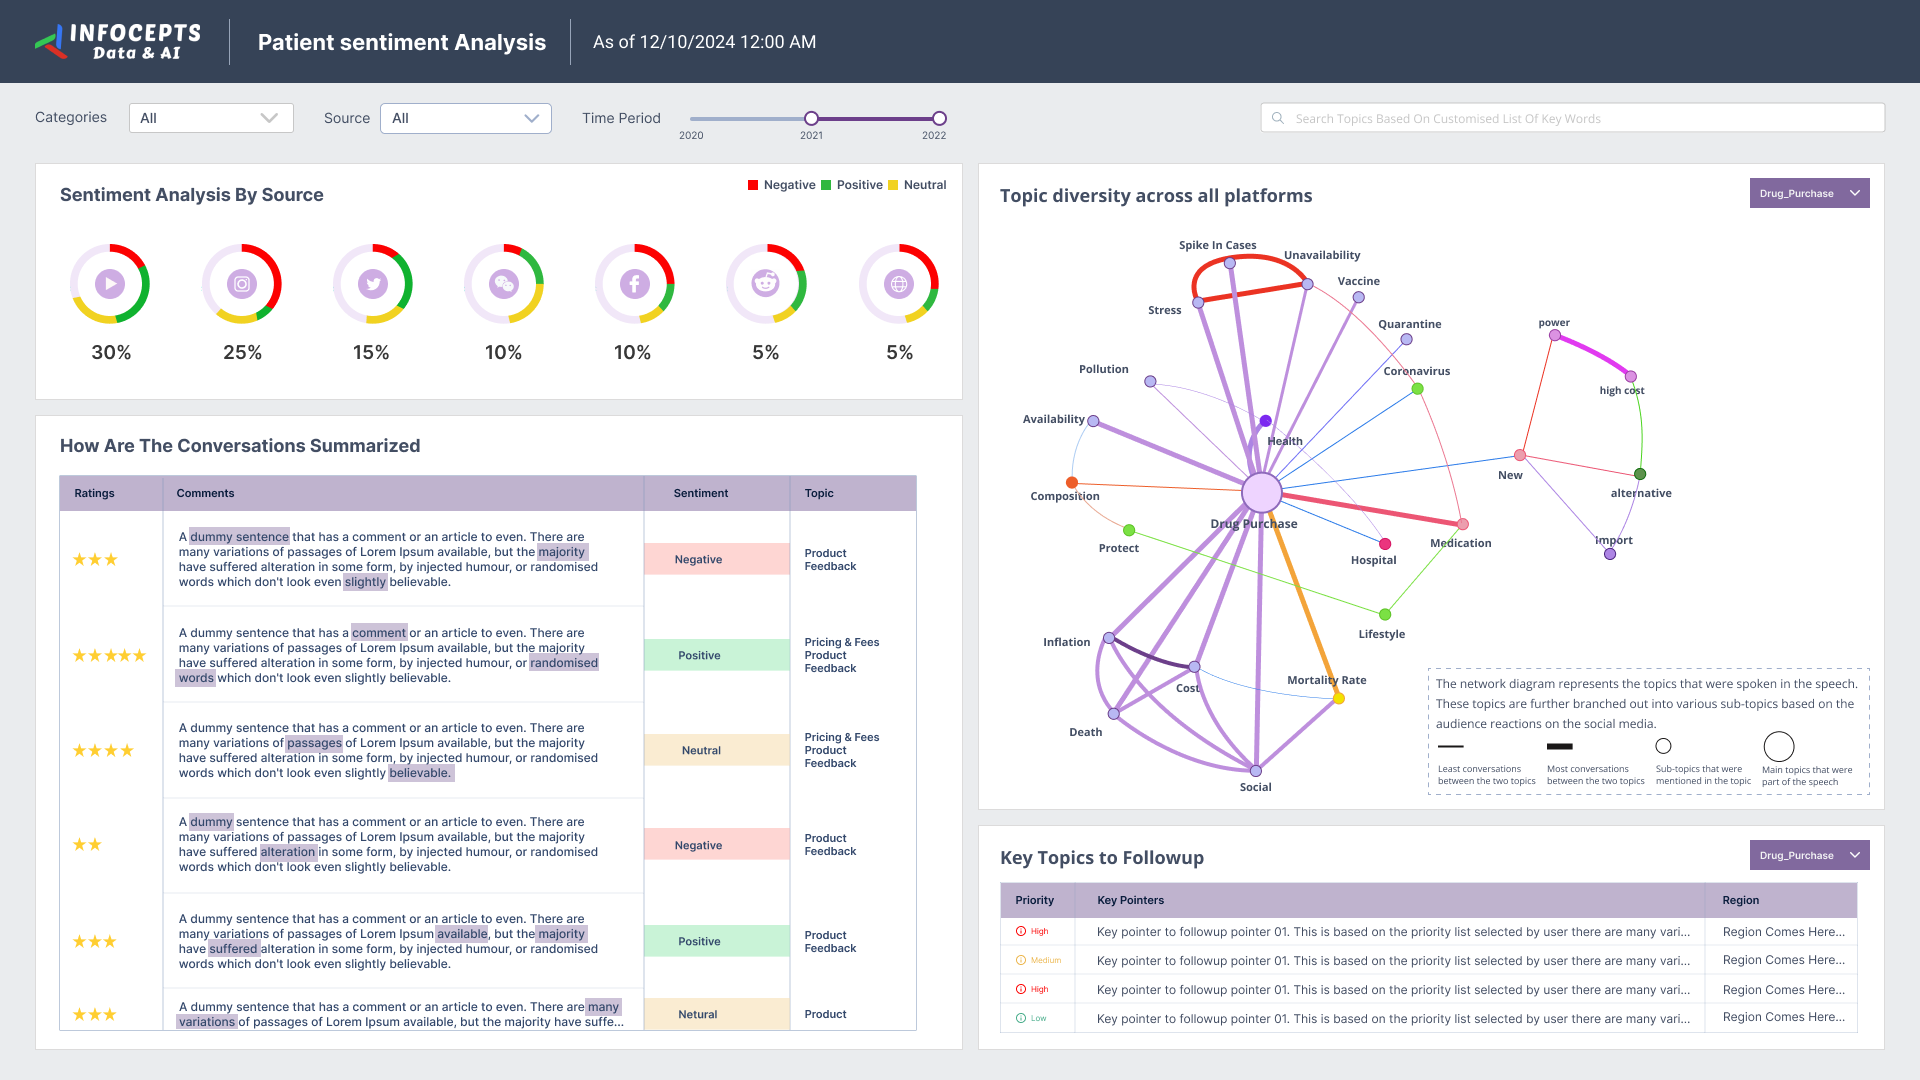
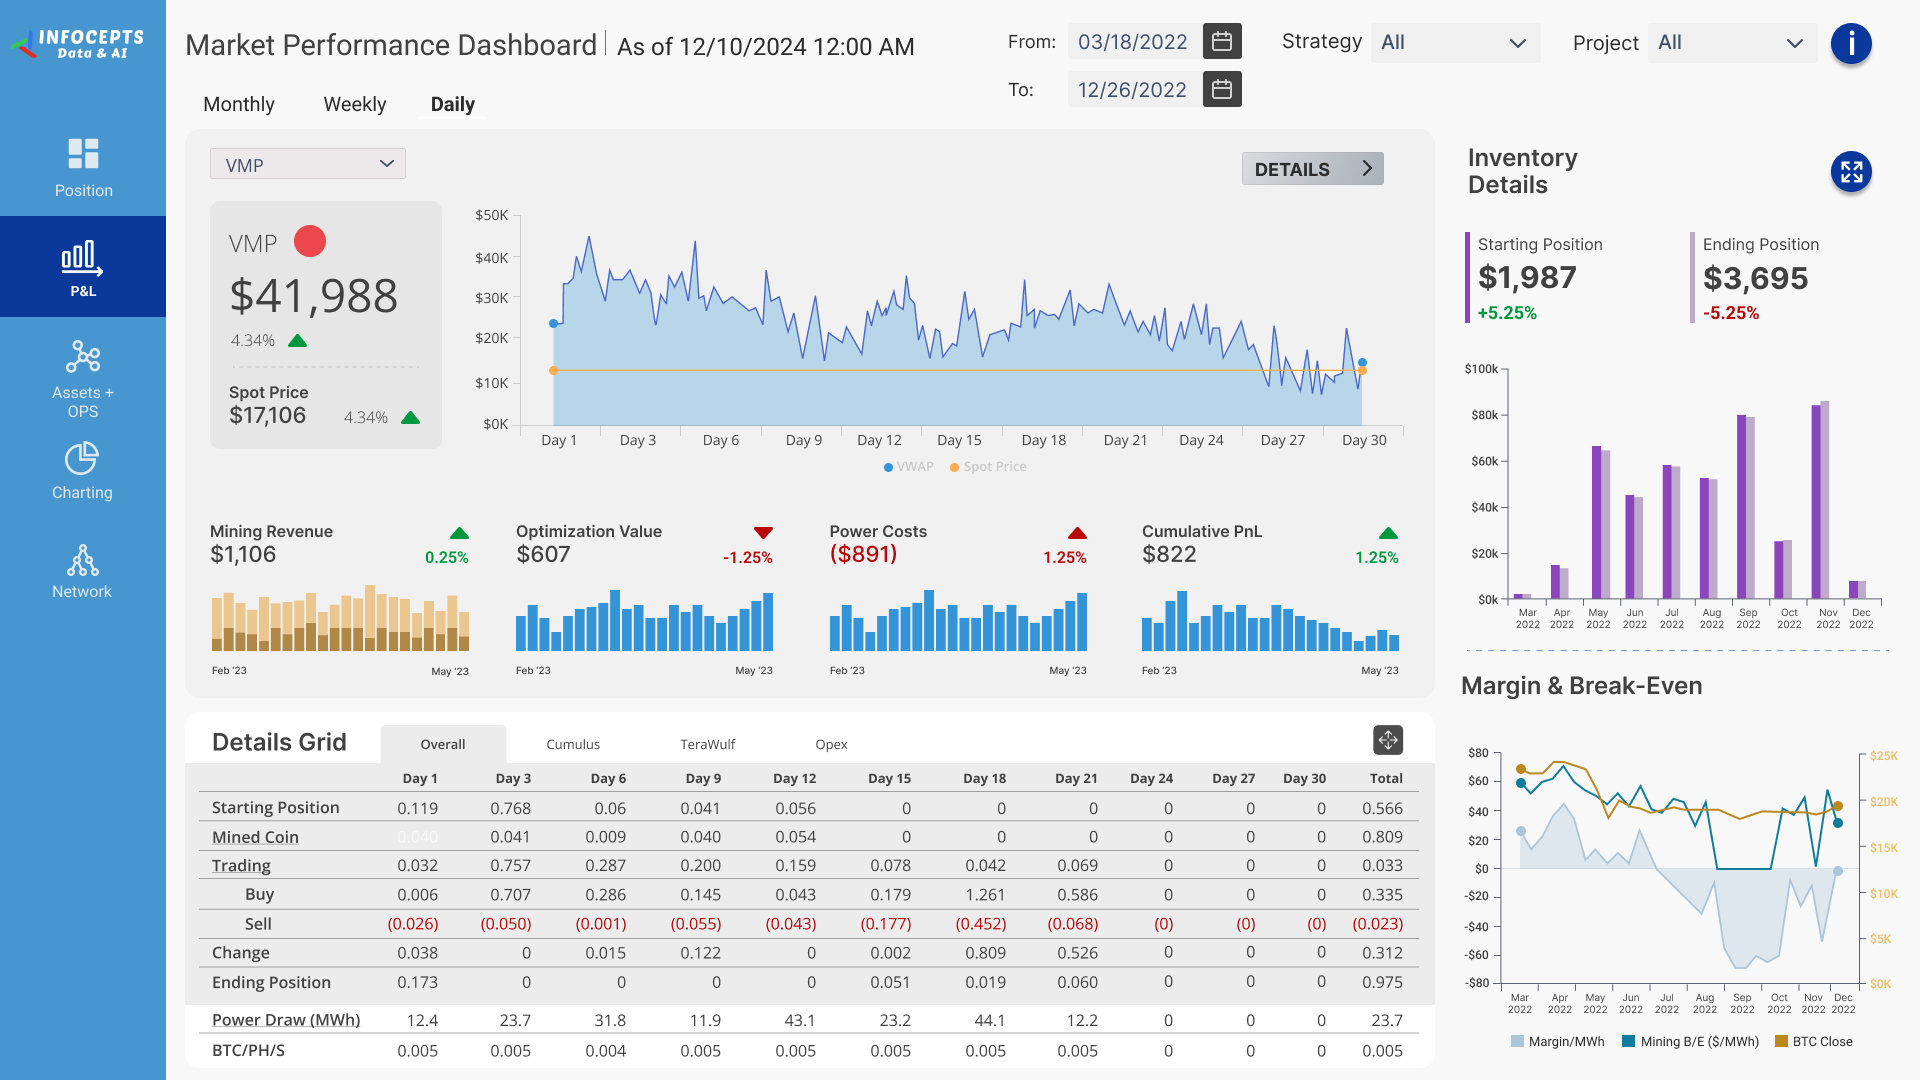
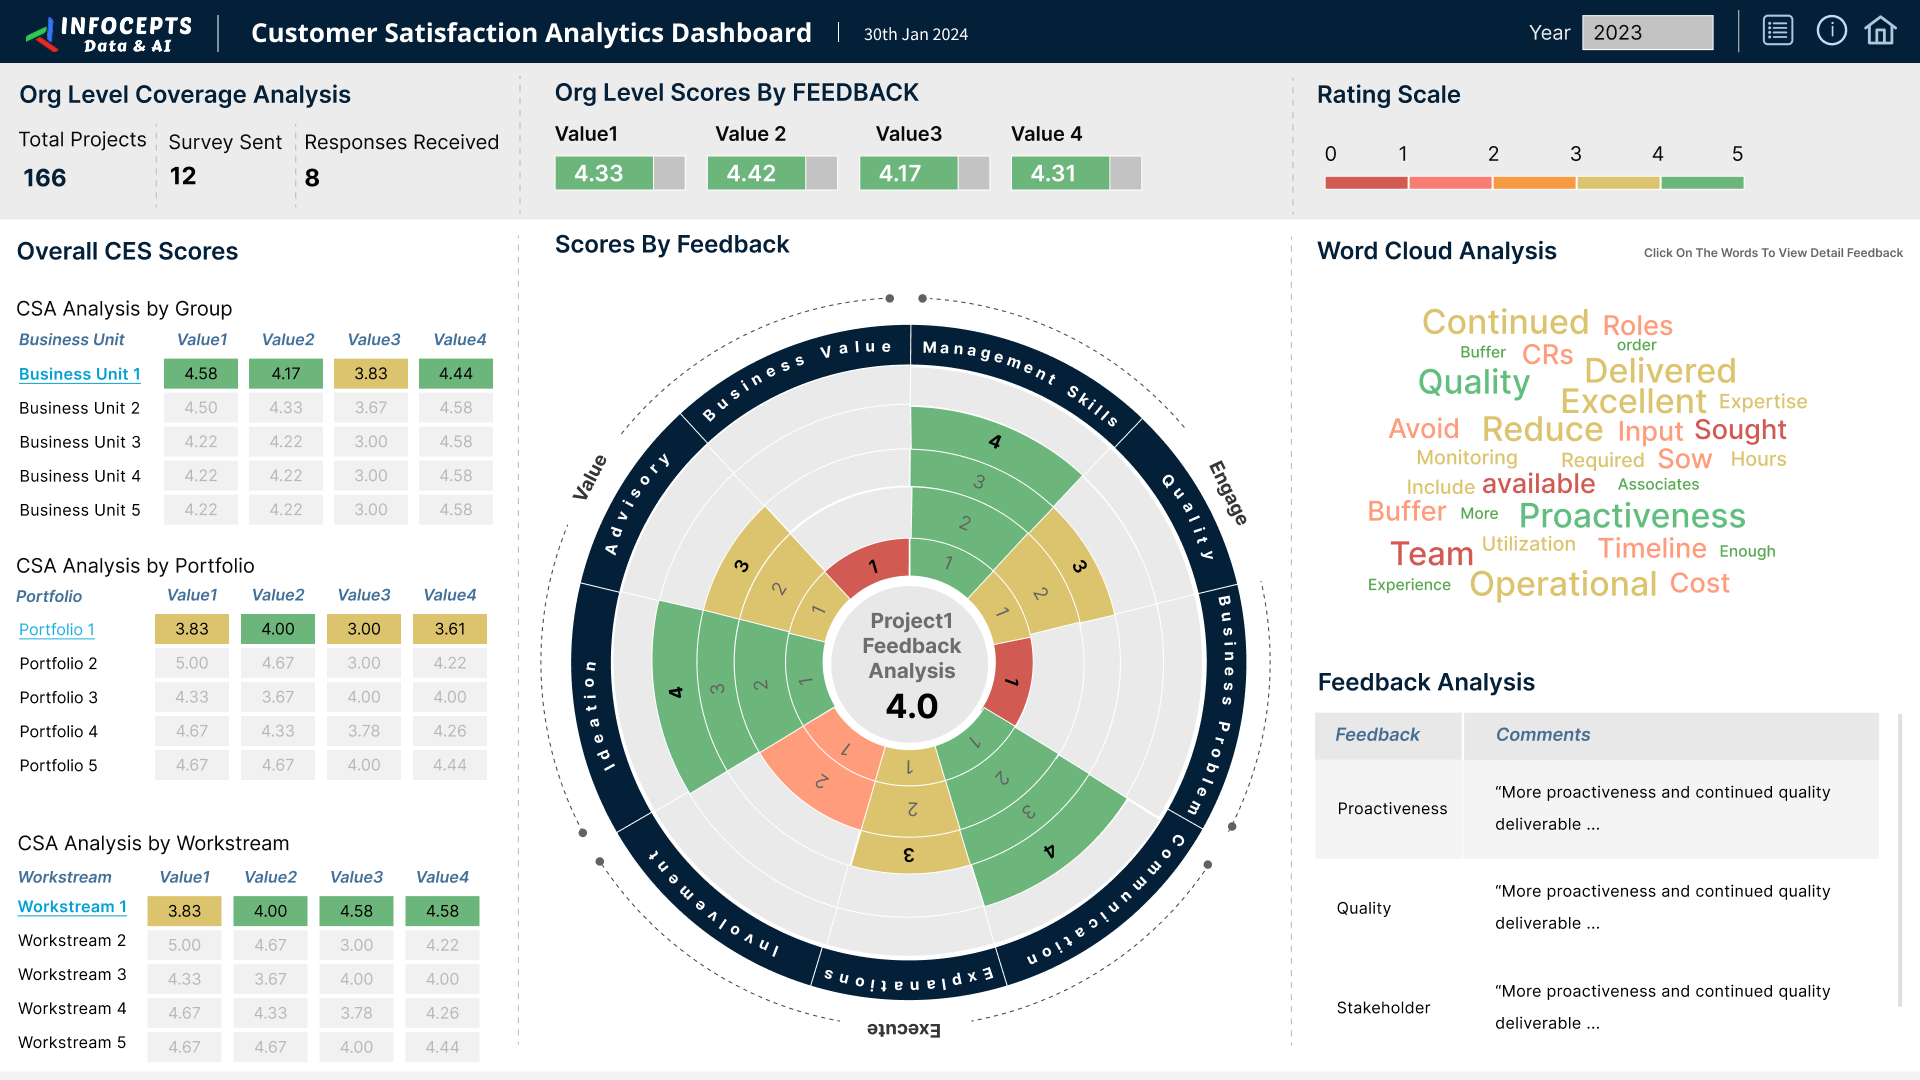
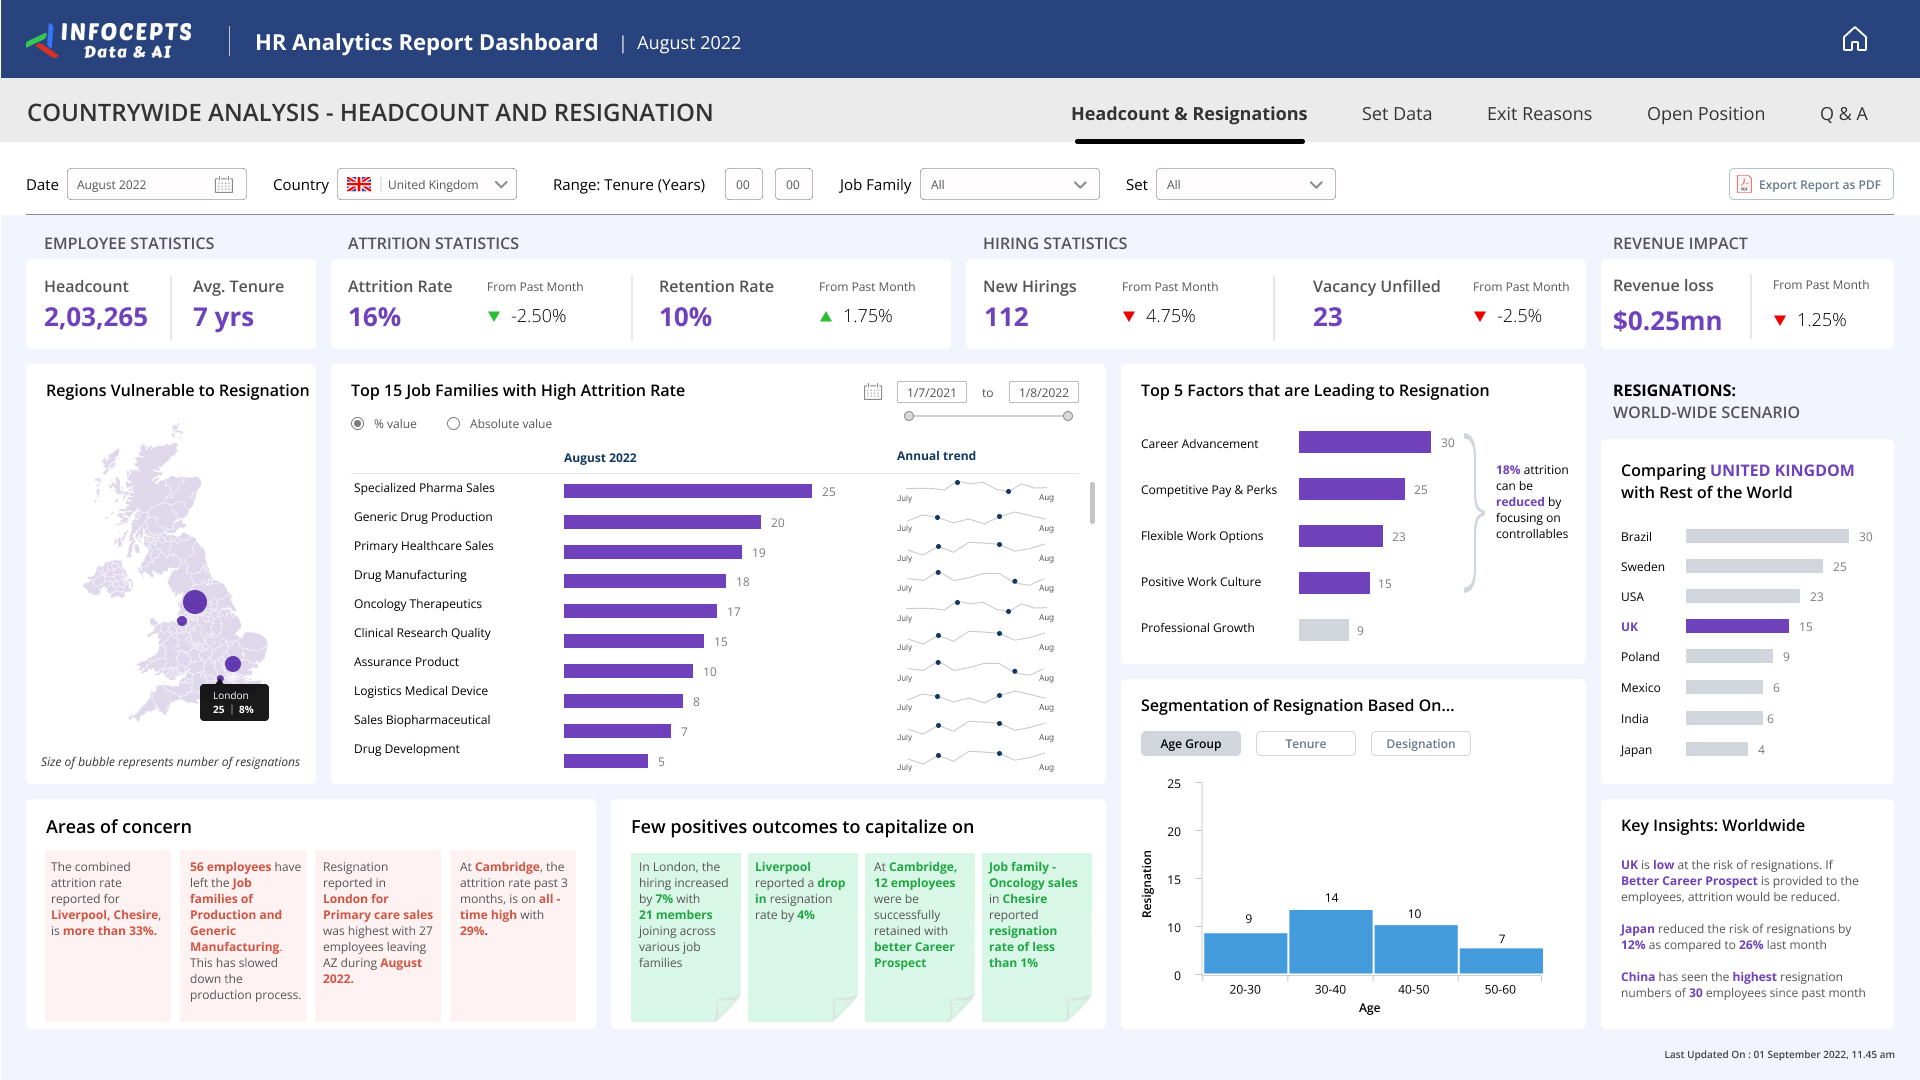
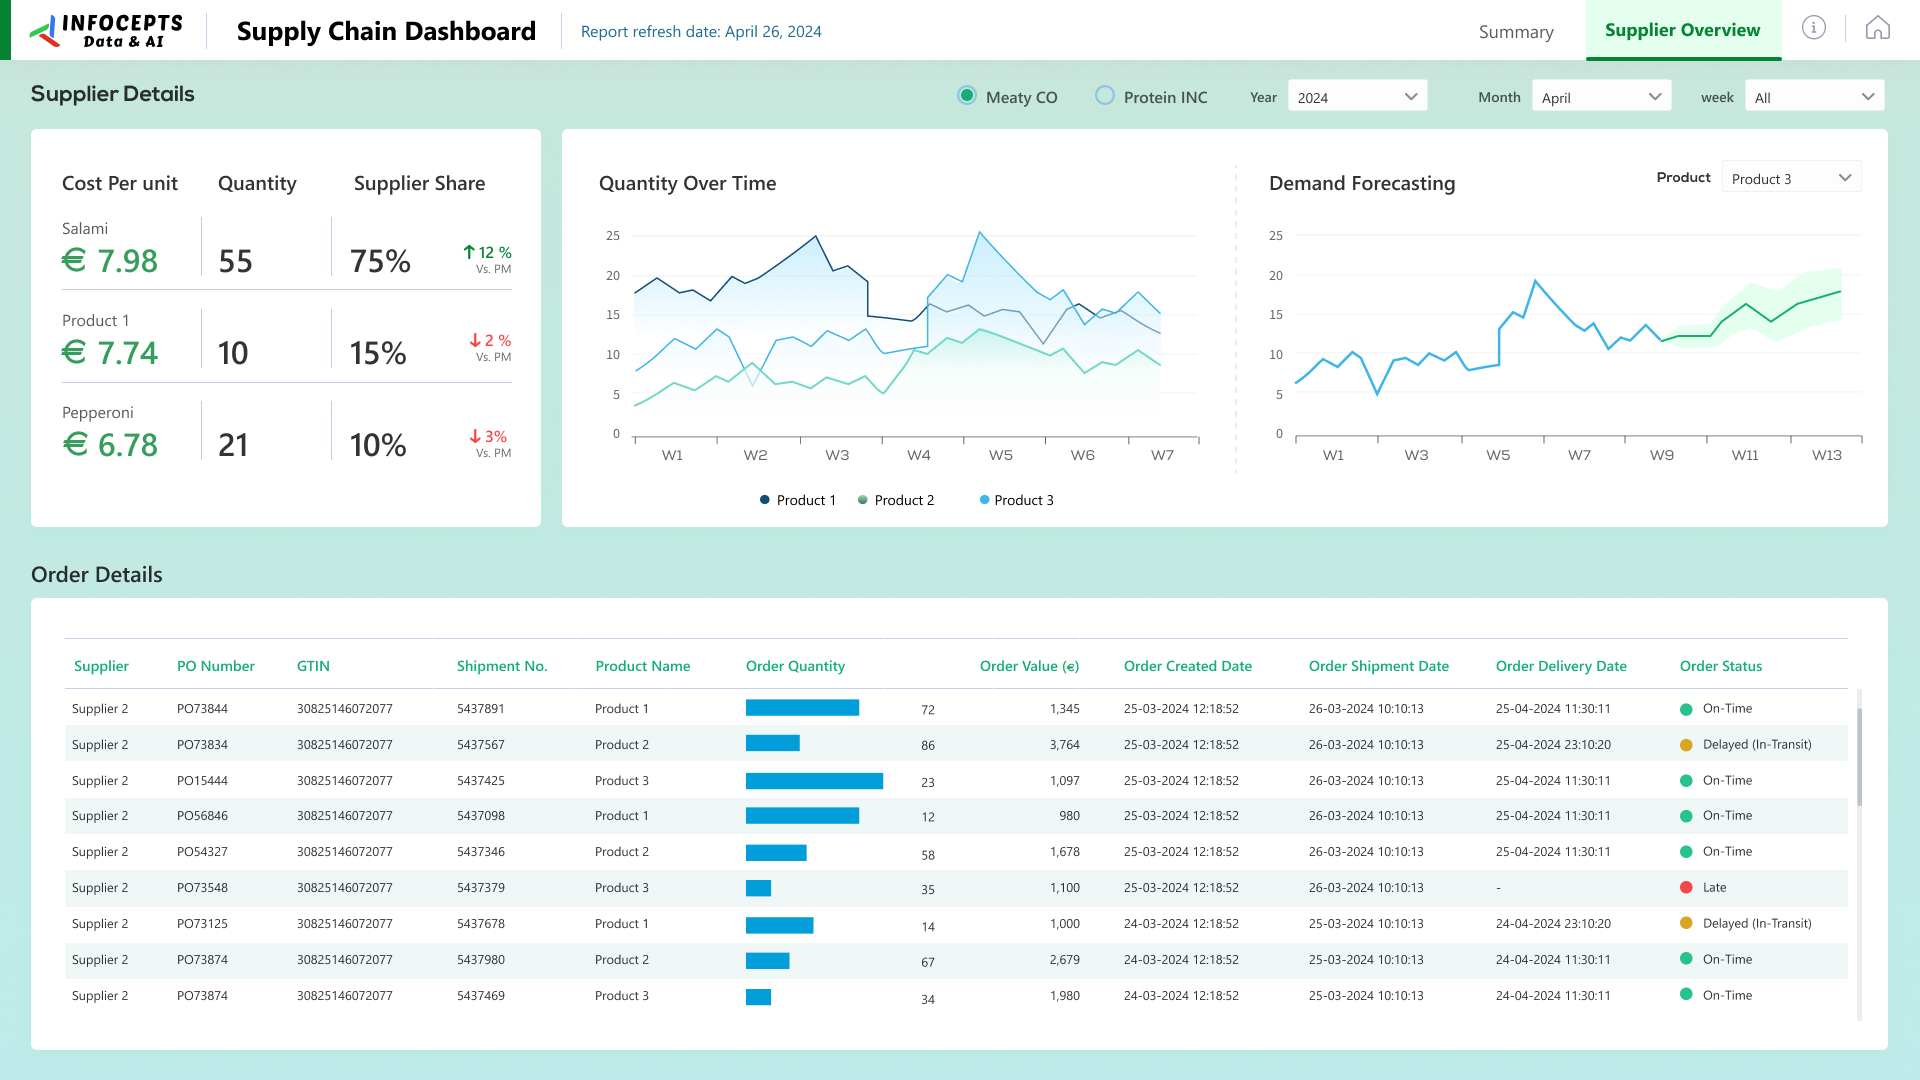
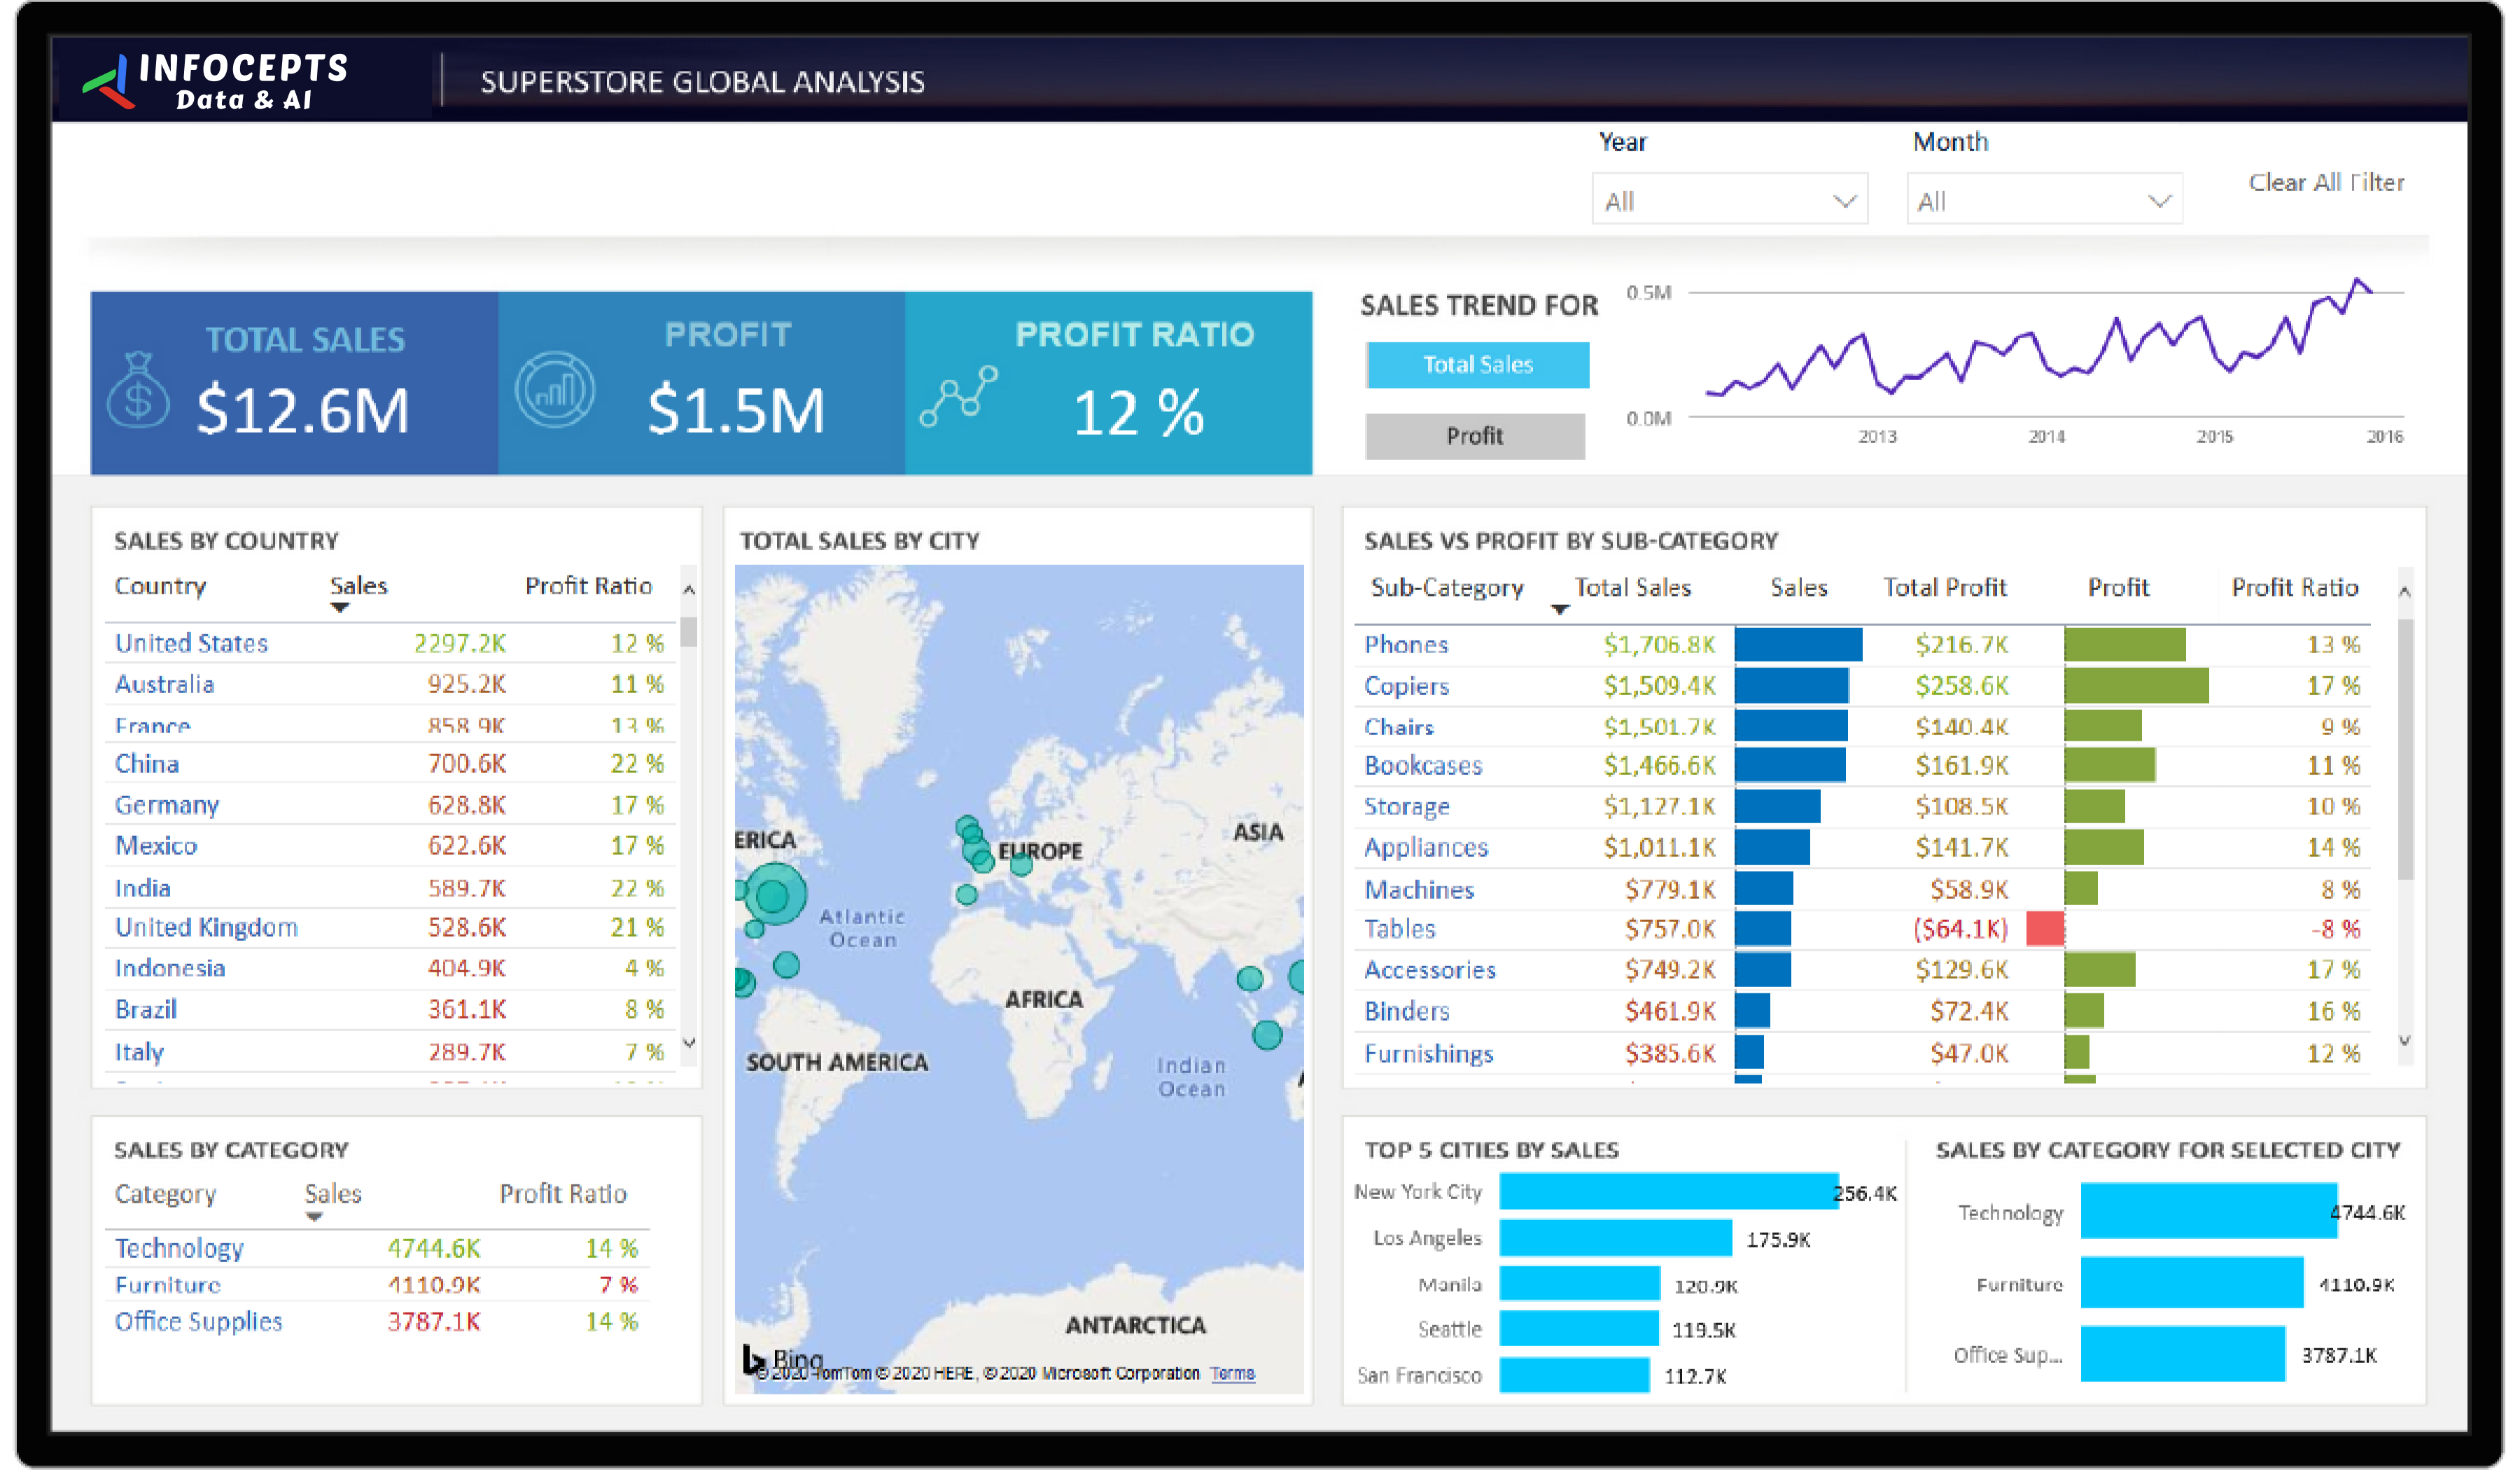
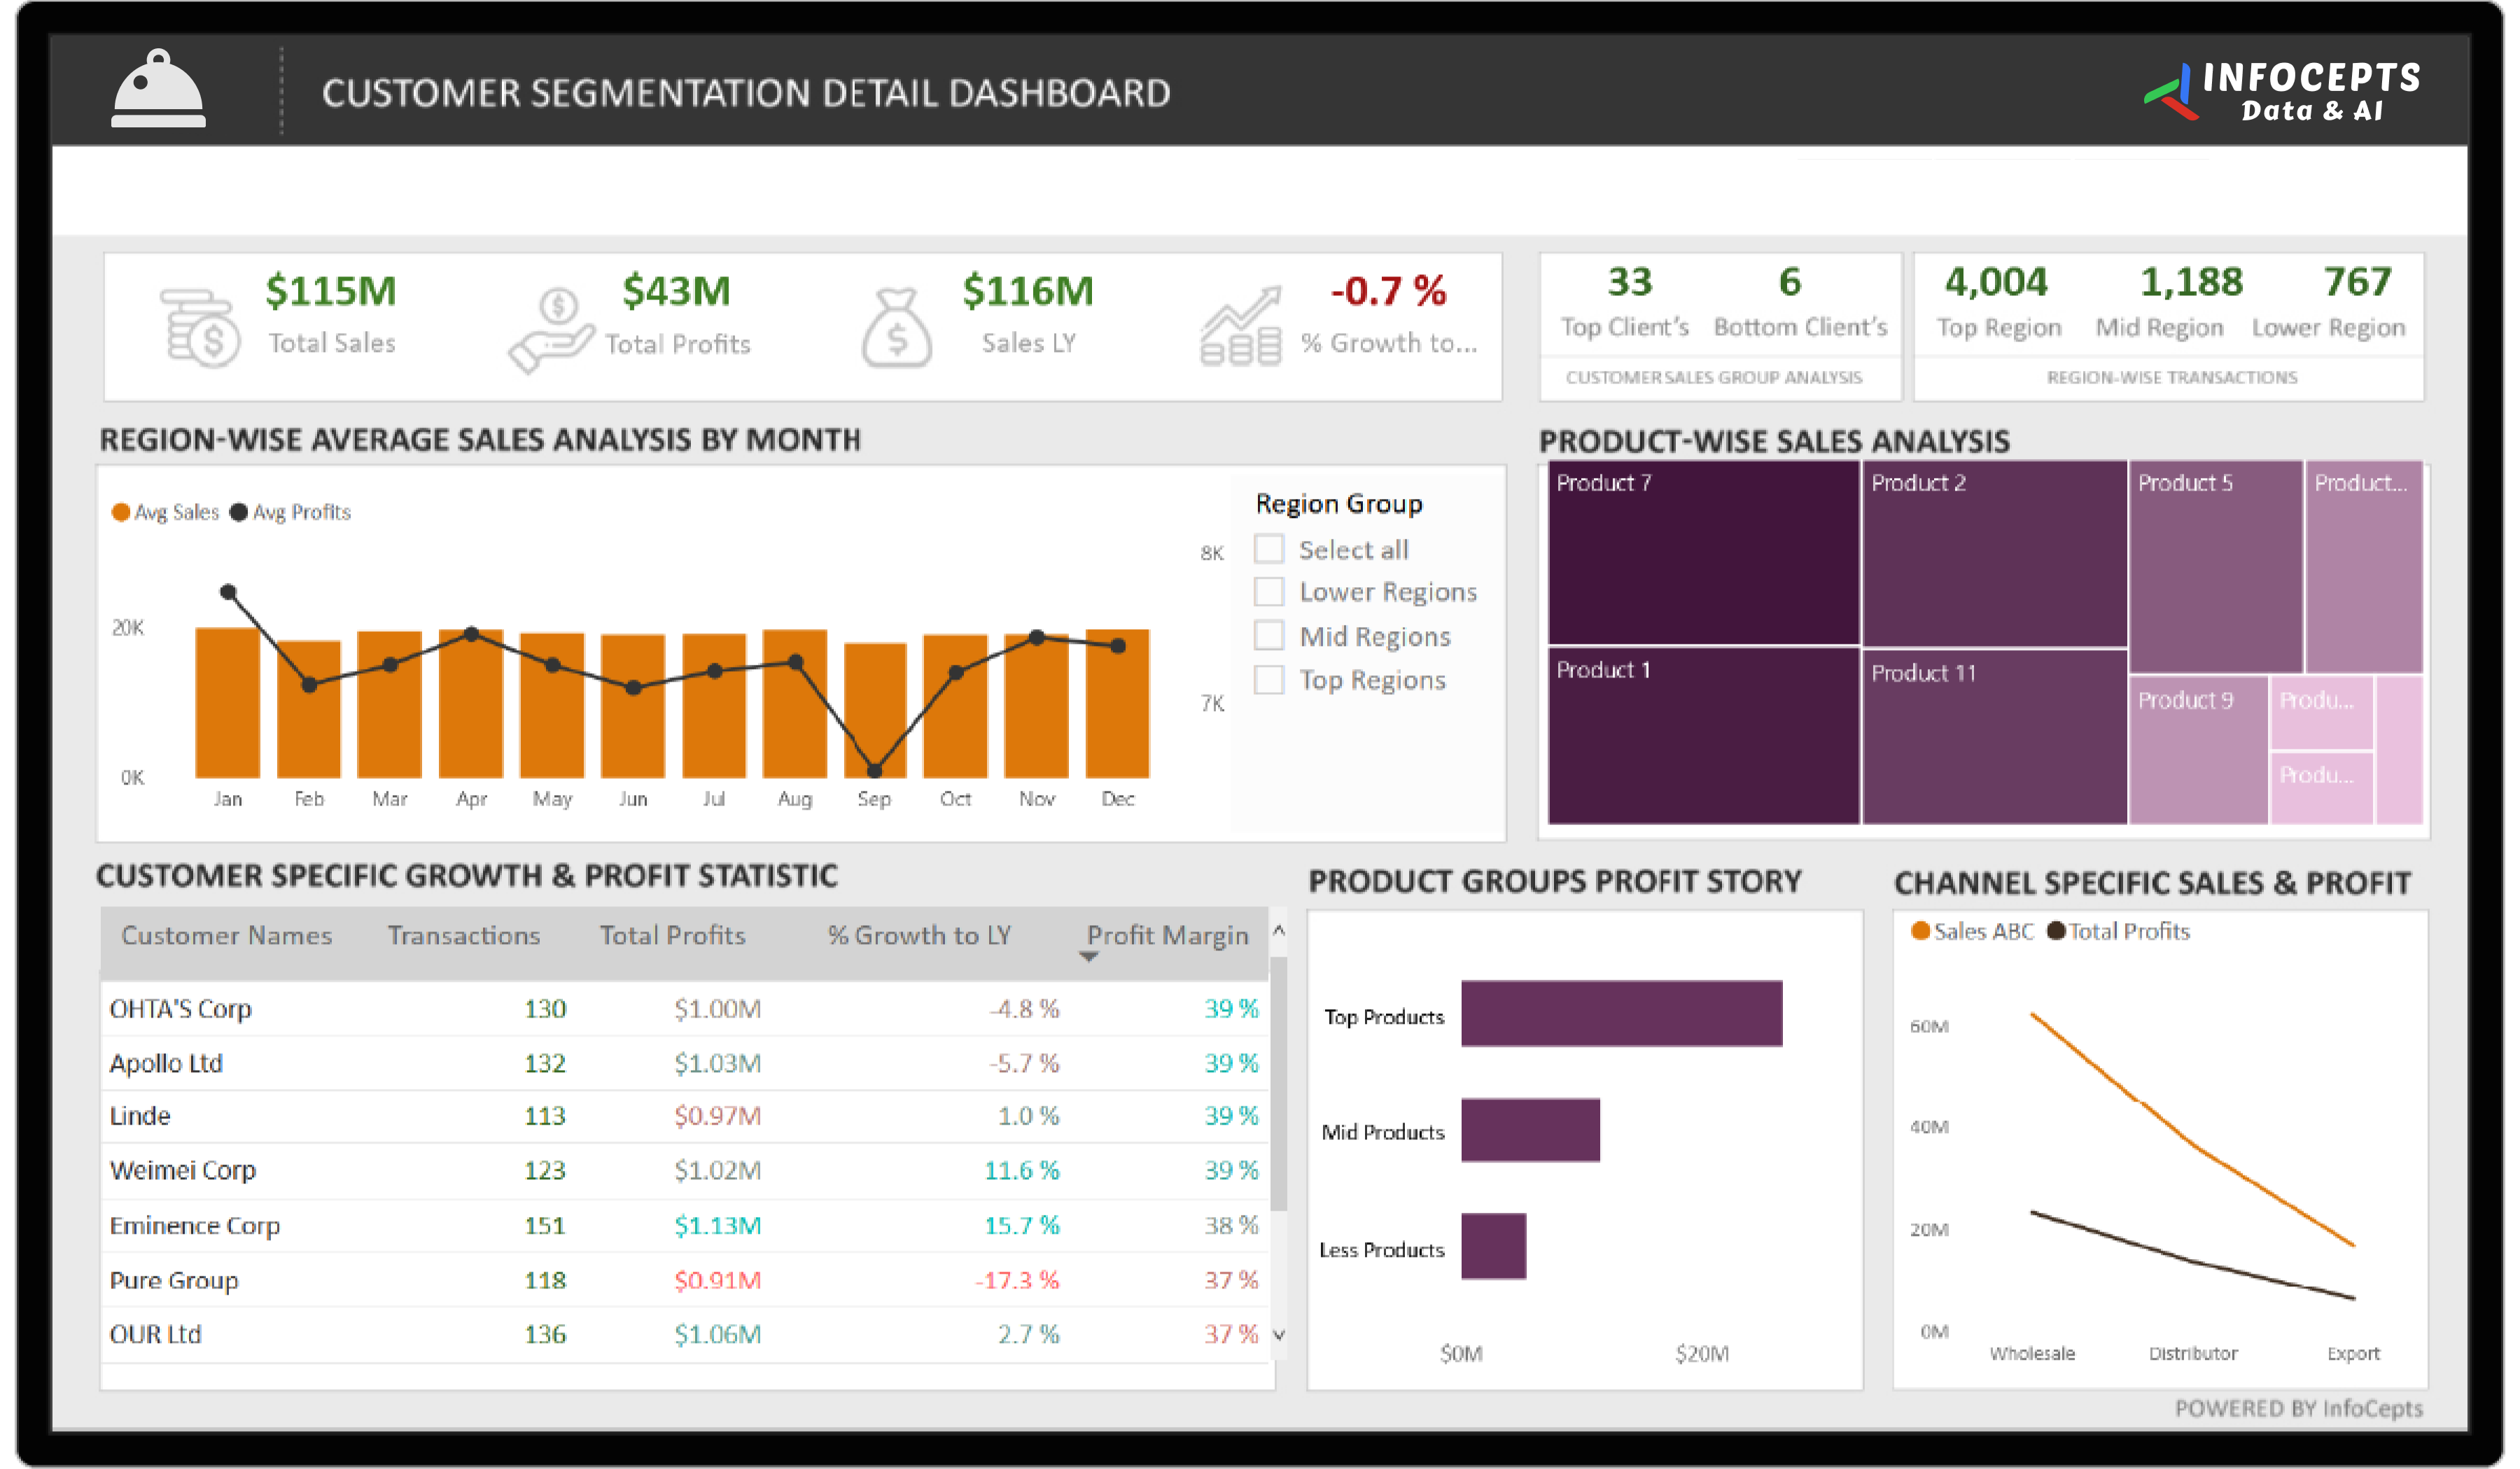
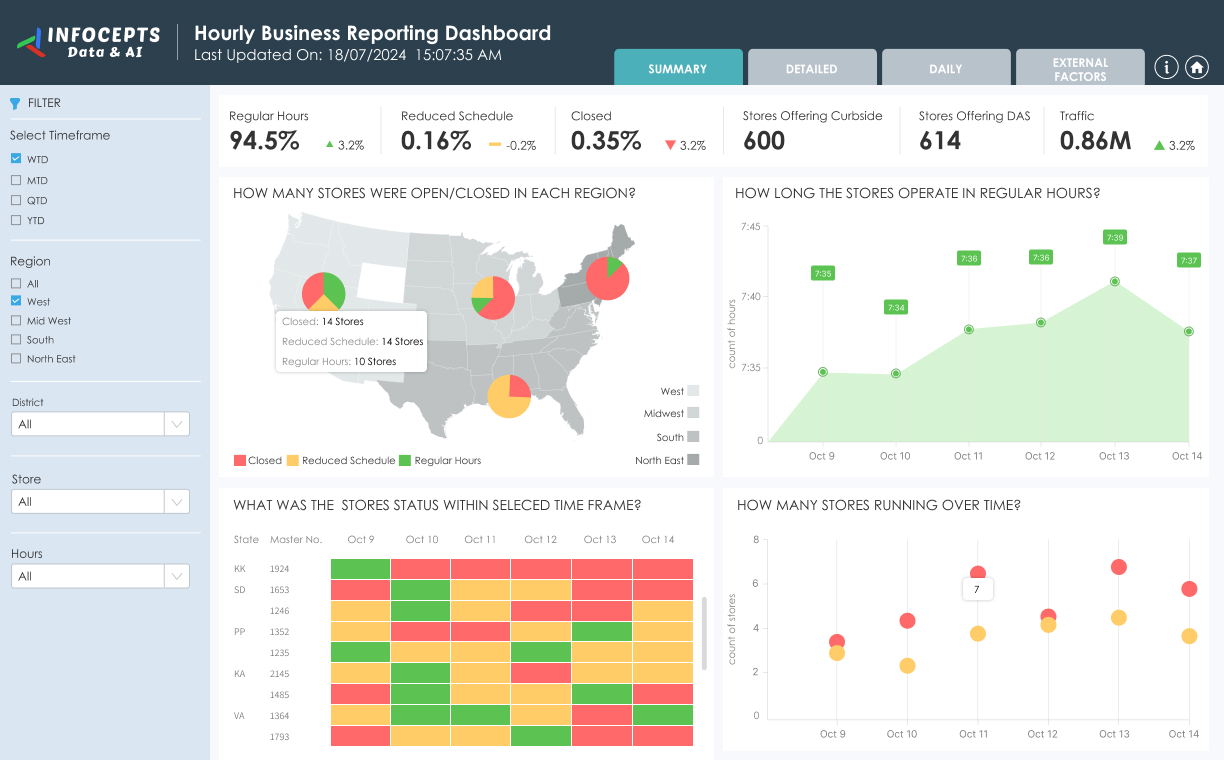
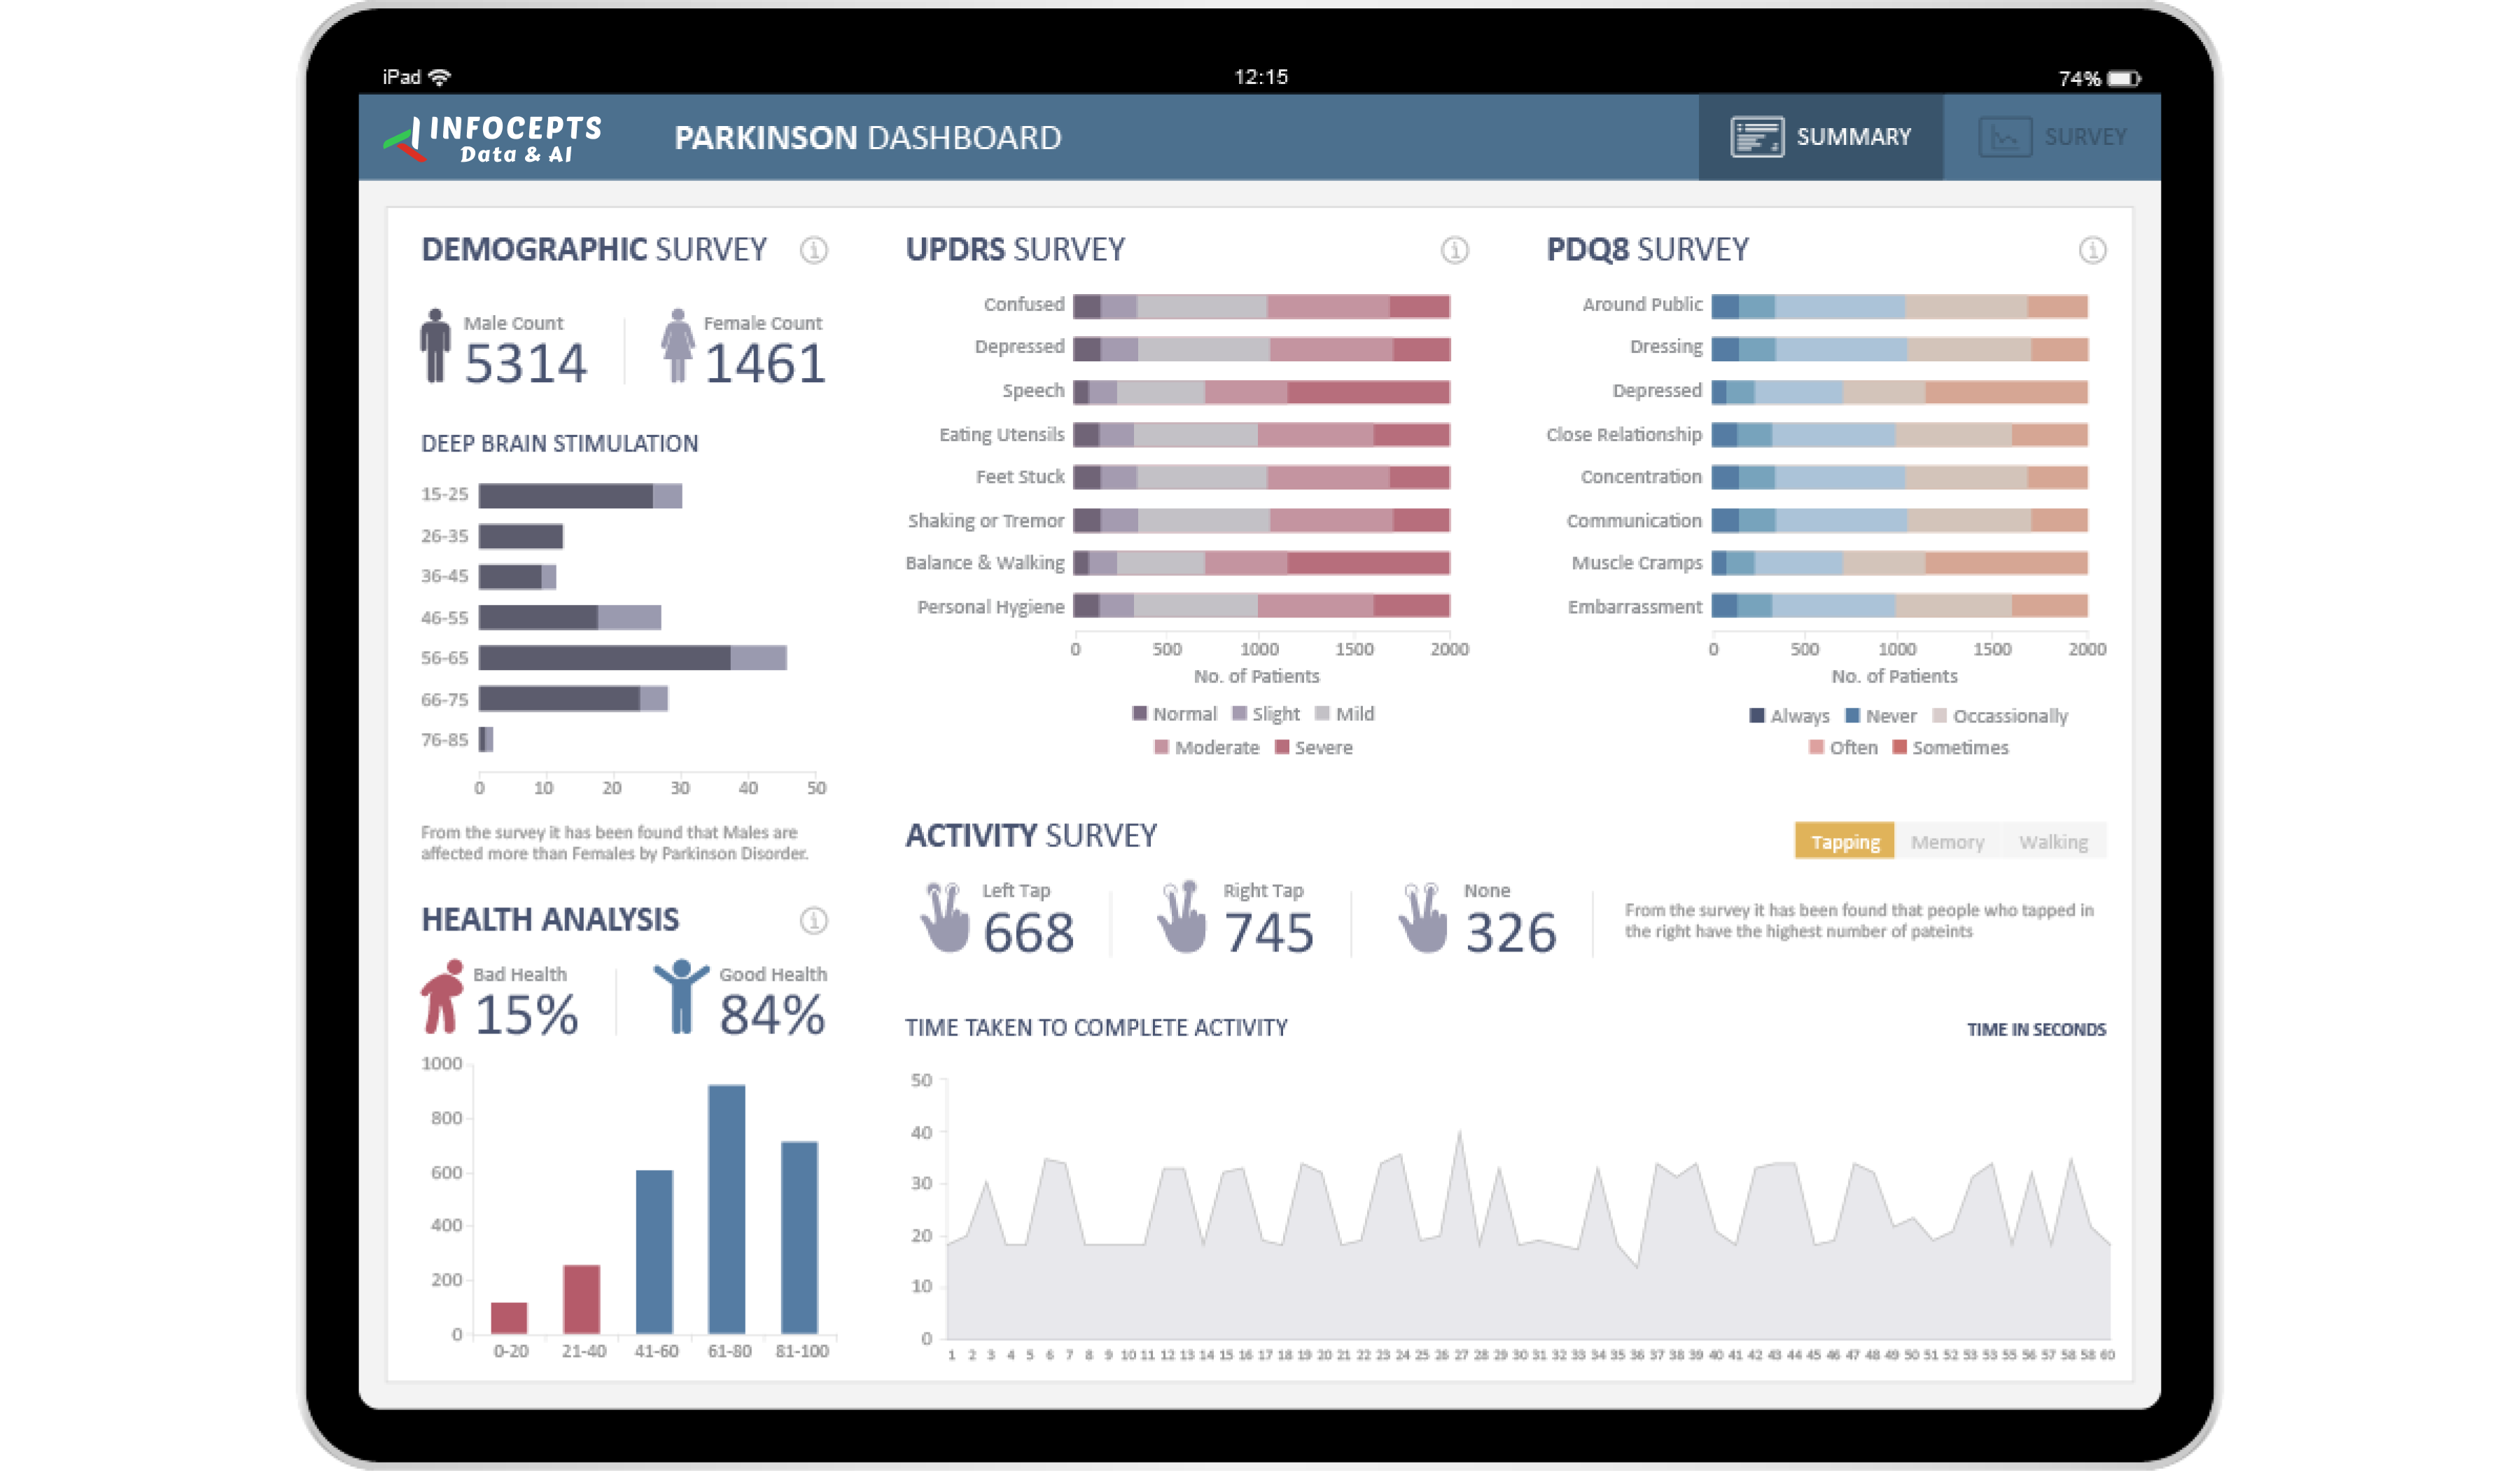
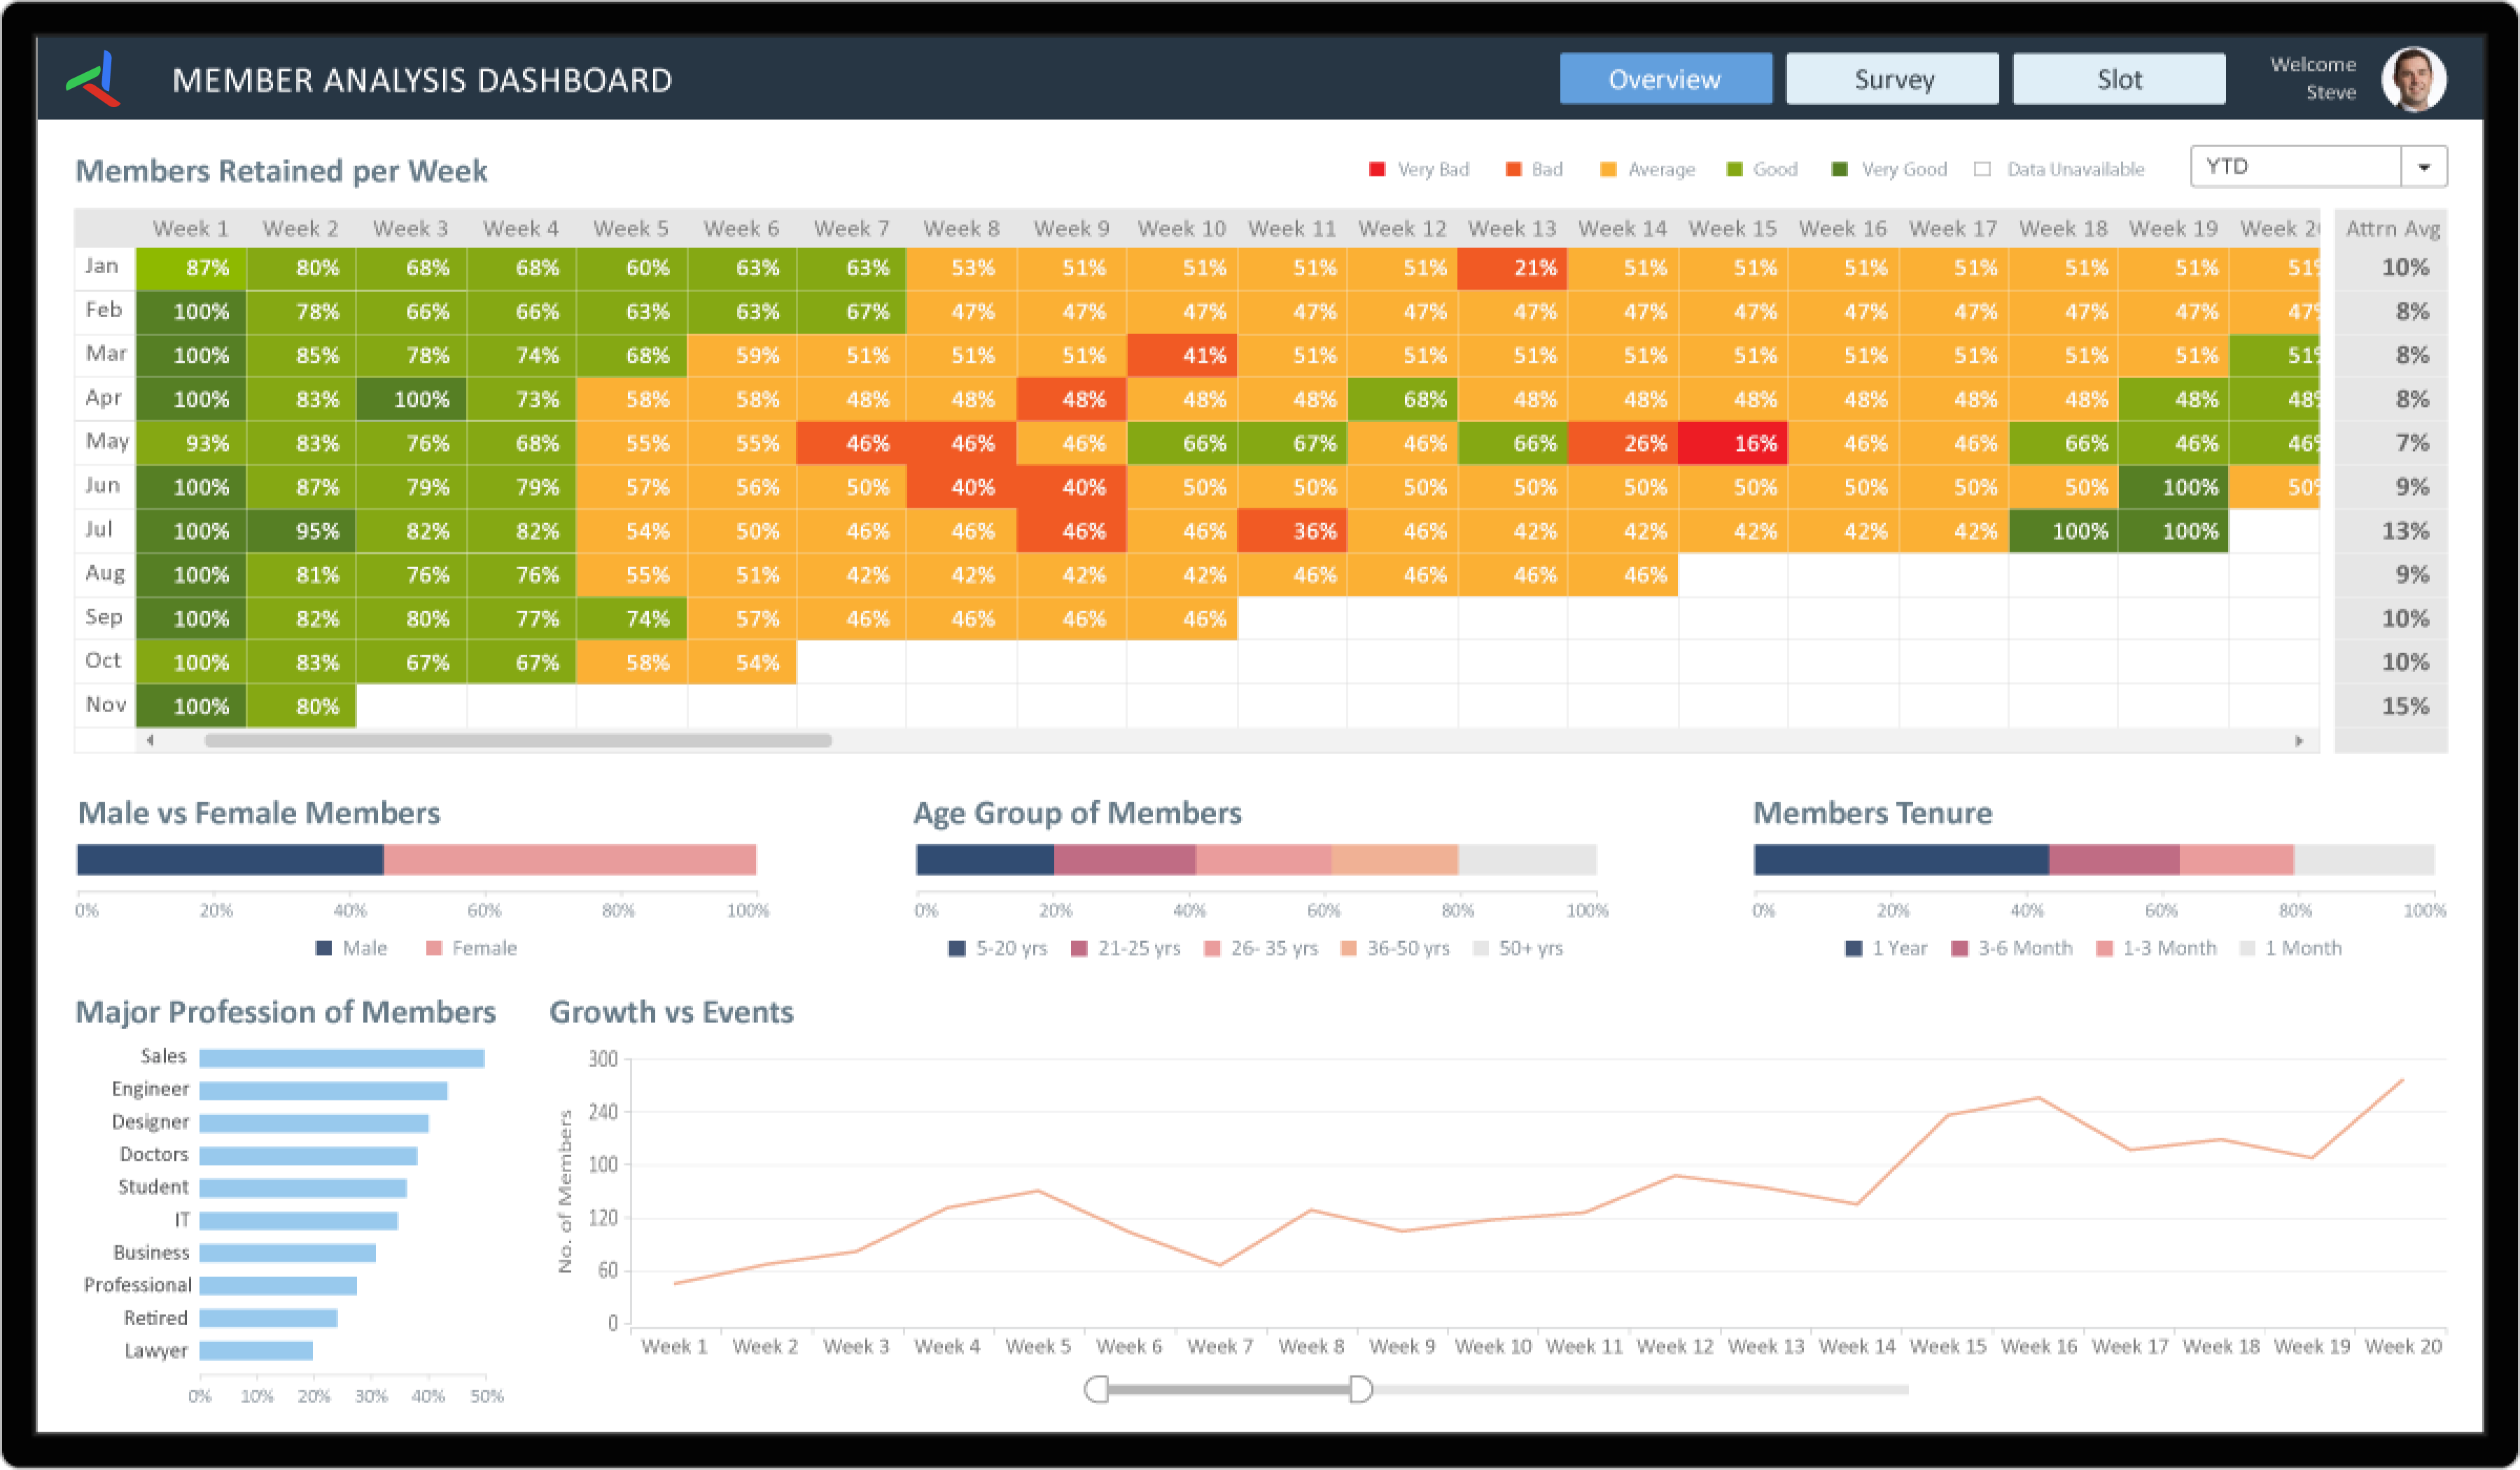
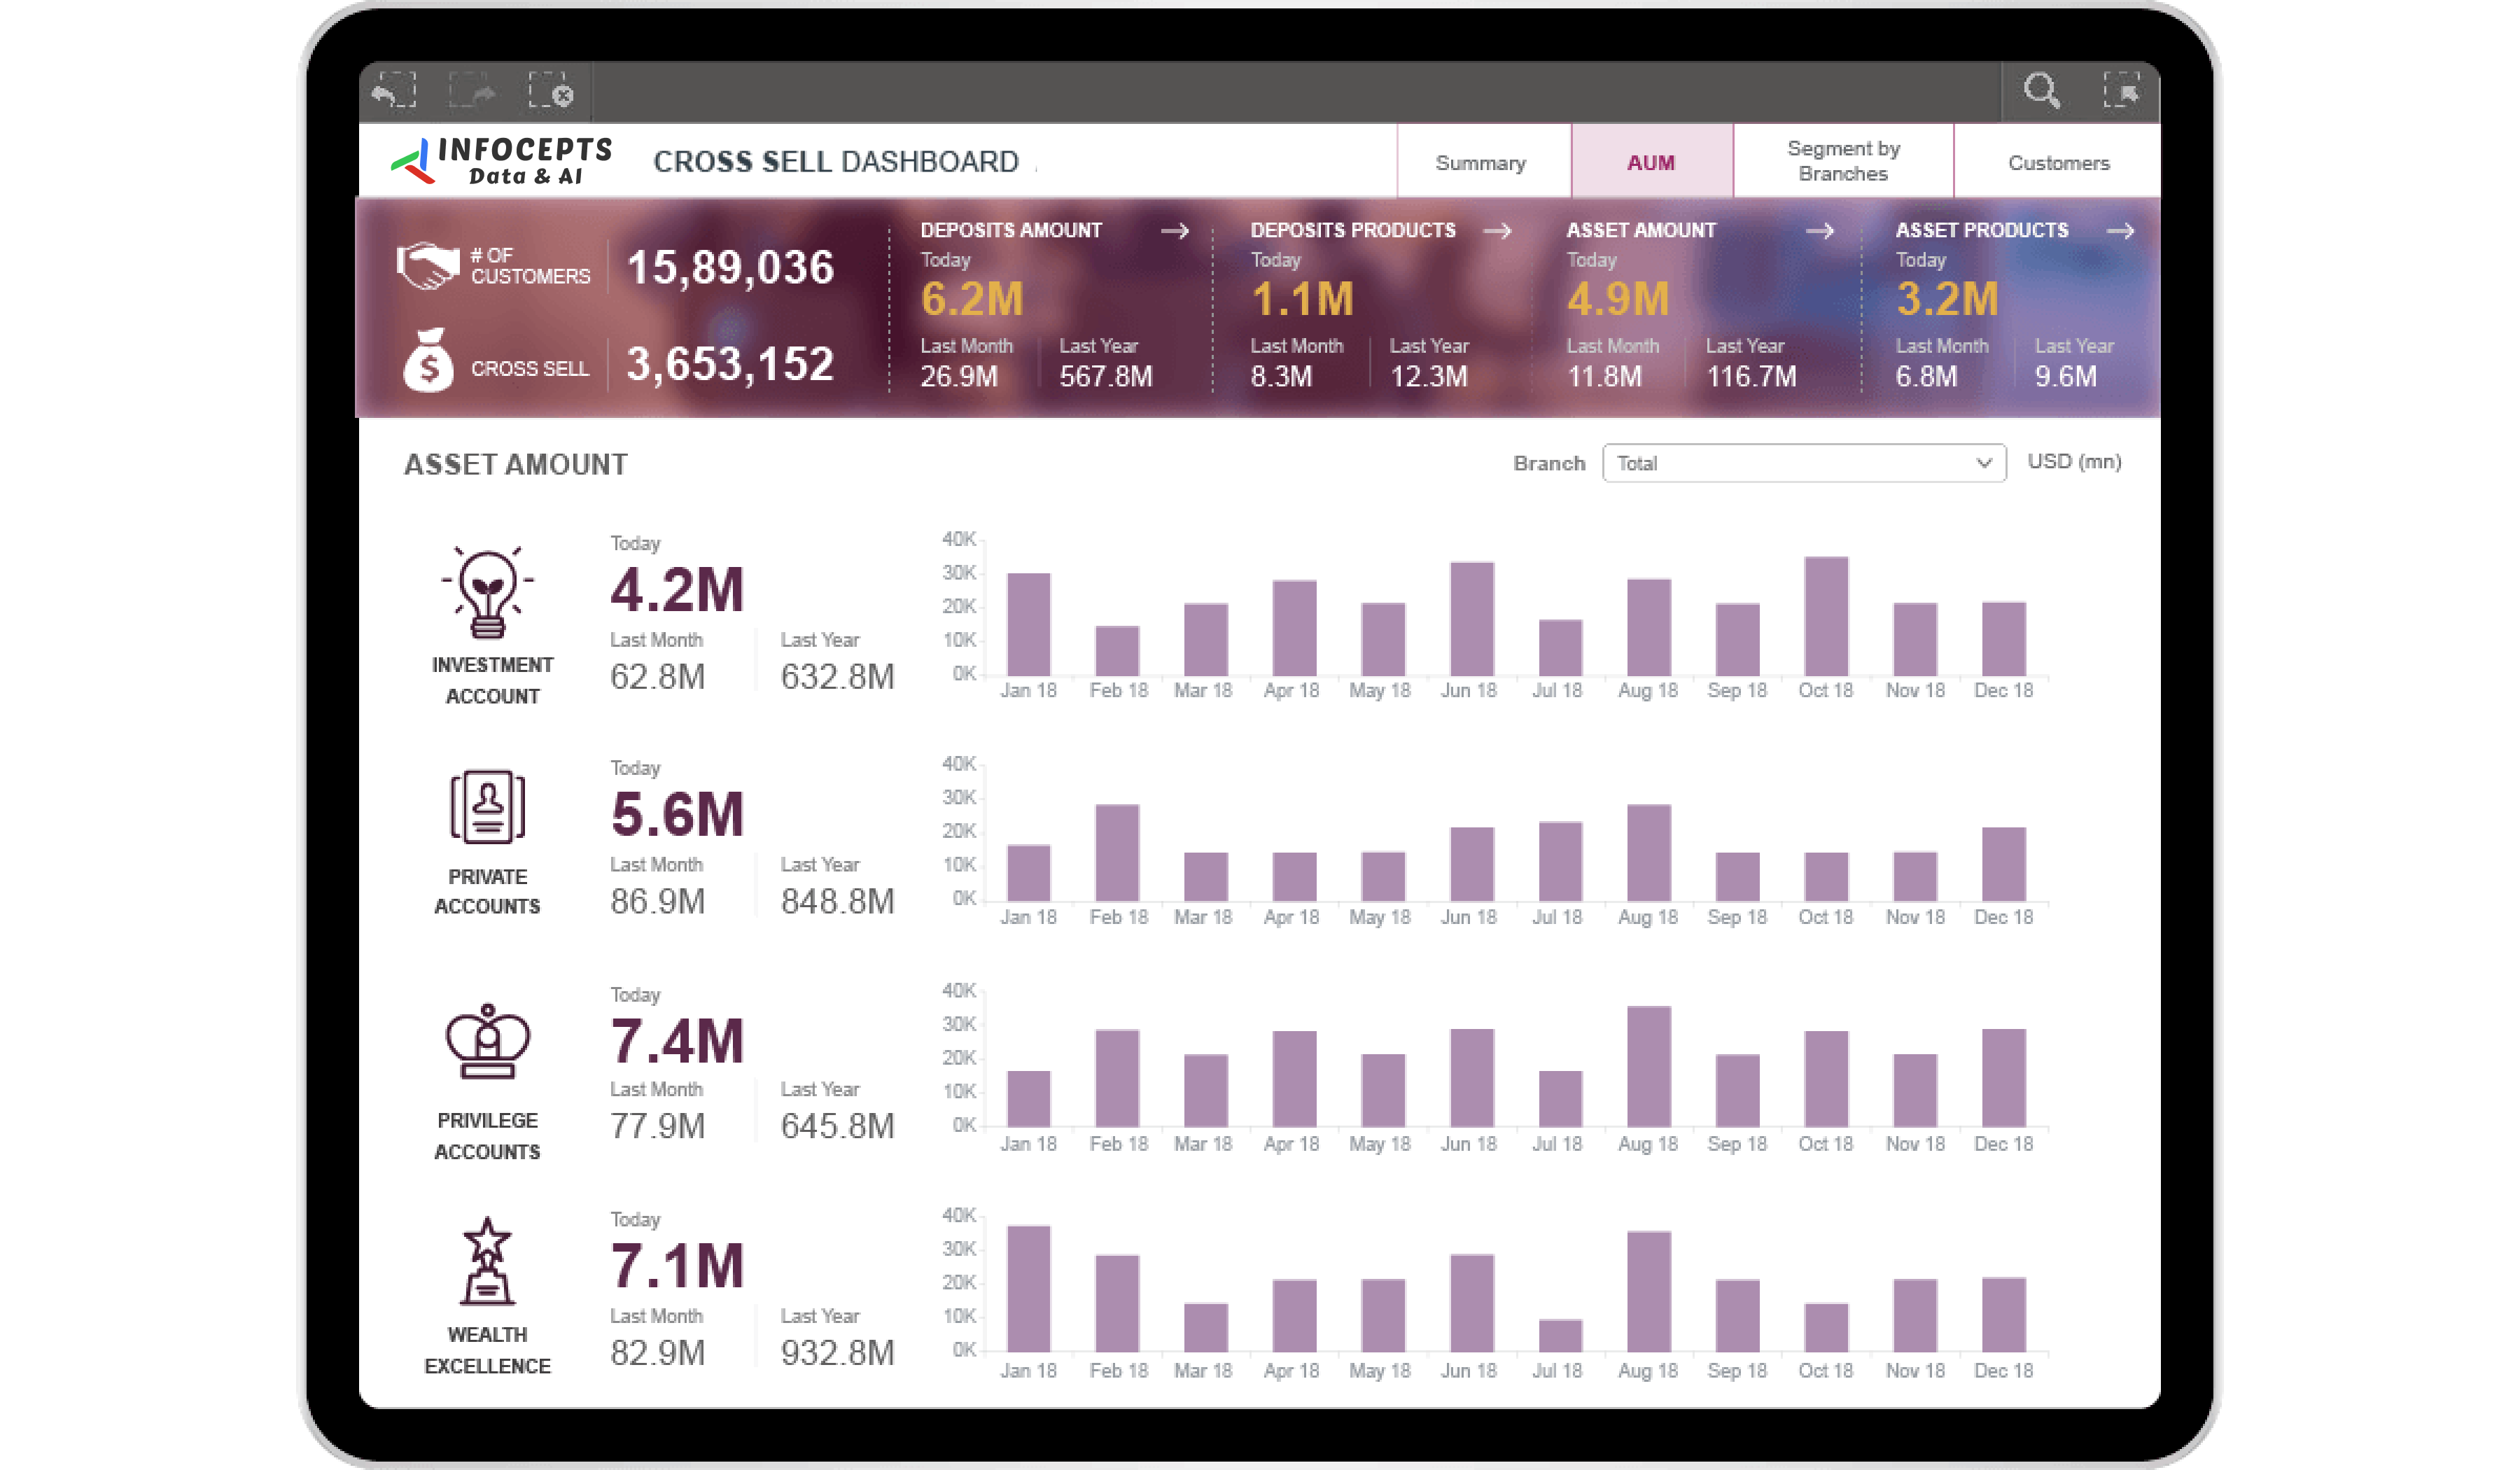
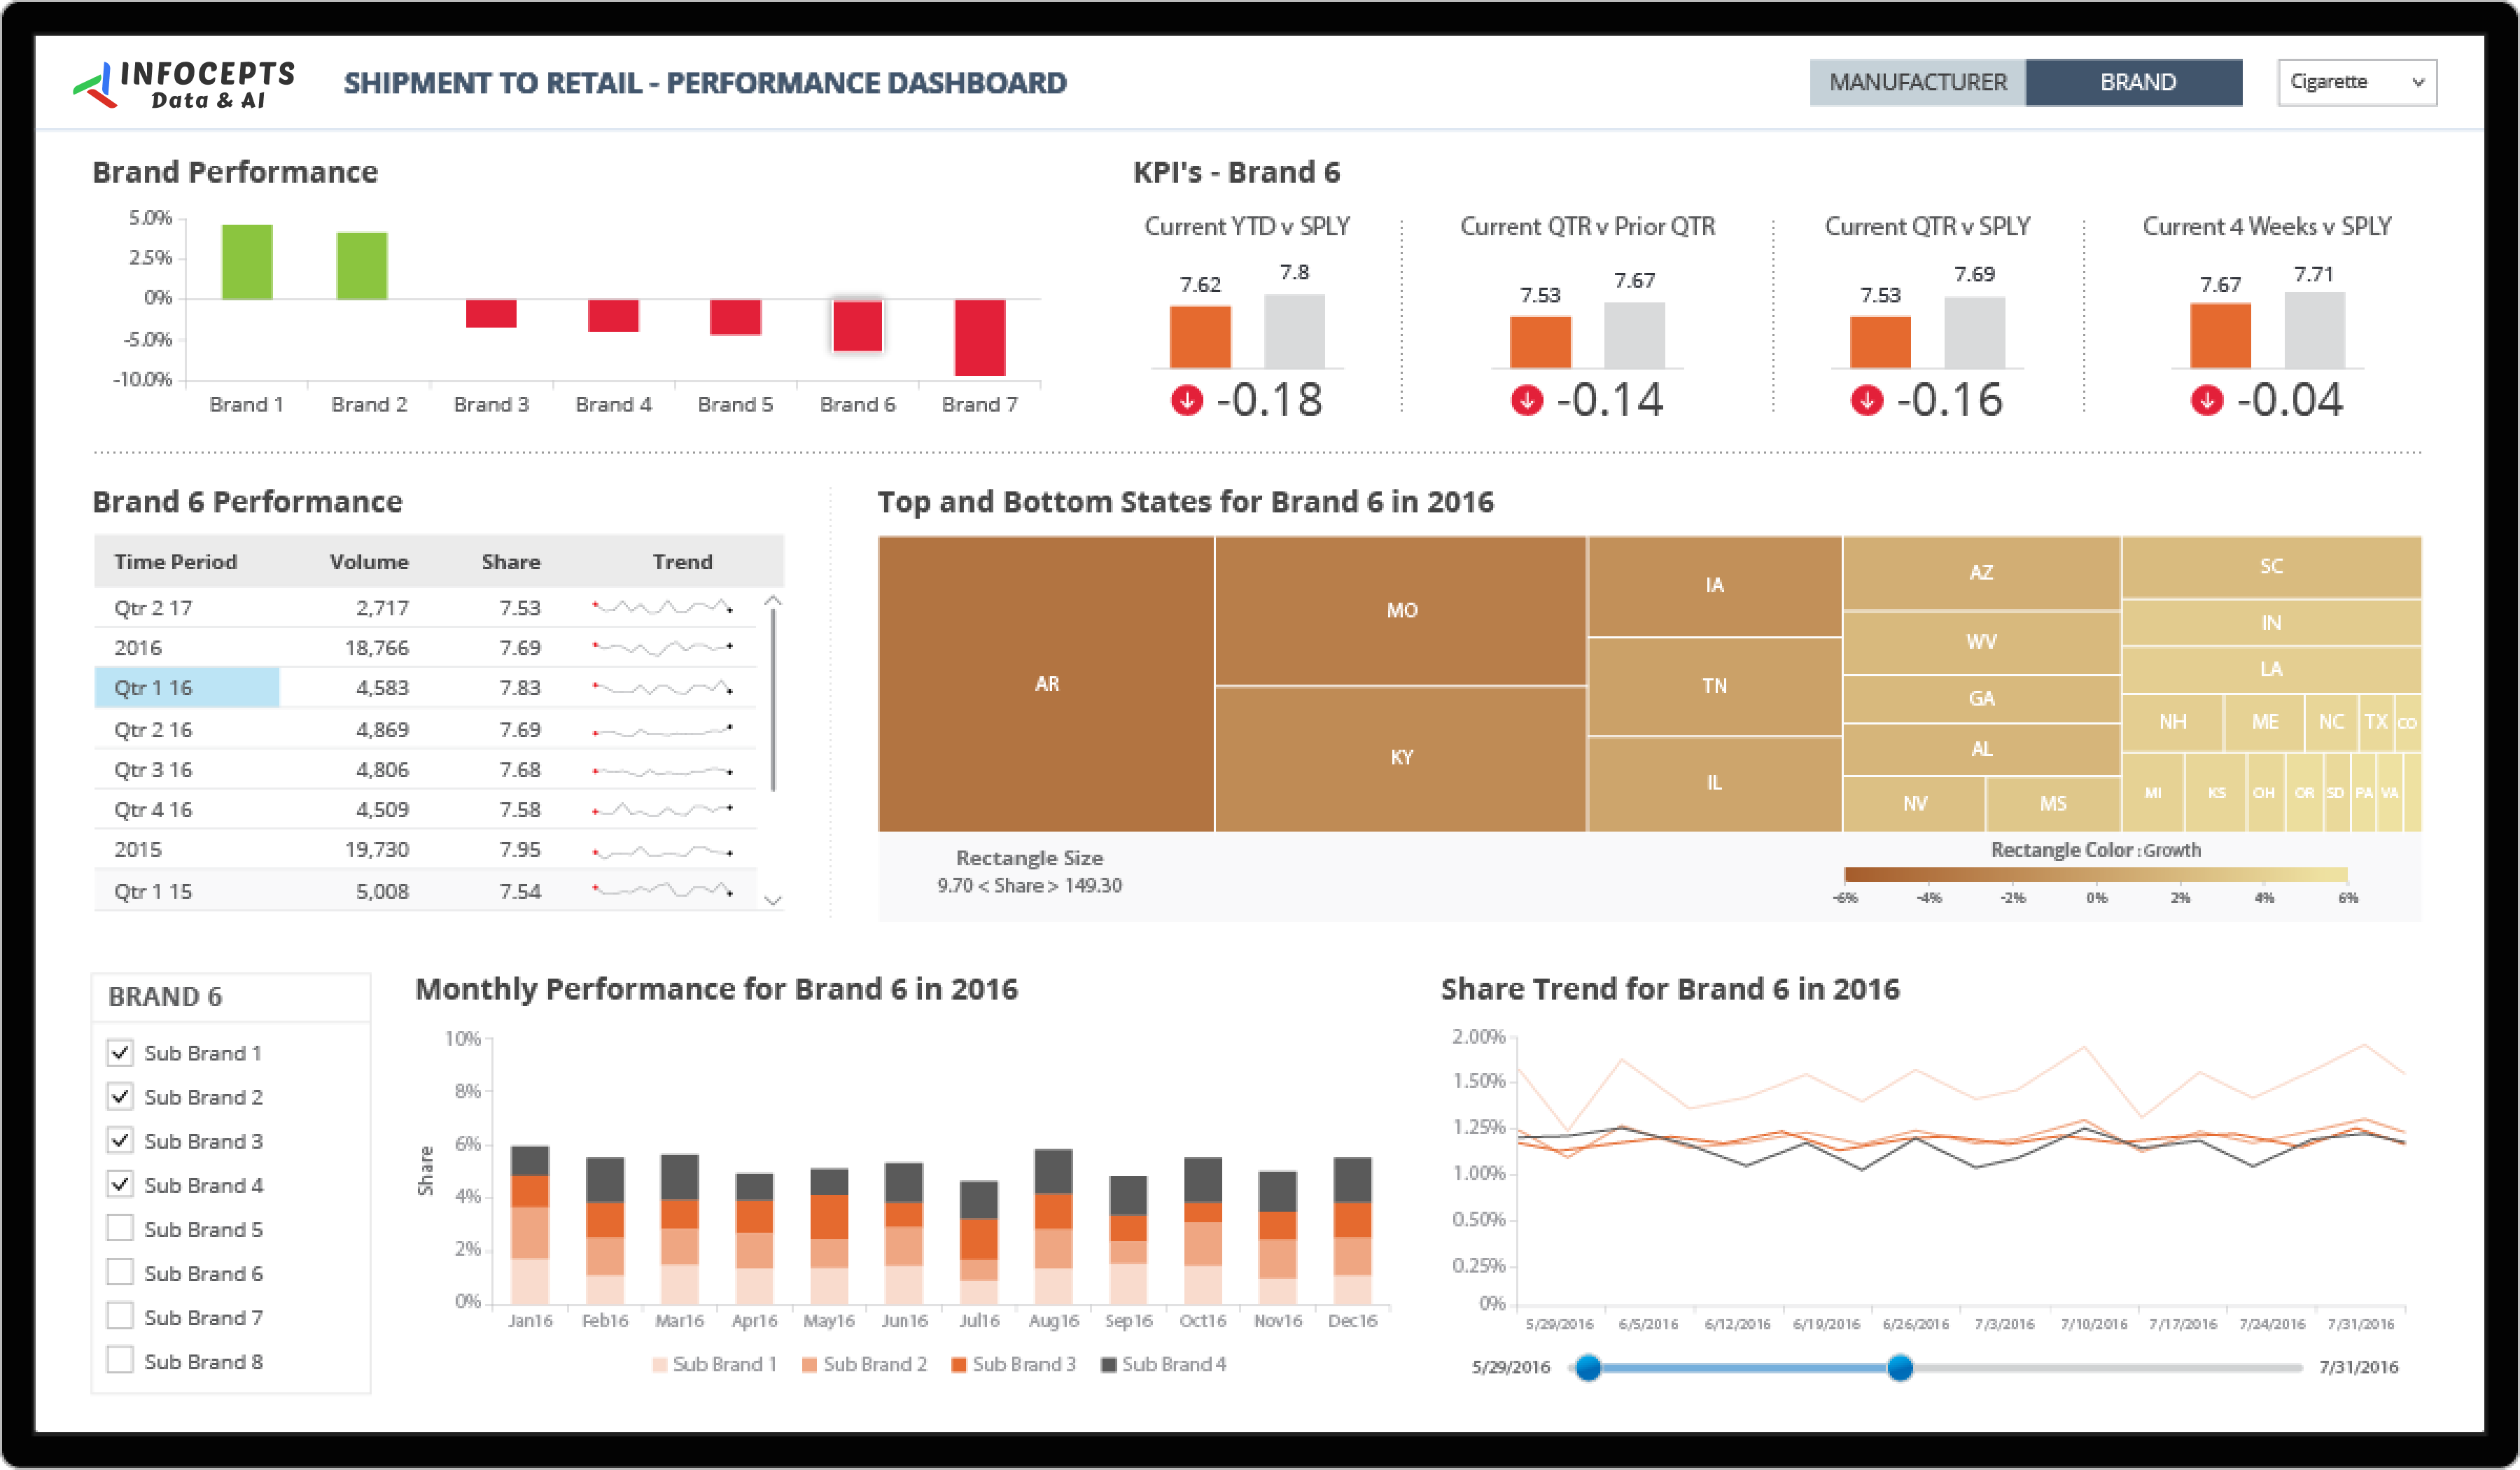
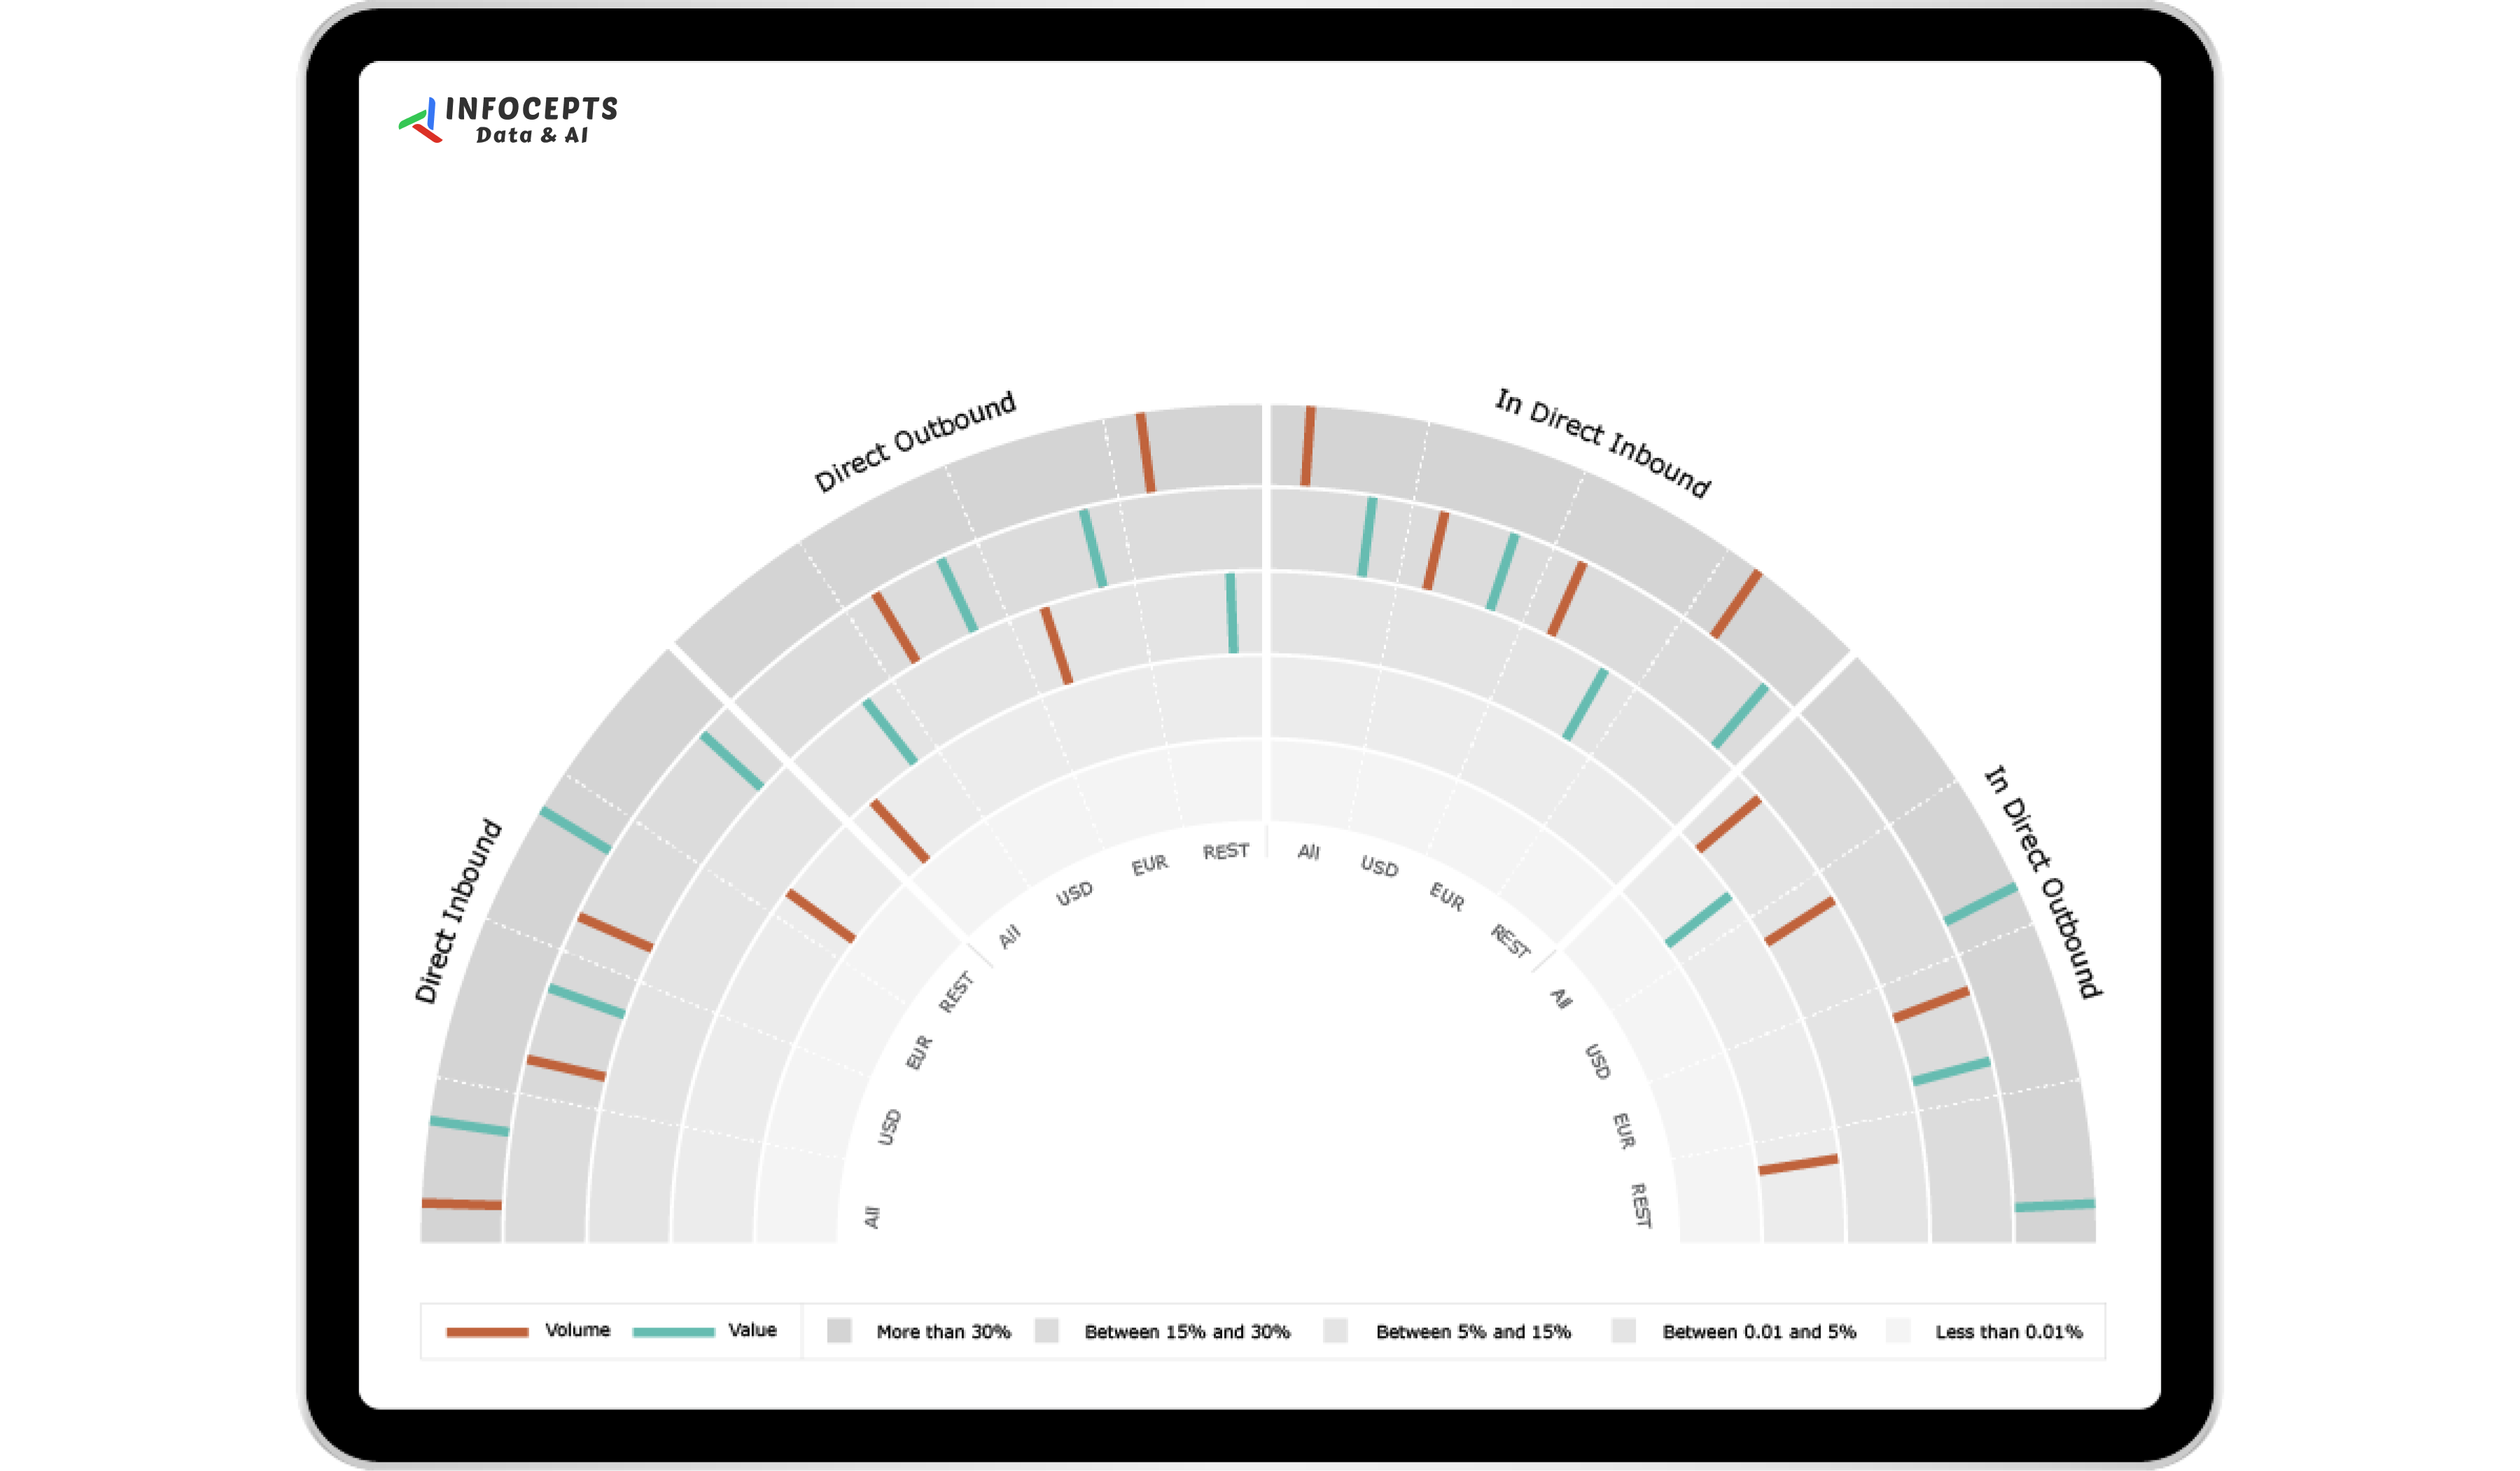
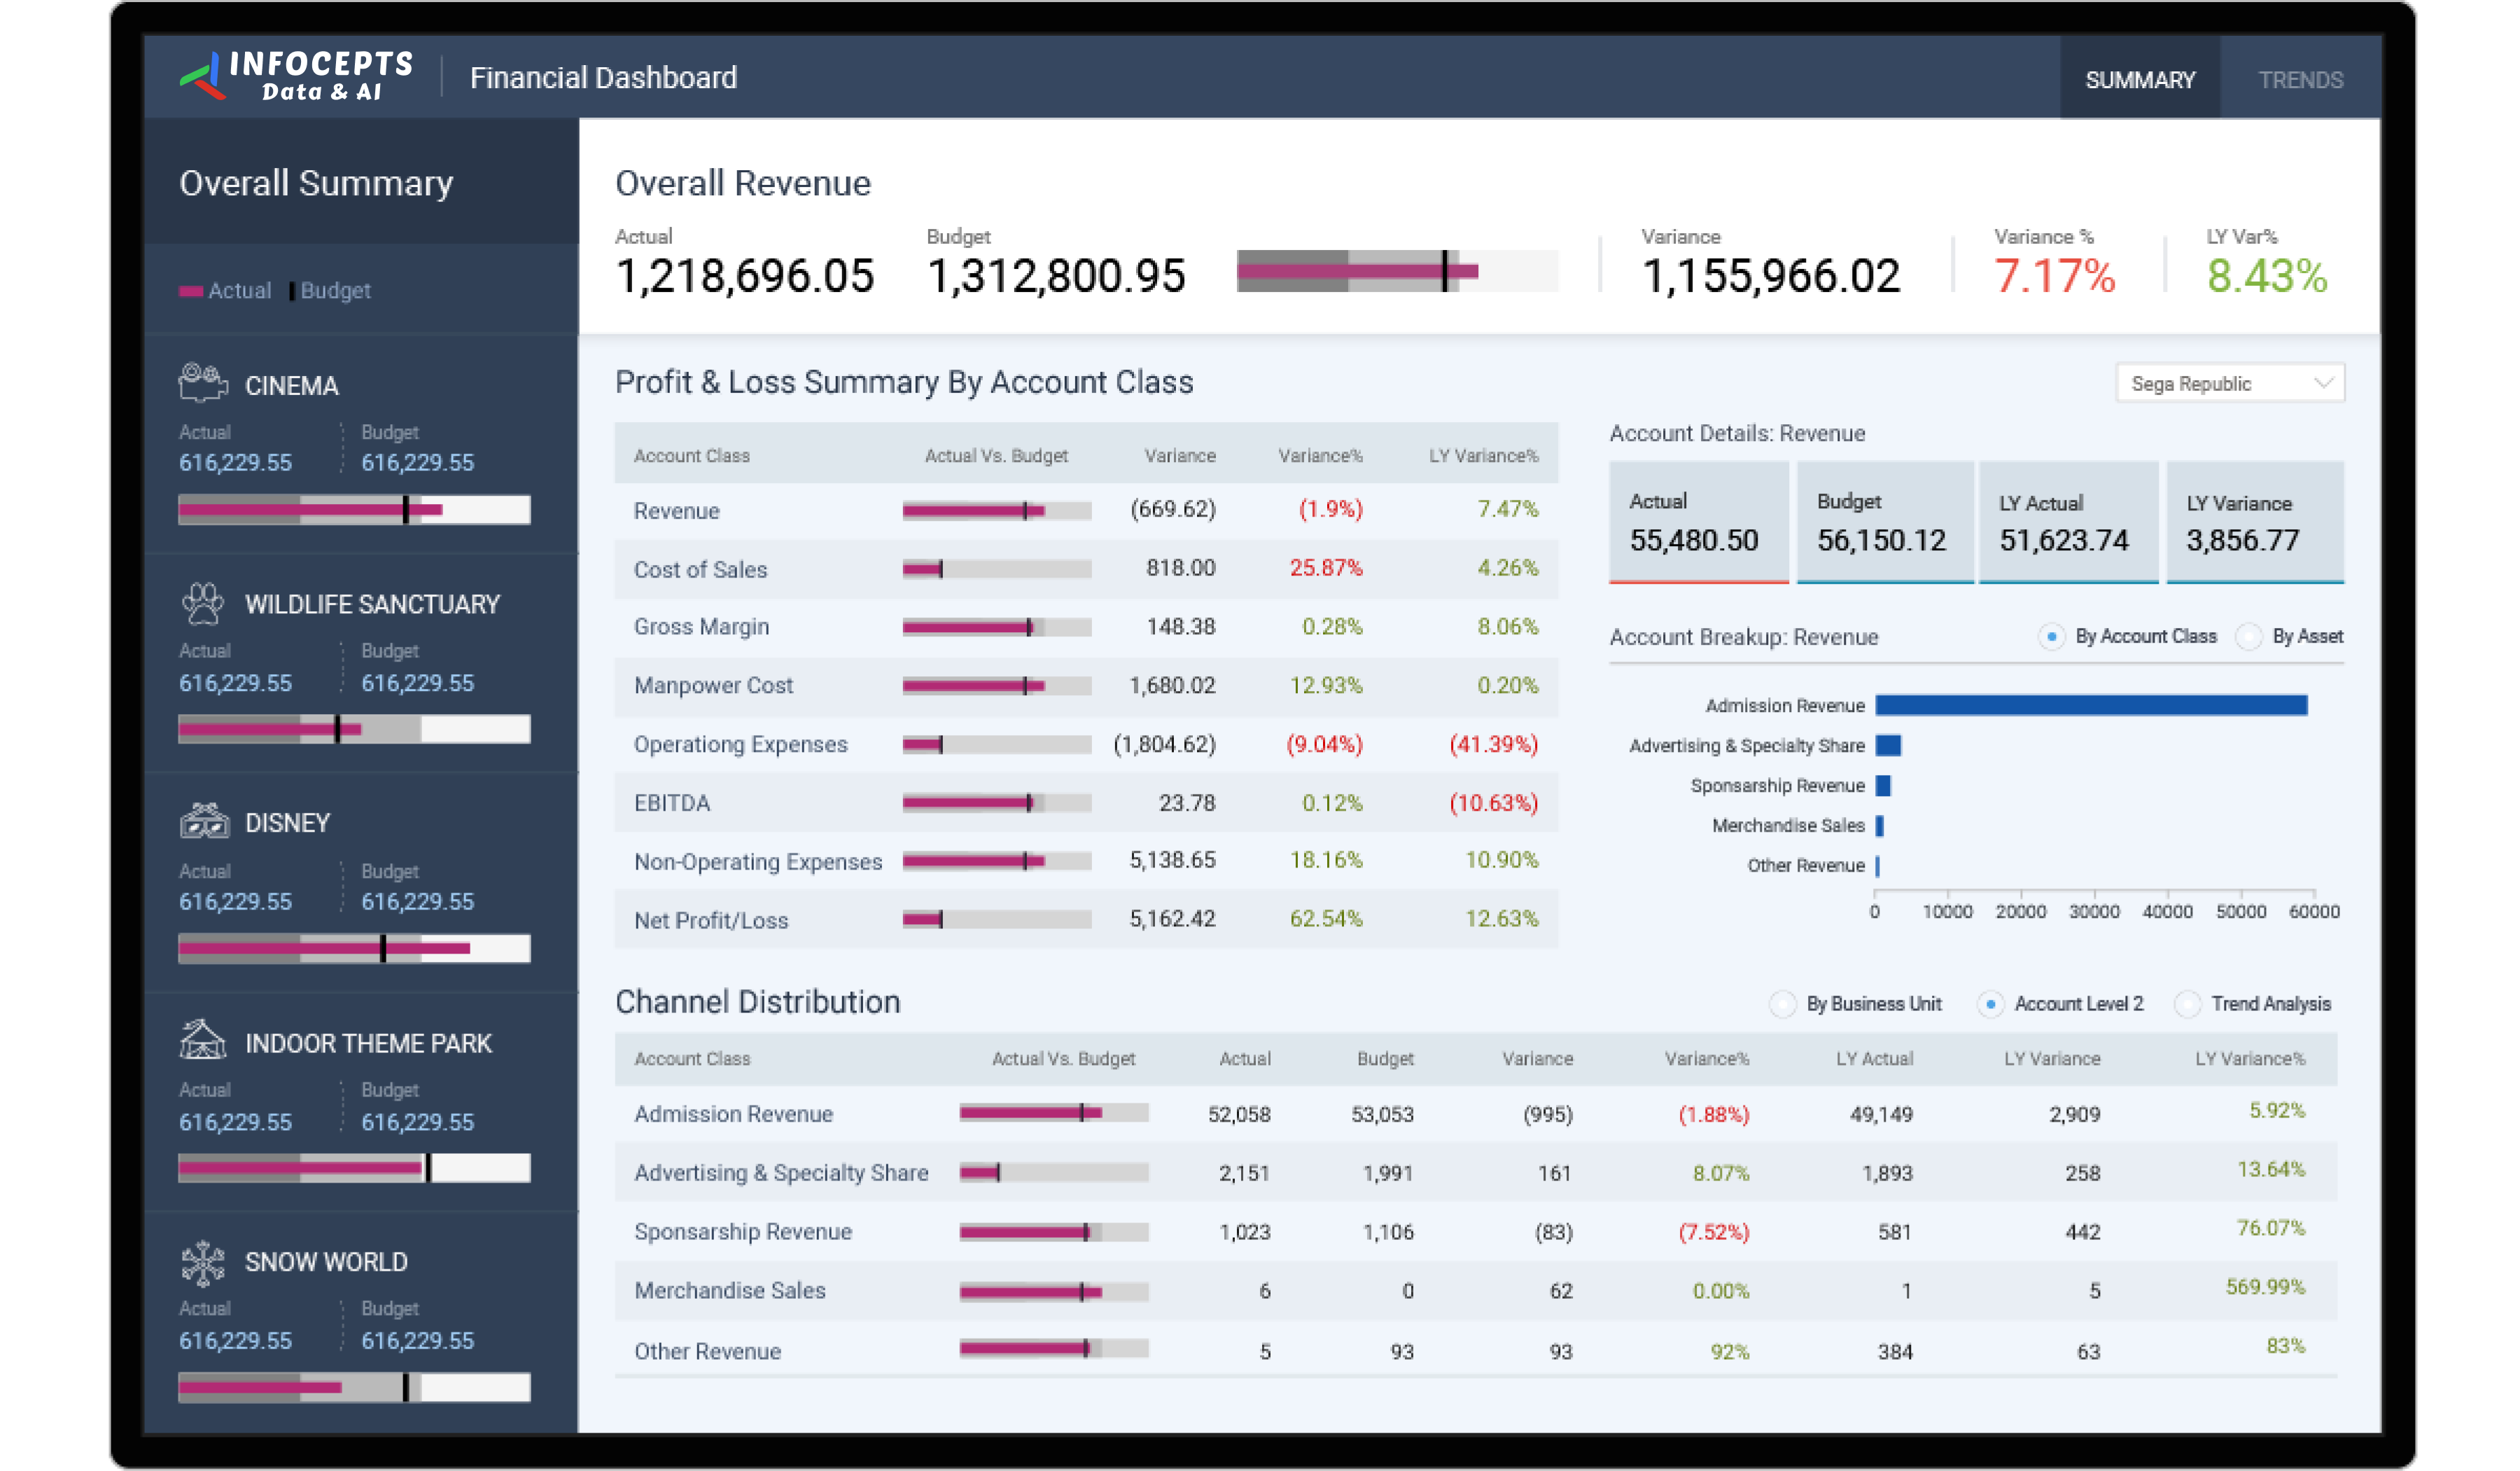
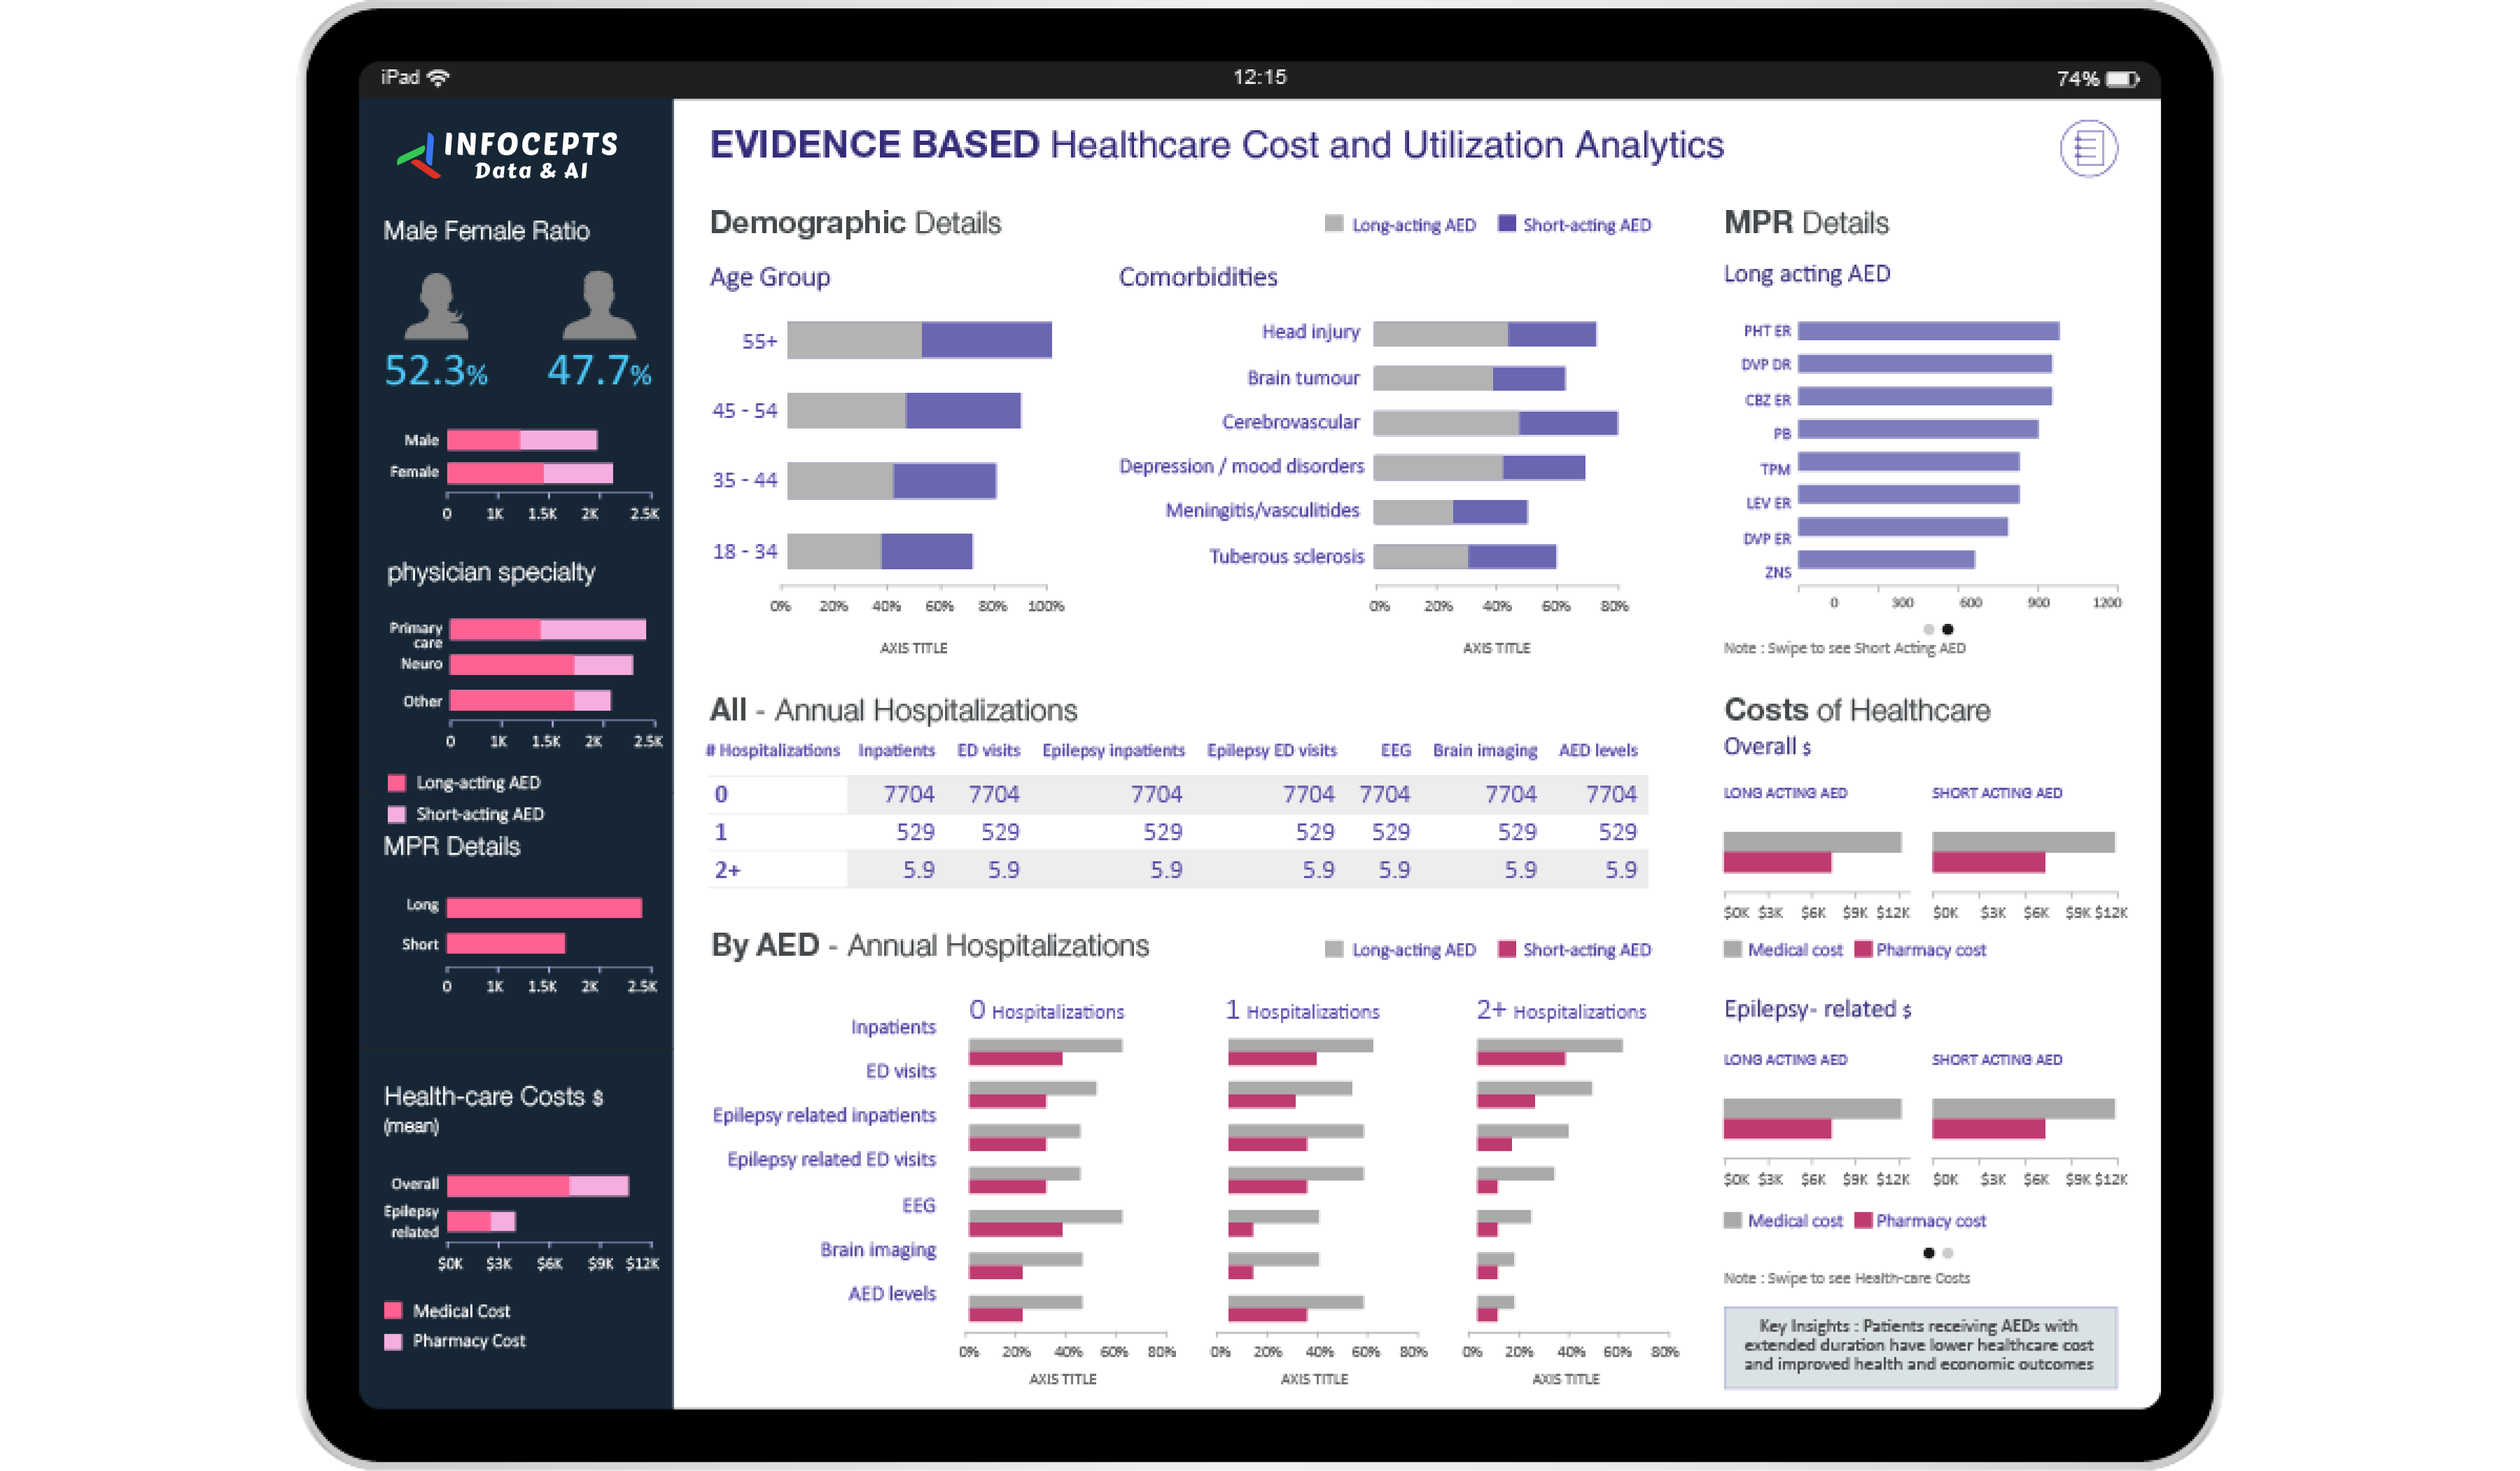
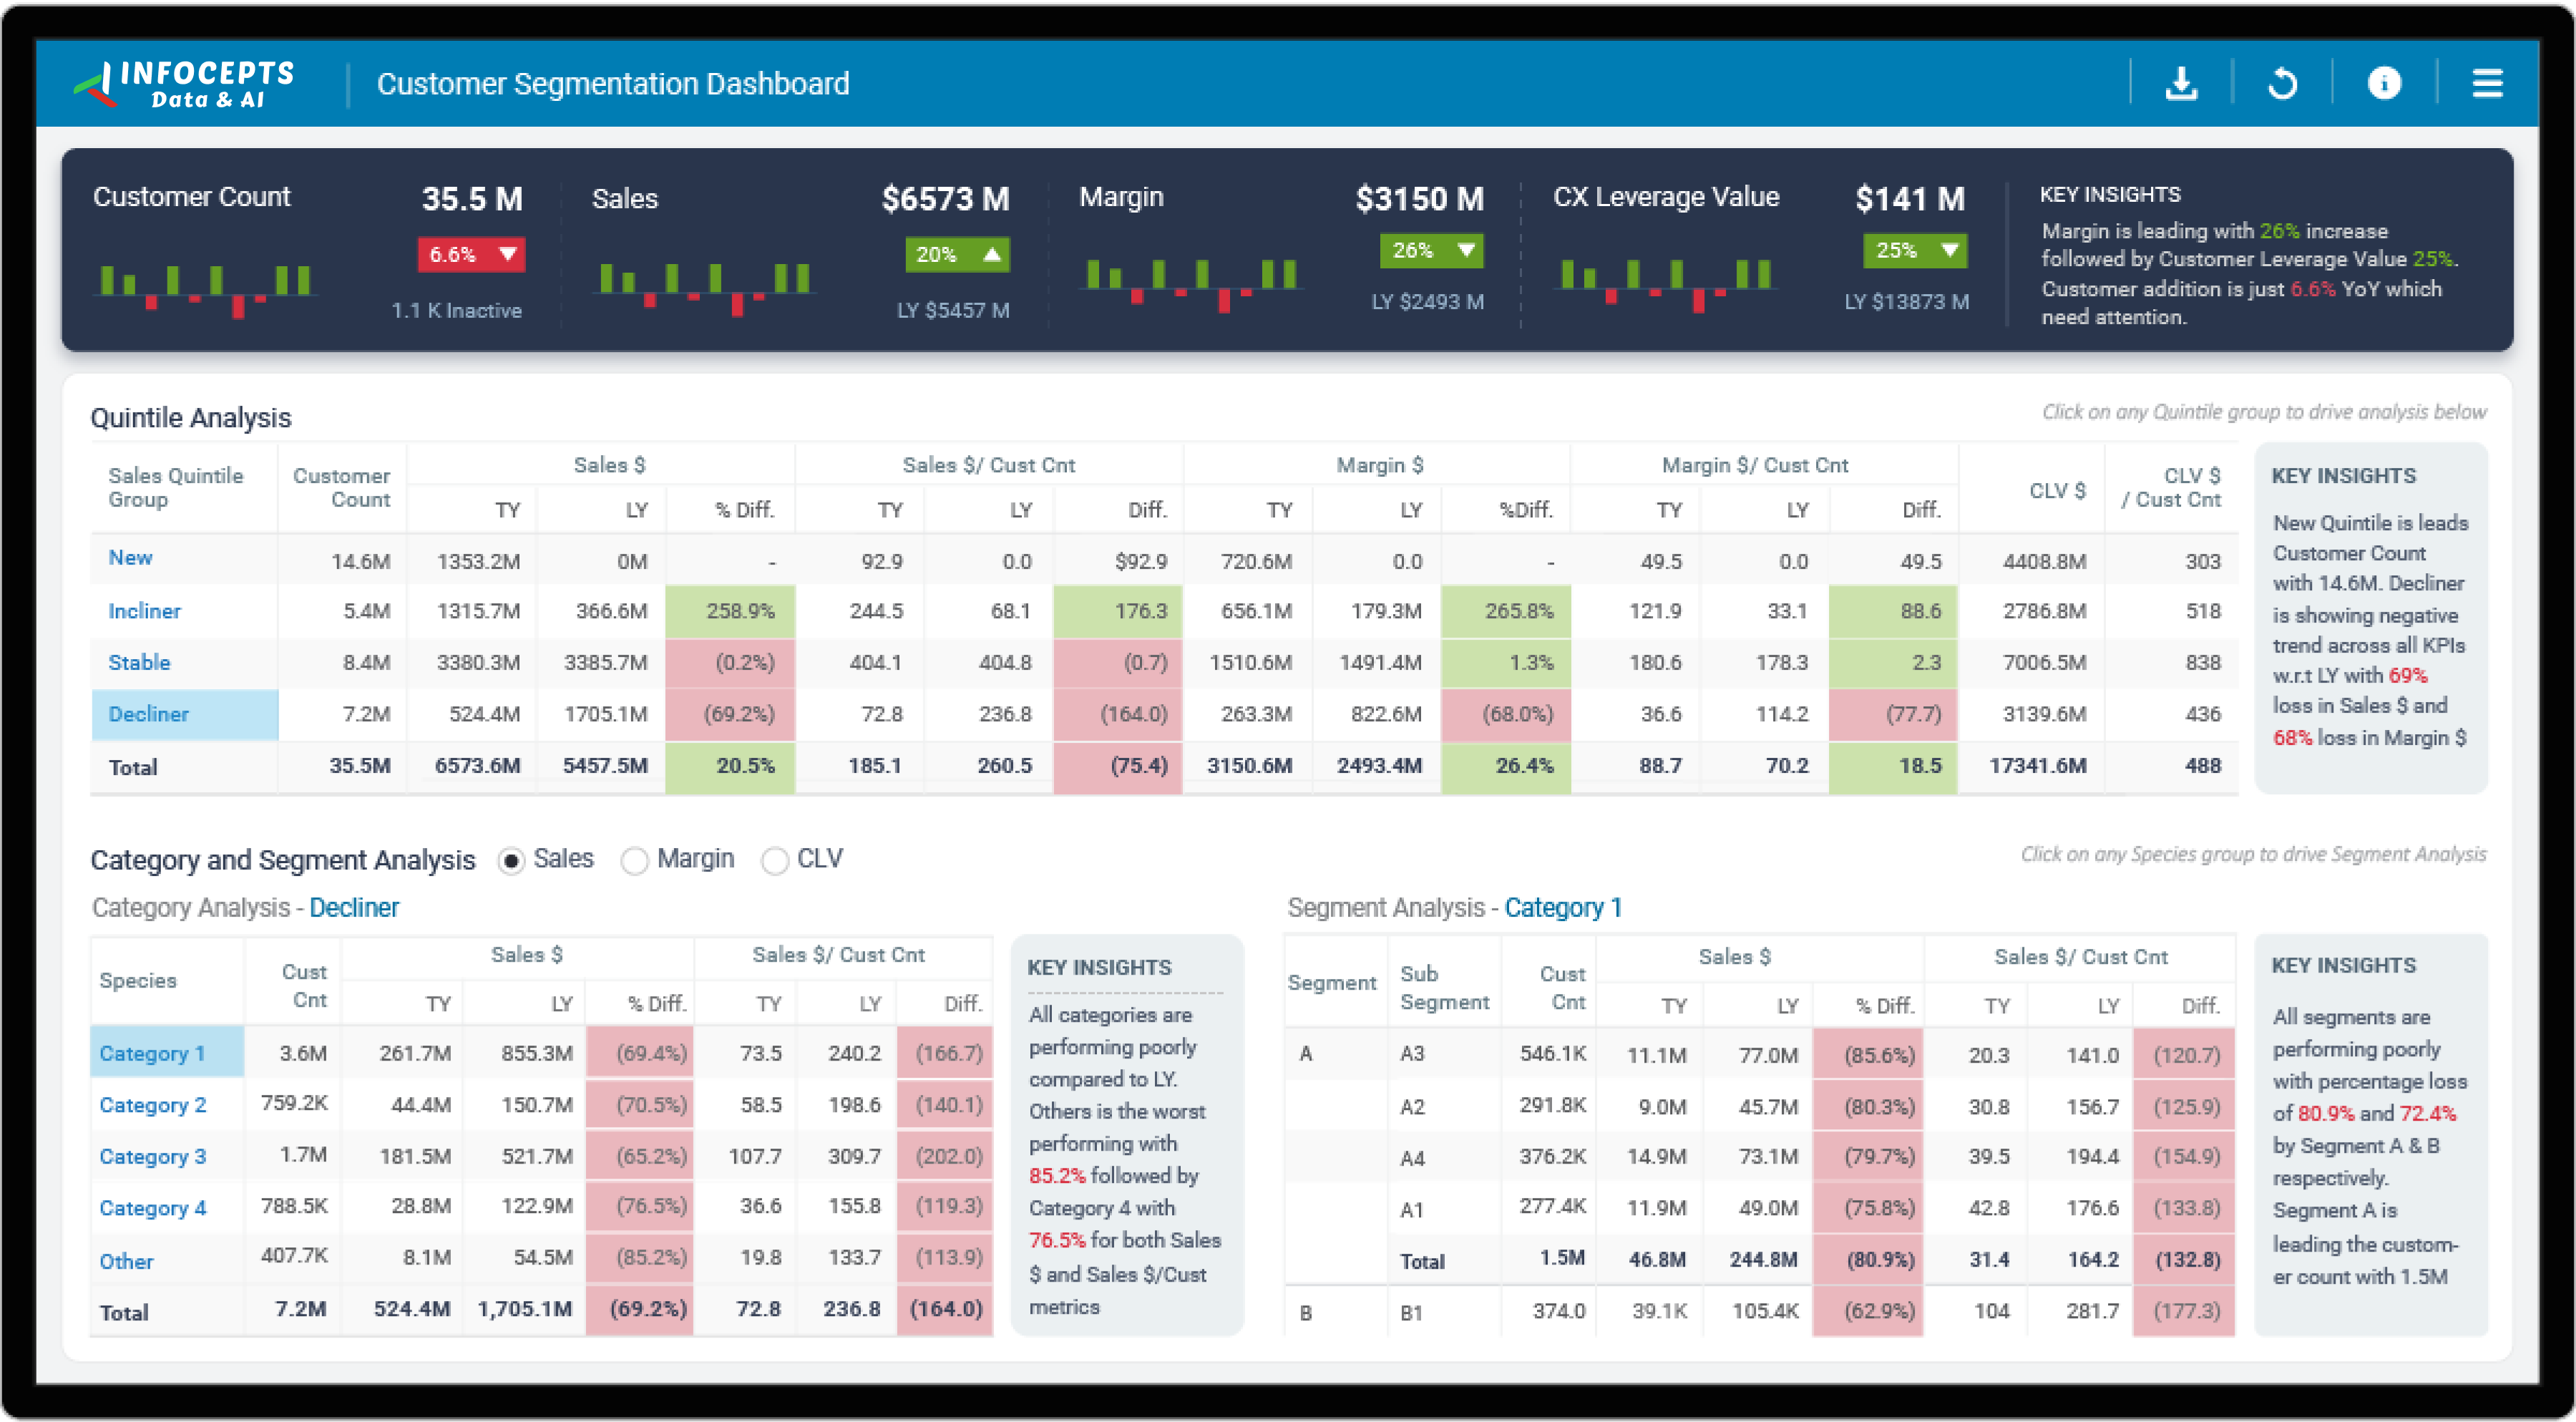
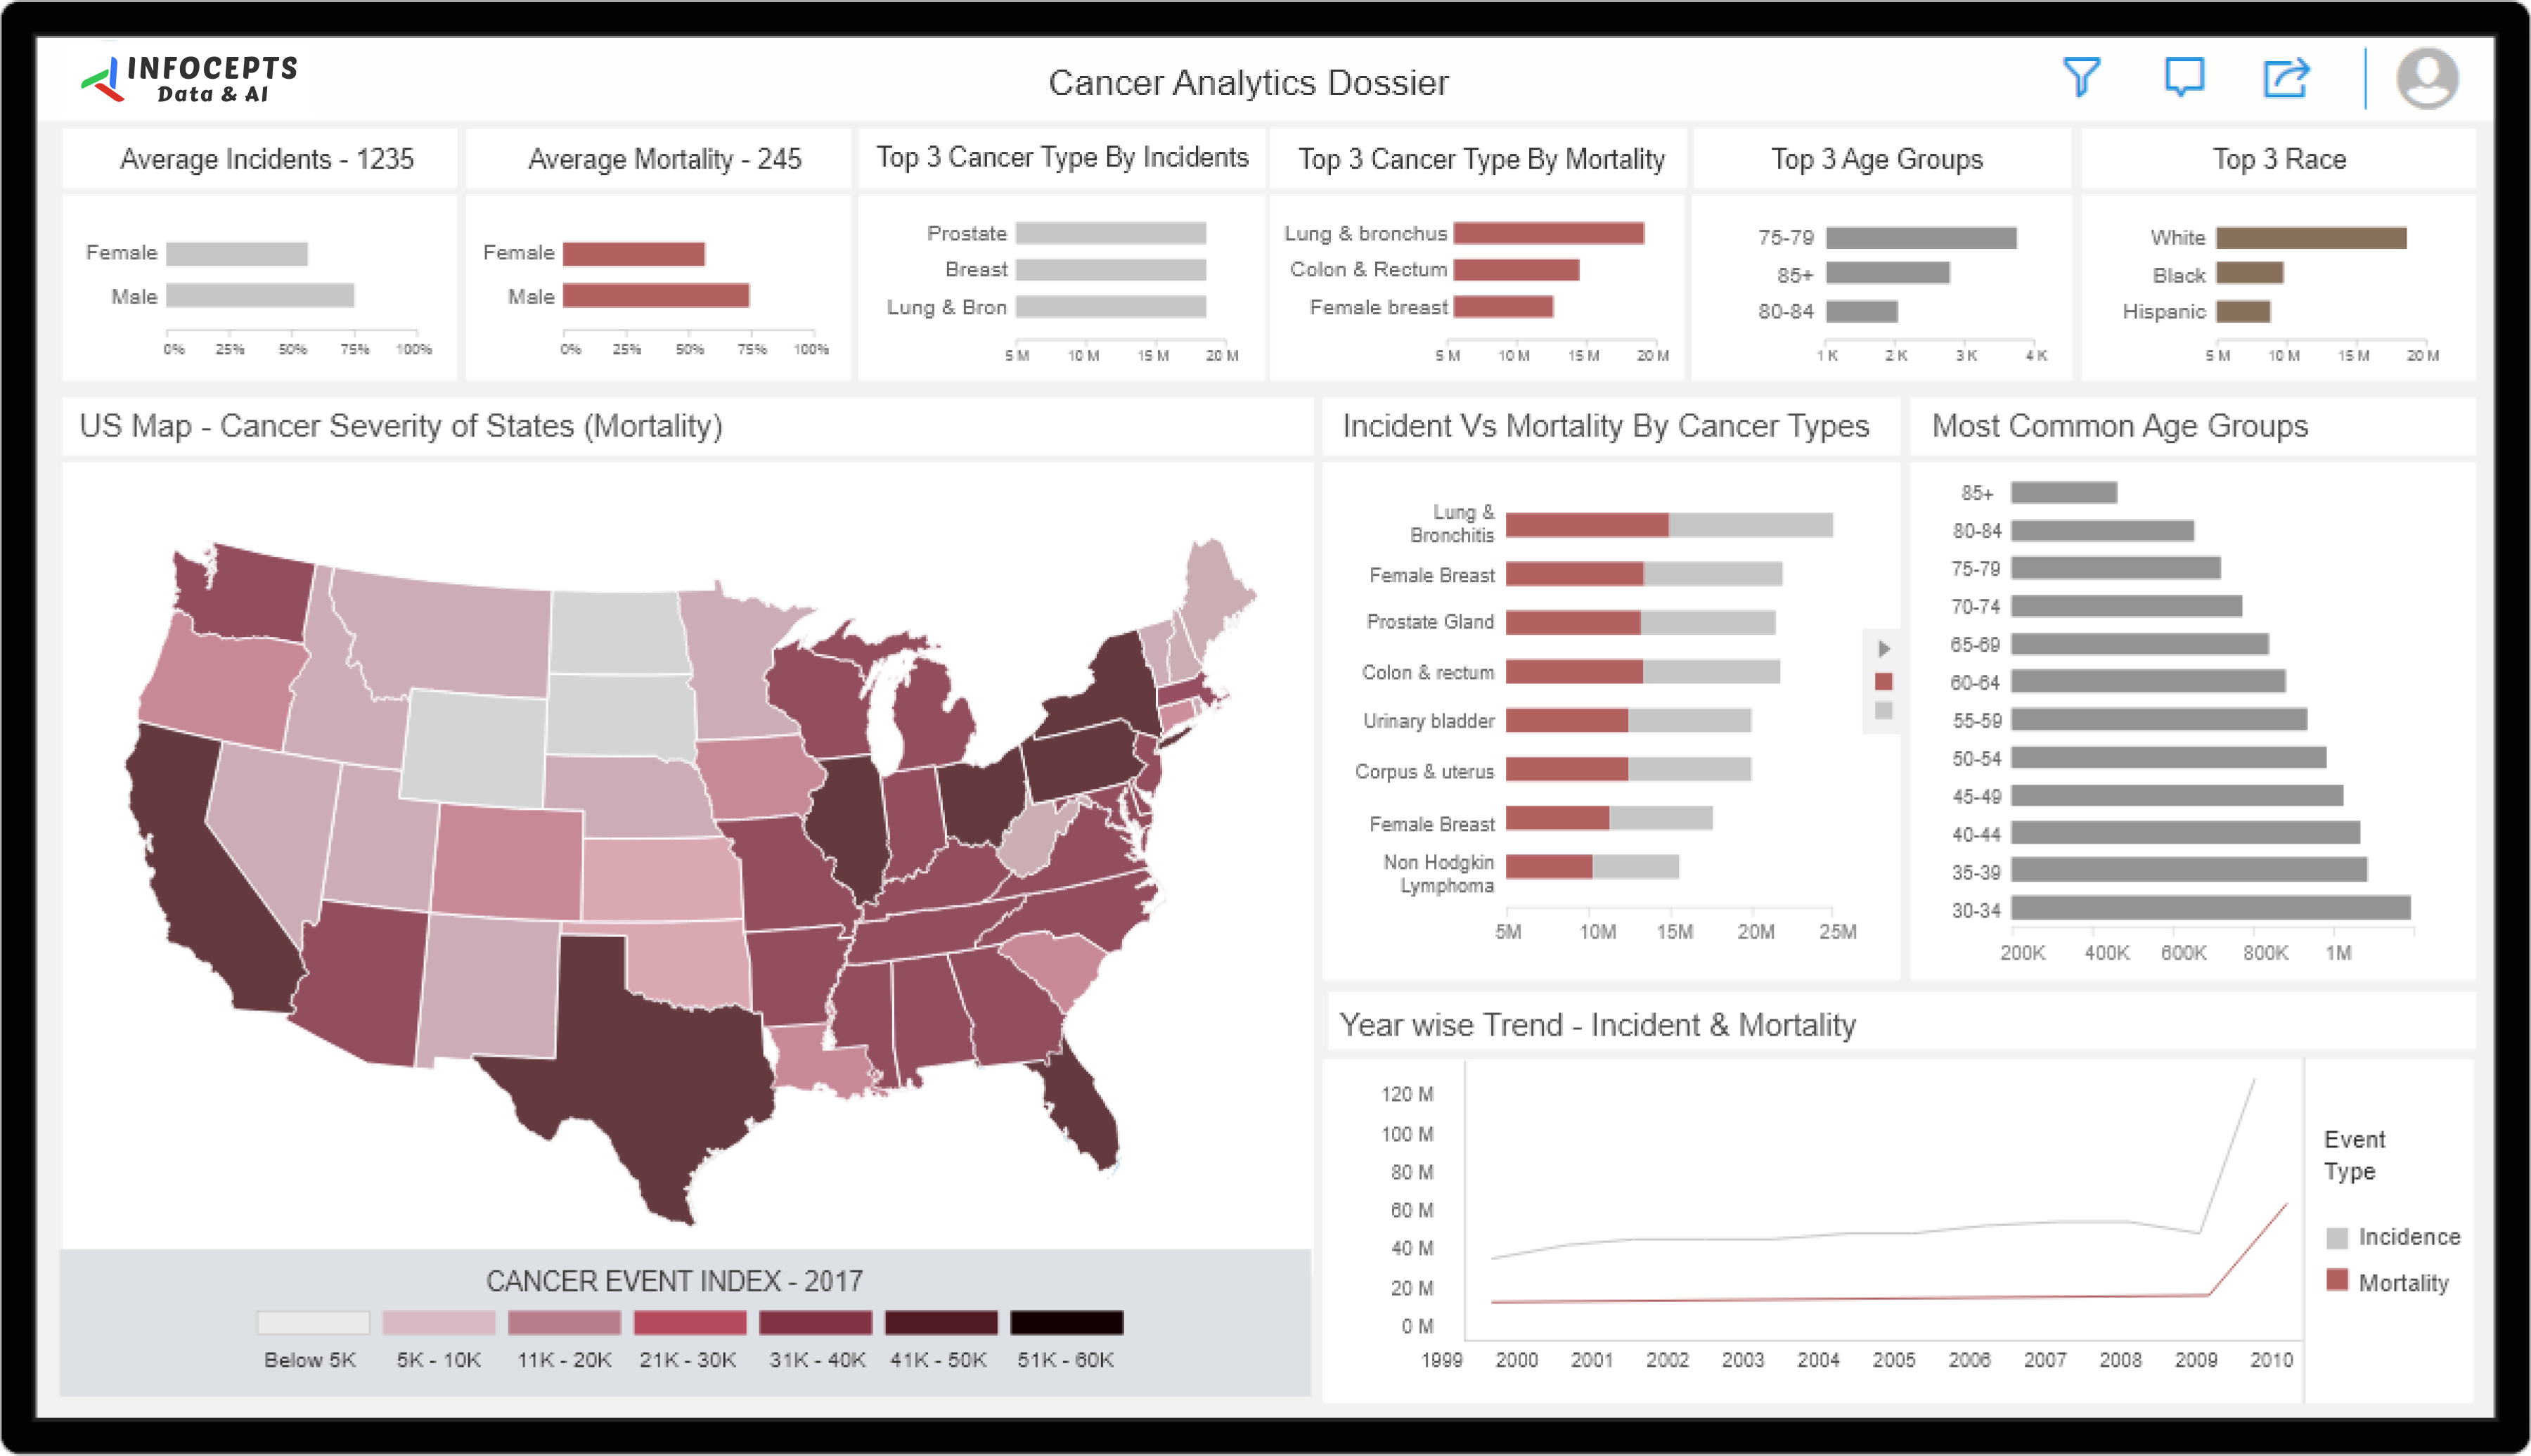
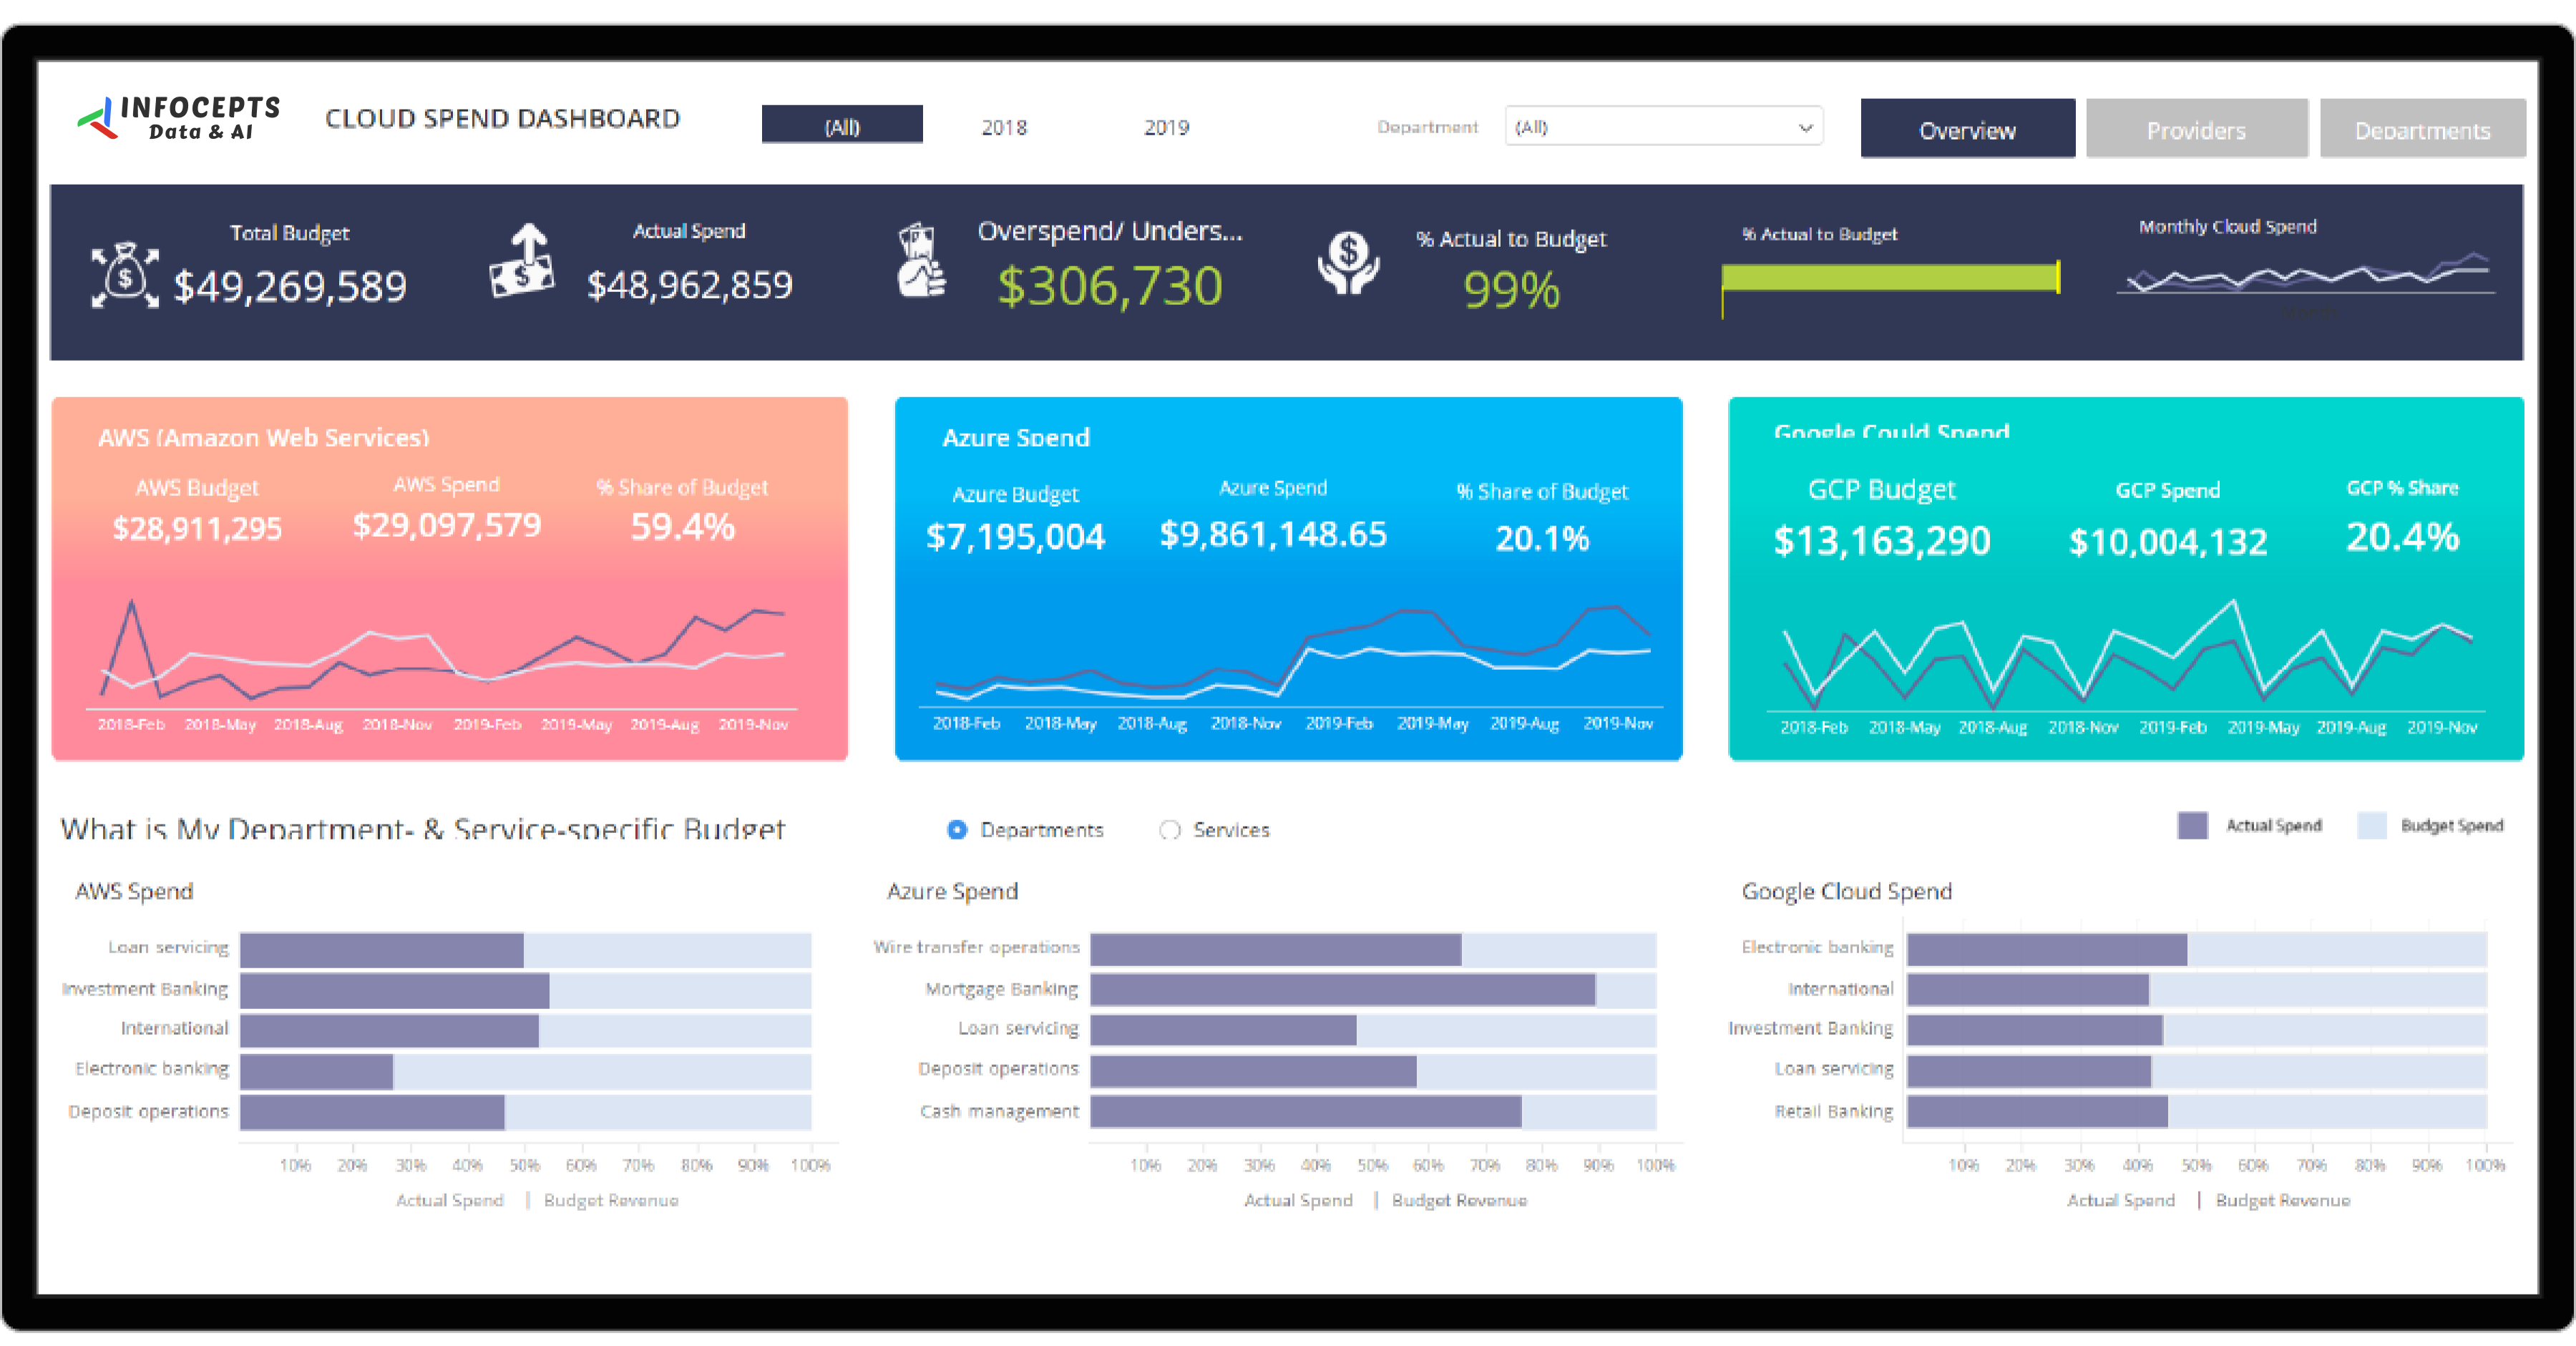
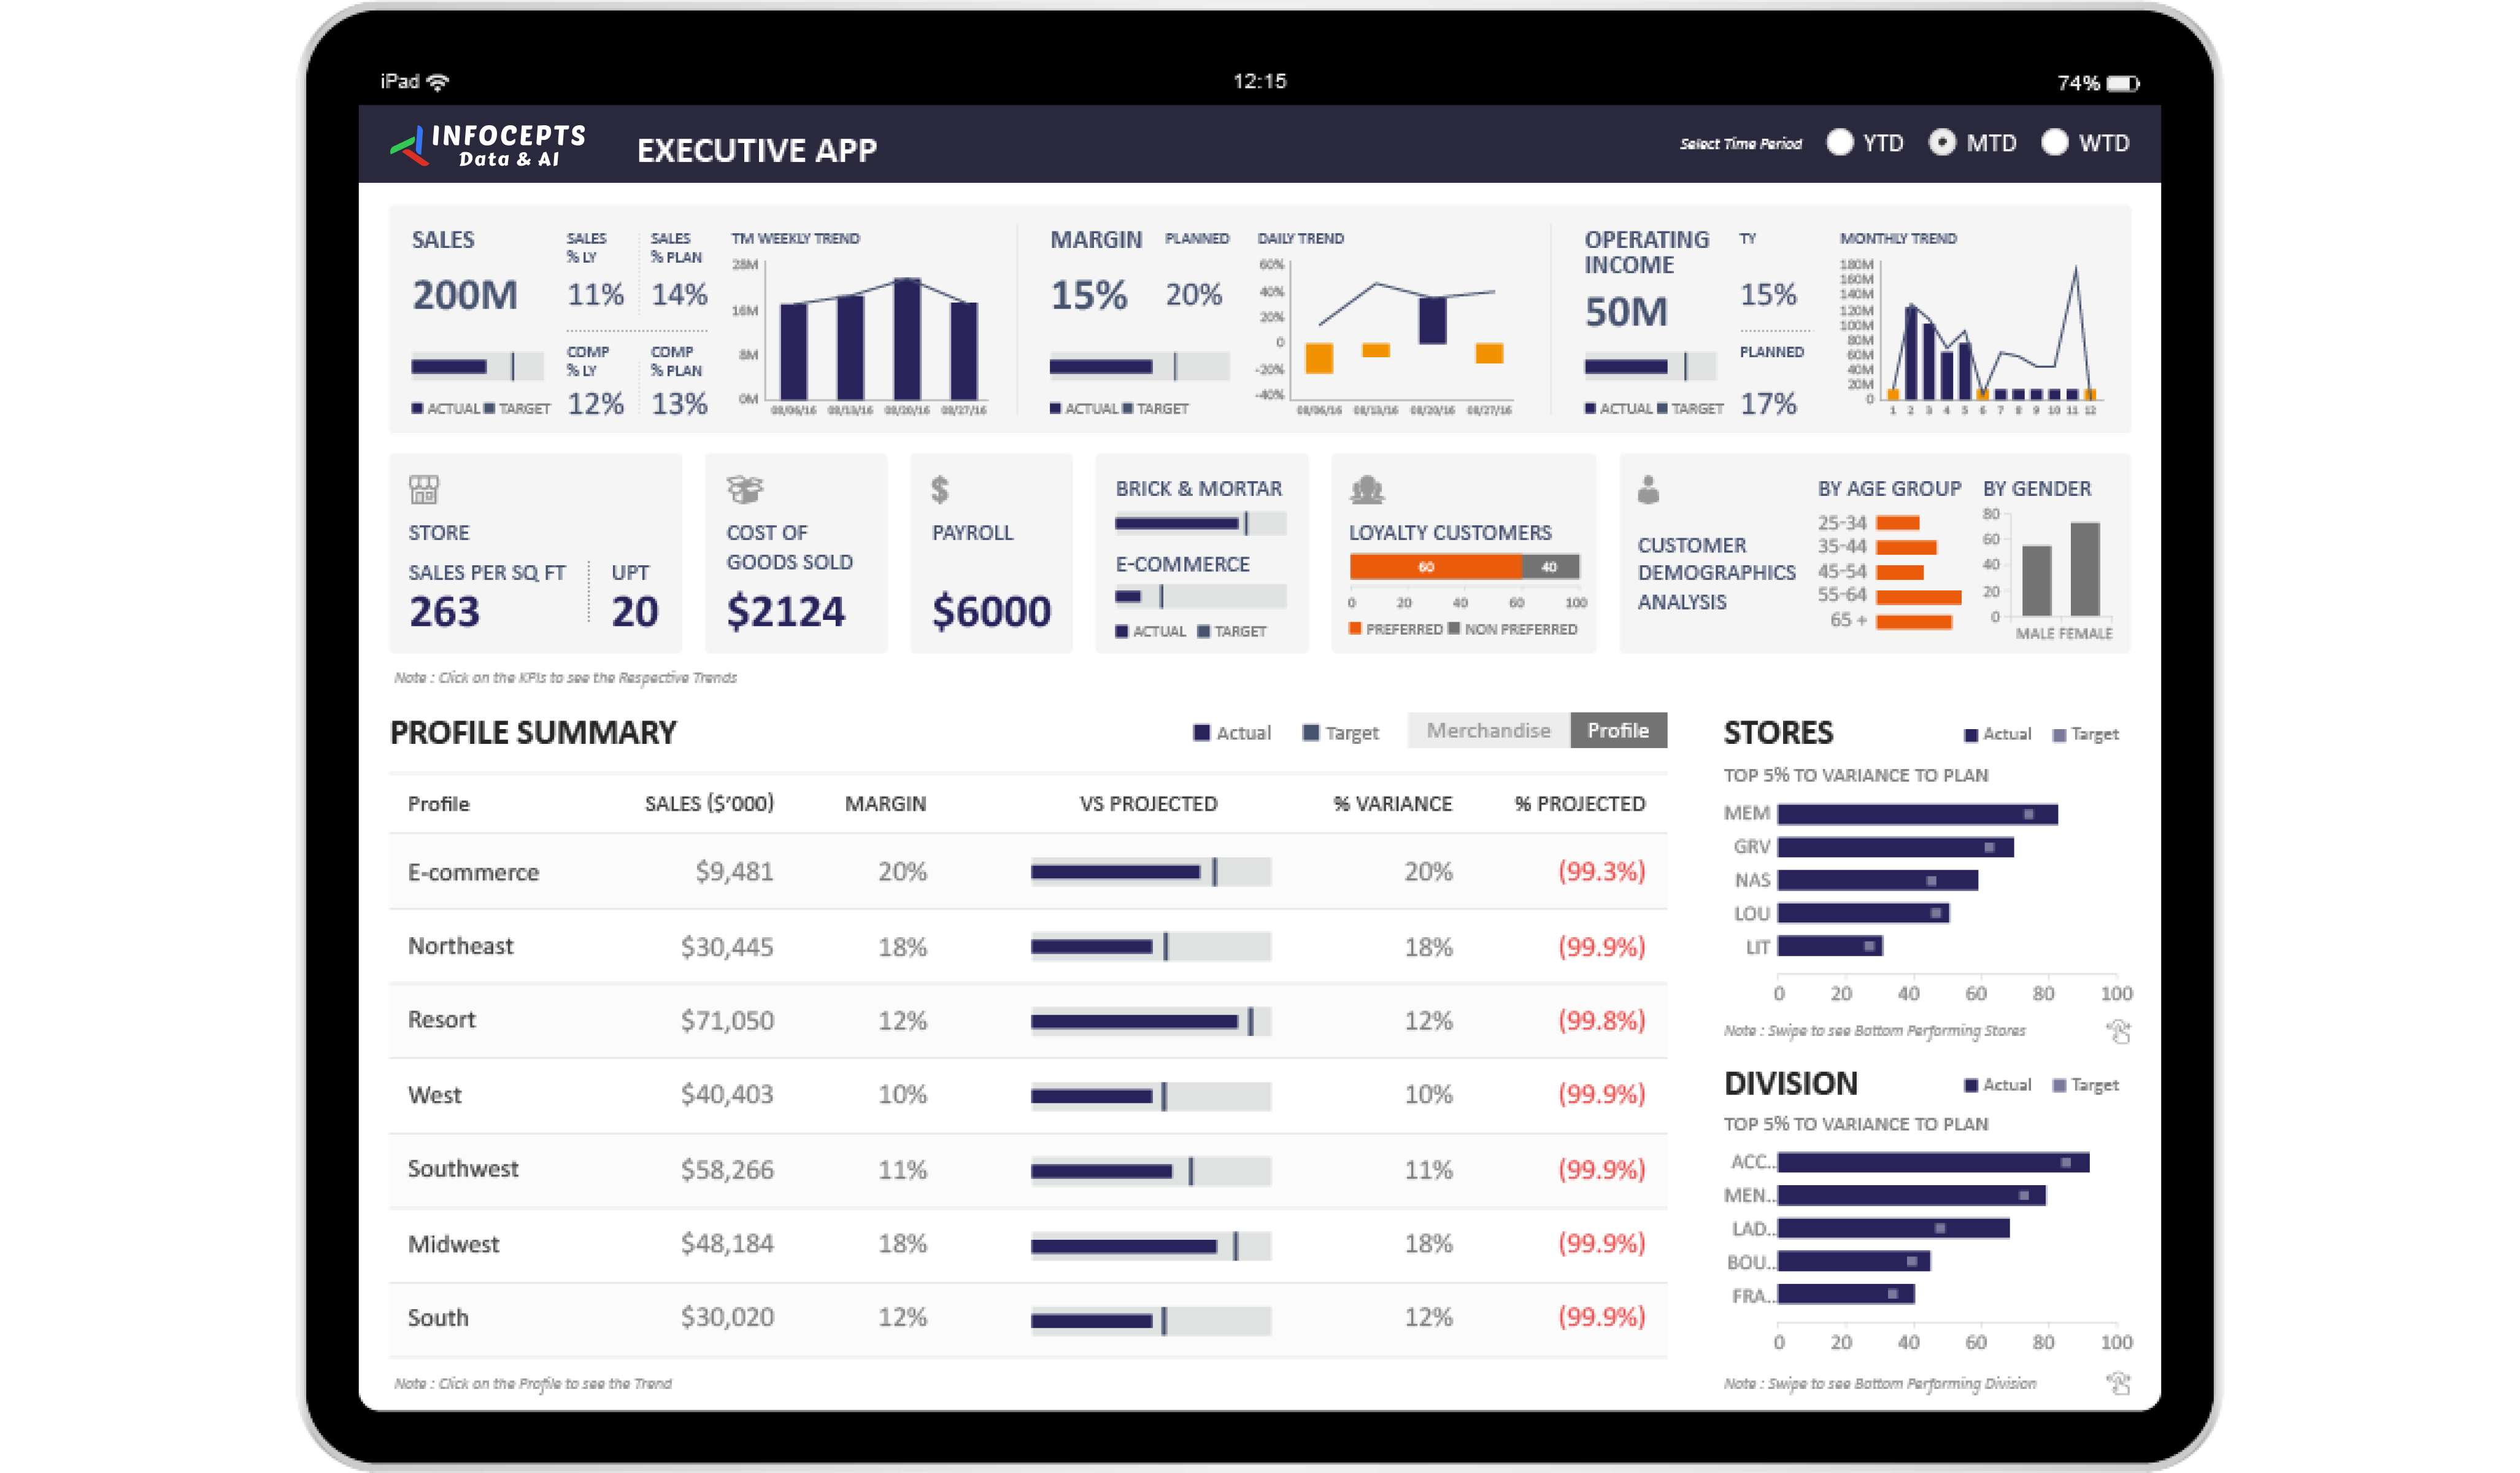
Managing financial performance effectively is key to maximizing profitability and optimizing investments. The Financial Statistics Dashboard by Infocepts empowers banking leaders with real-time insights into budgeting, revenue, costs, and profit trends.
Designed for financial decision-makers, this dashboard streamlines variance analysis across consumer banking, treasury, and wholesale banking sectors. By visualizing key financial metrics, banks can enhance capital income, improve ROI, and optimize budget allocation, ultimately driving sustainable growth and profitability.
Frequently asked questions
It brings budgeting, revenue, cost, and profit trend data into one real-time view for banking leaders, replacing separate financial reports across consumer banking, treasury, and wholesale banking.
Where actual performance is diverging from budget in each sector, so leadership can address a shortfall in one area of the bank without waiting for a company-wide report to surface it.
Visibility into which sectors and products are driving or dragging returns lets leadership reallocate capital and budget toward what is actually performing.
Banking financial decision-makers responsible for budget allocation and profitability across consumer, treasury, and wholesale banking functions.
Yes. Trend data across revenue, cost, and profit lines is the same input forecasting models use, so the two typically sit on the same underlying data layer.
By connecting core banking and finance systems into a BI platform through Business Analytics services, informed by Financial Services industry work.

 Pranali Lanjewar