


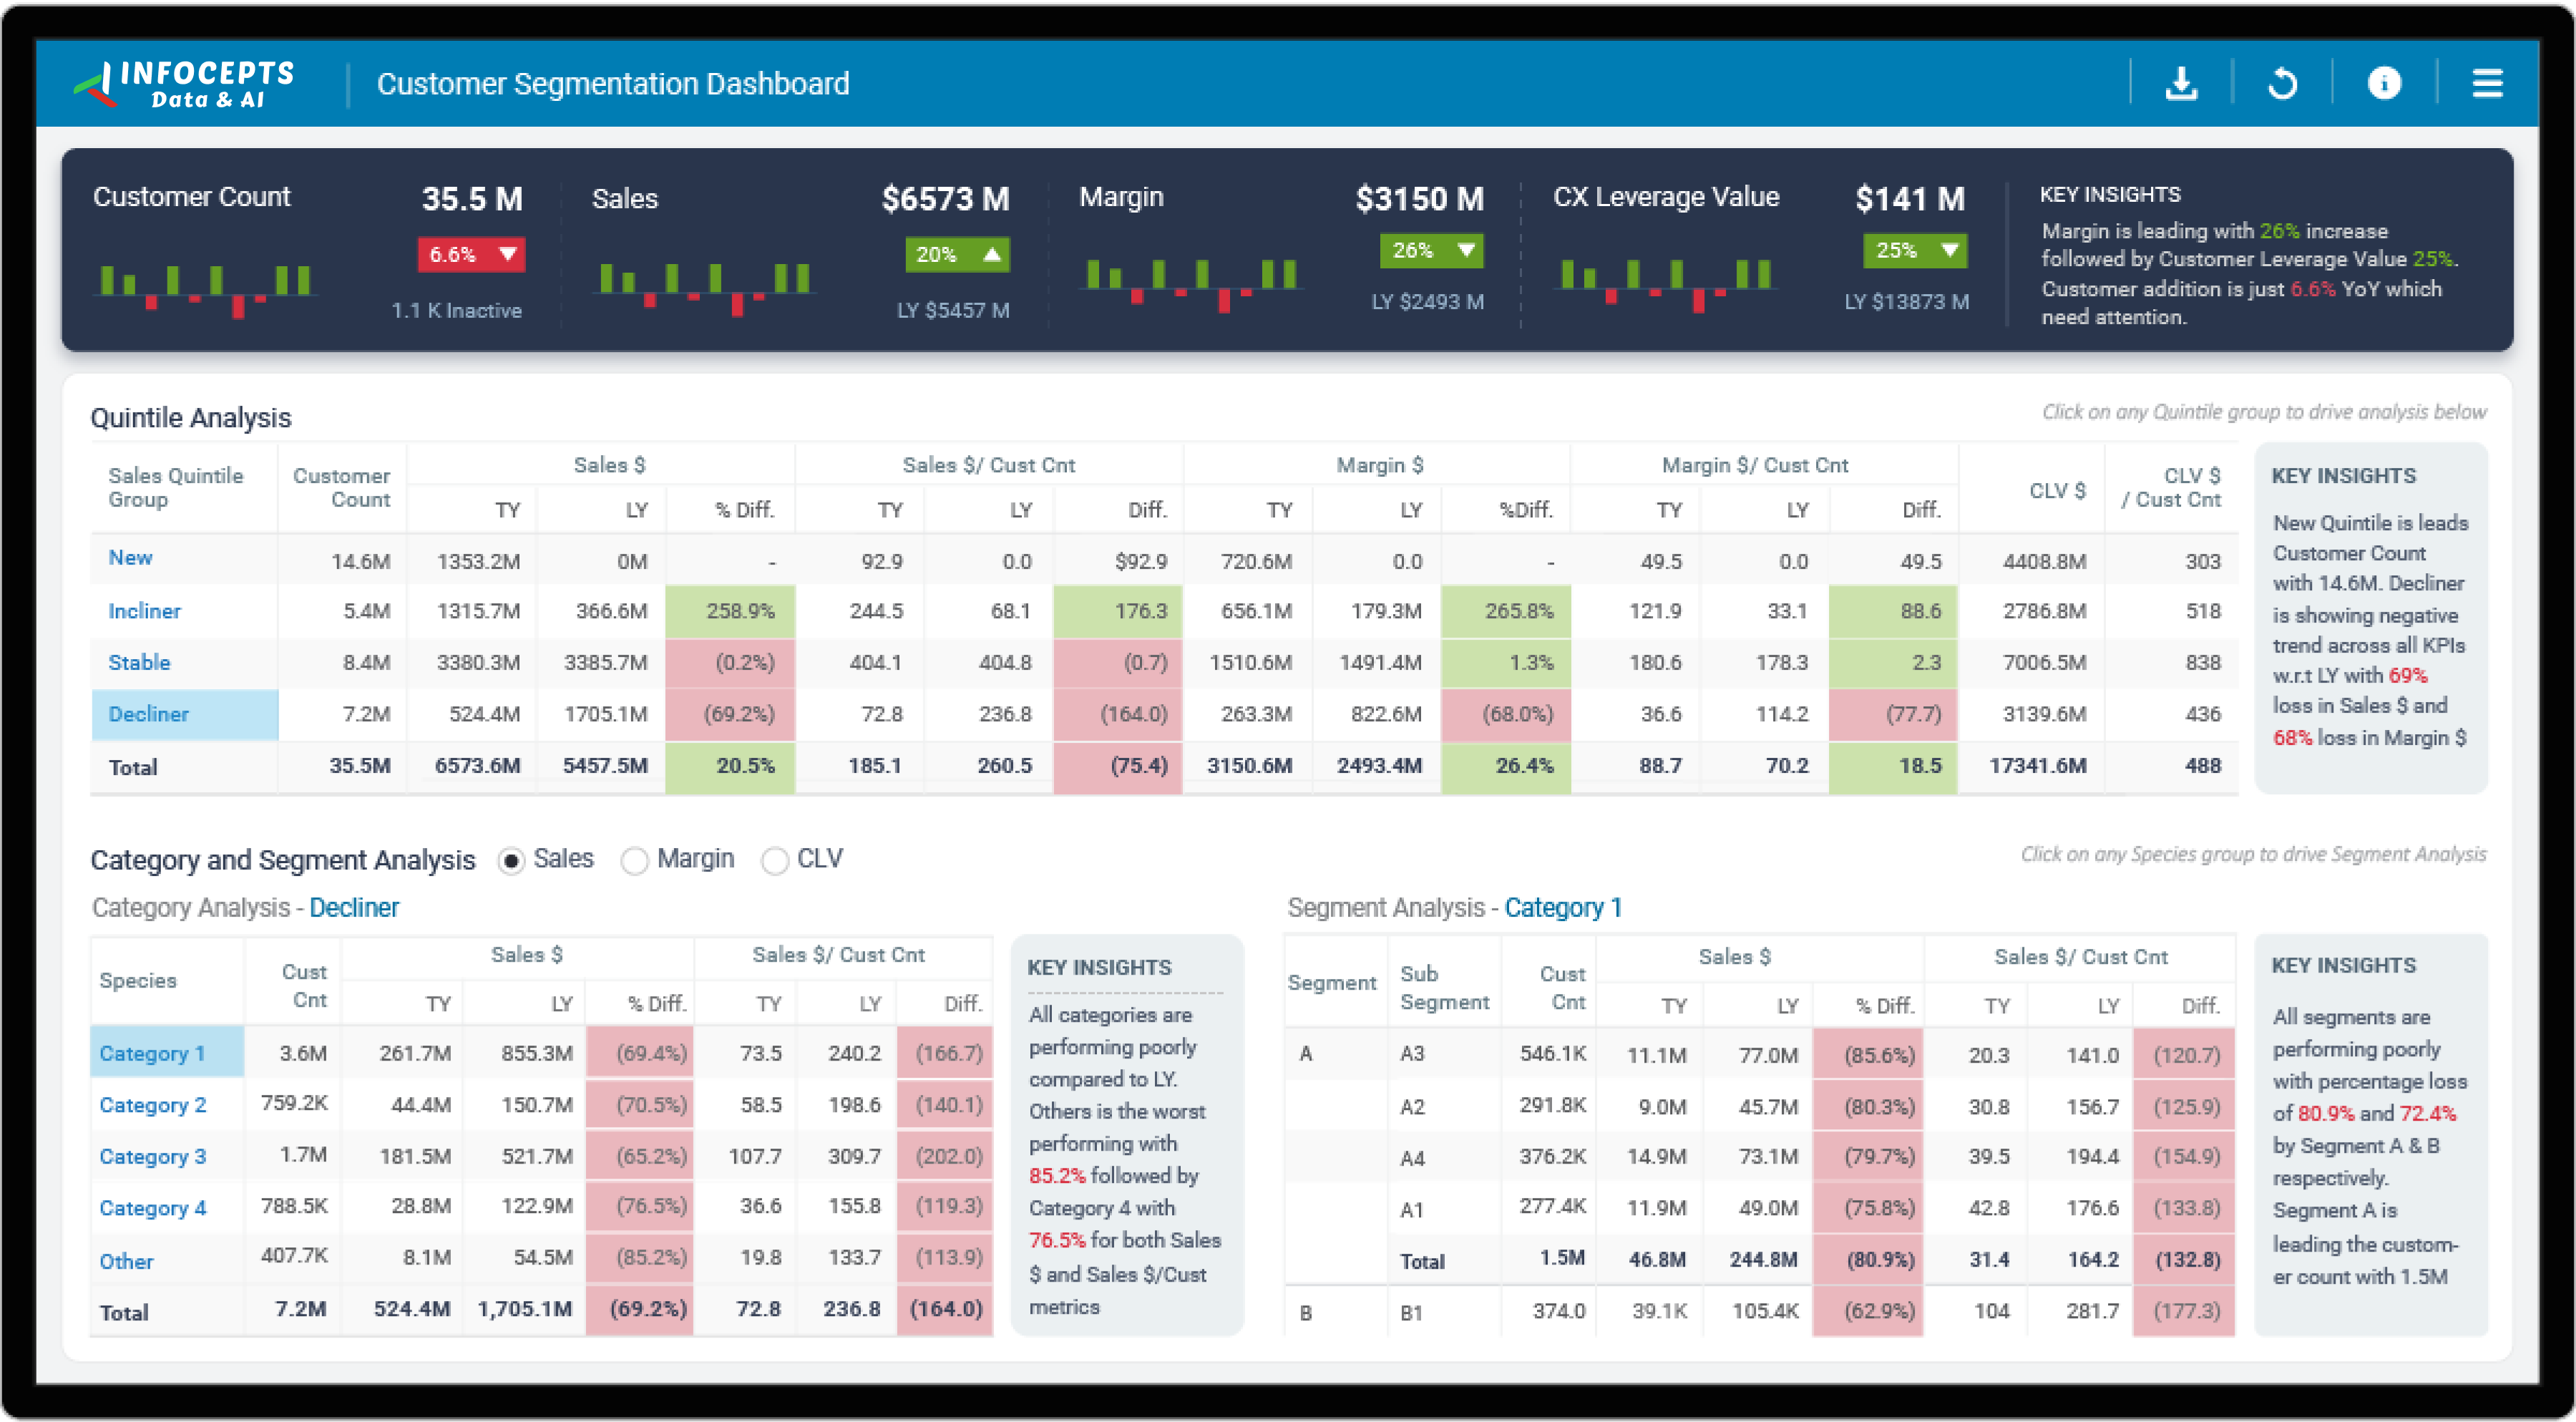


63%
Increased customer count
62%
Increased in sales
71%
Increase in margin
69%
Increase in customer lifetime value
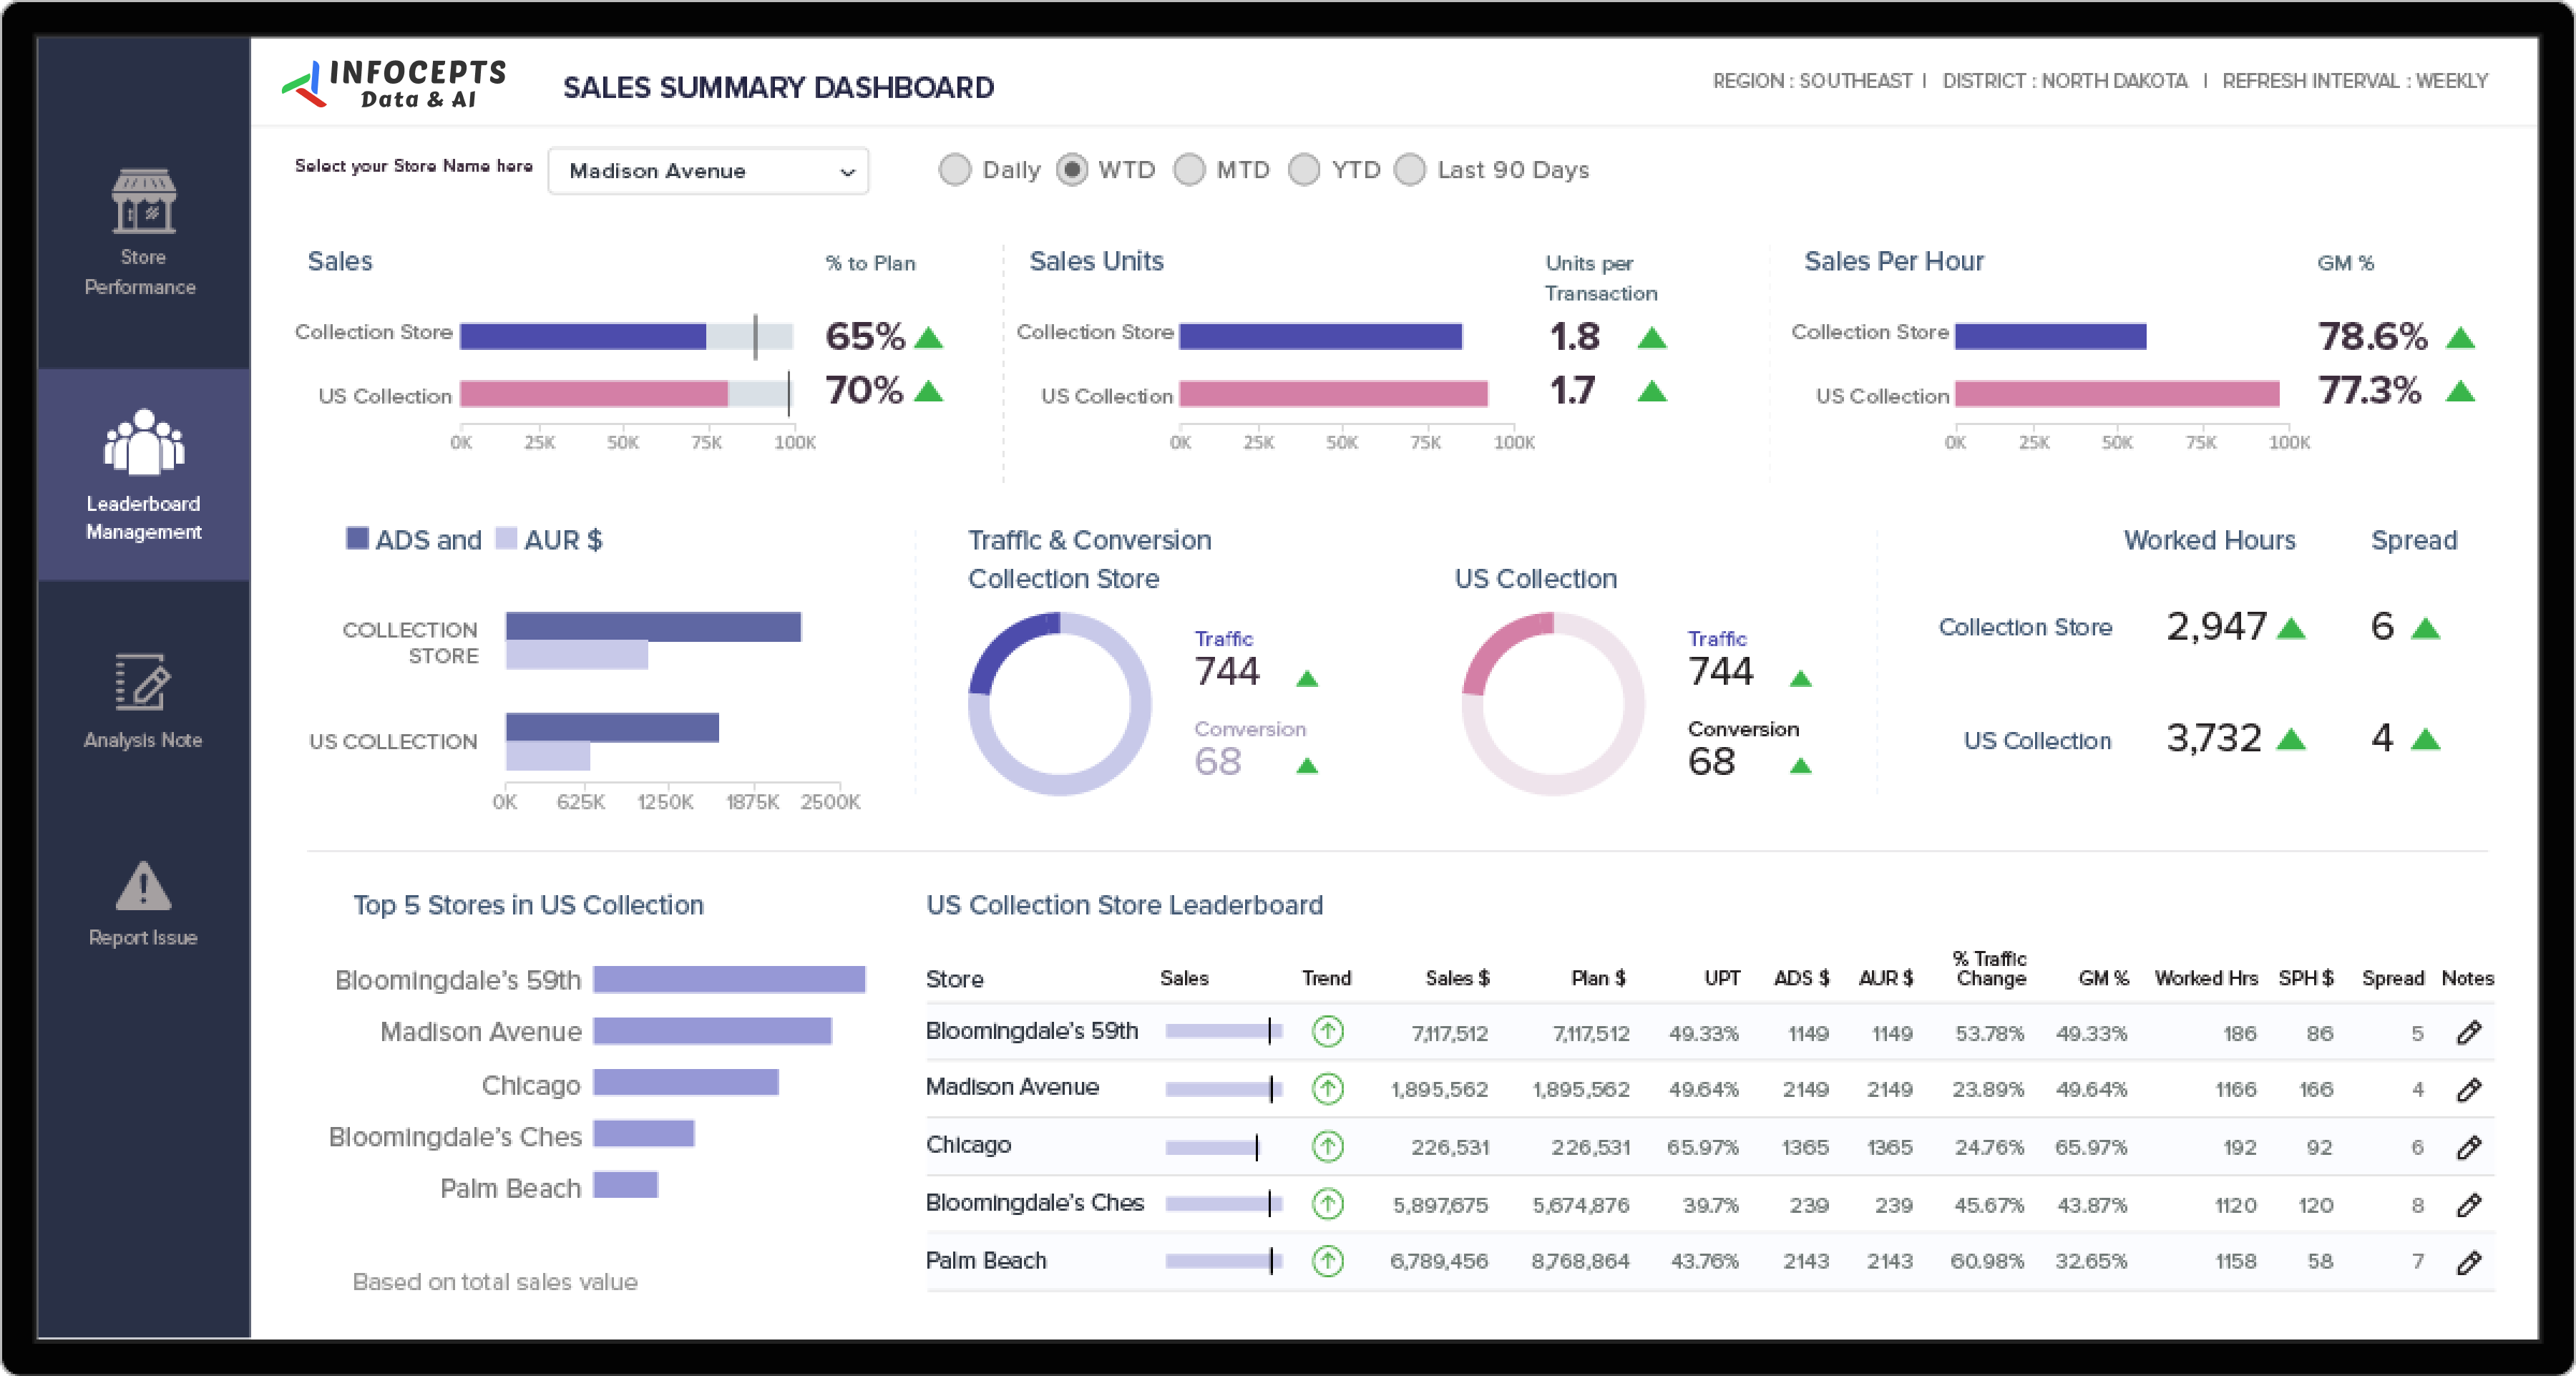
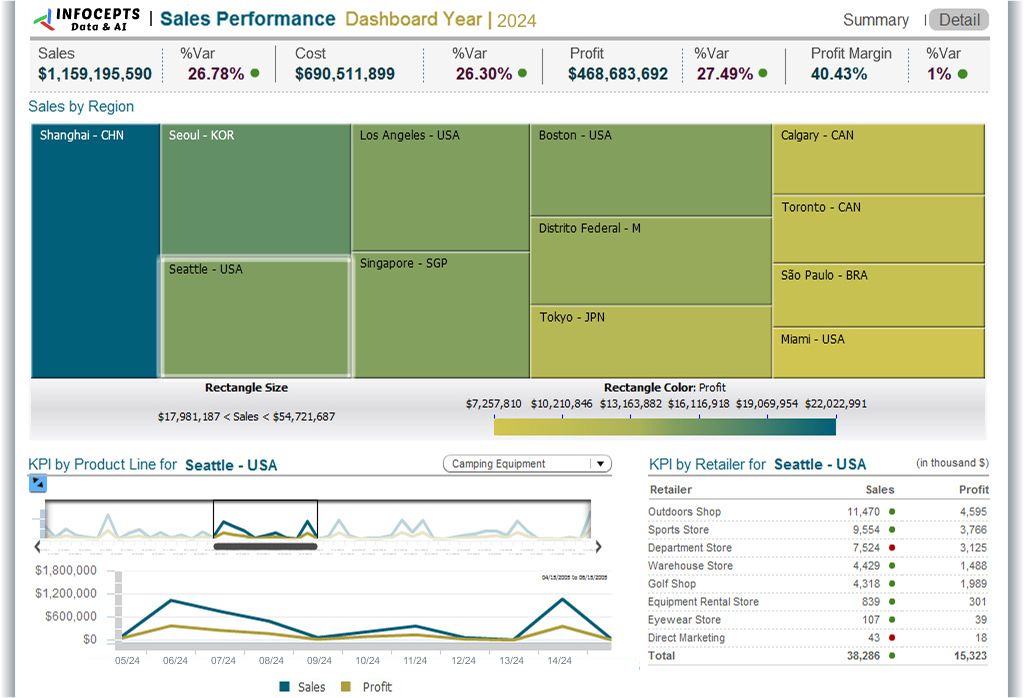
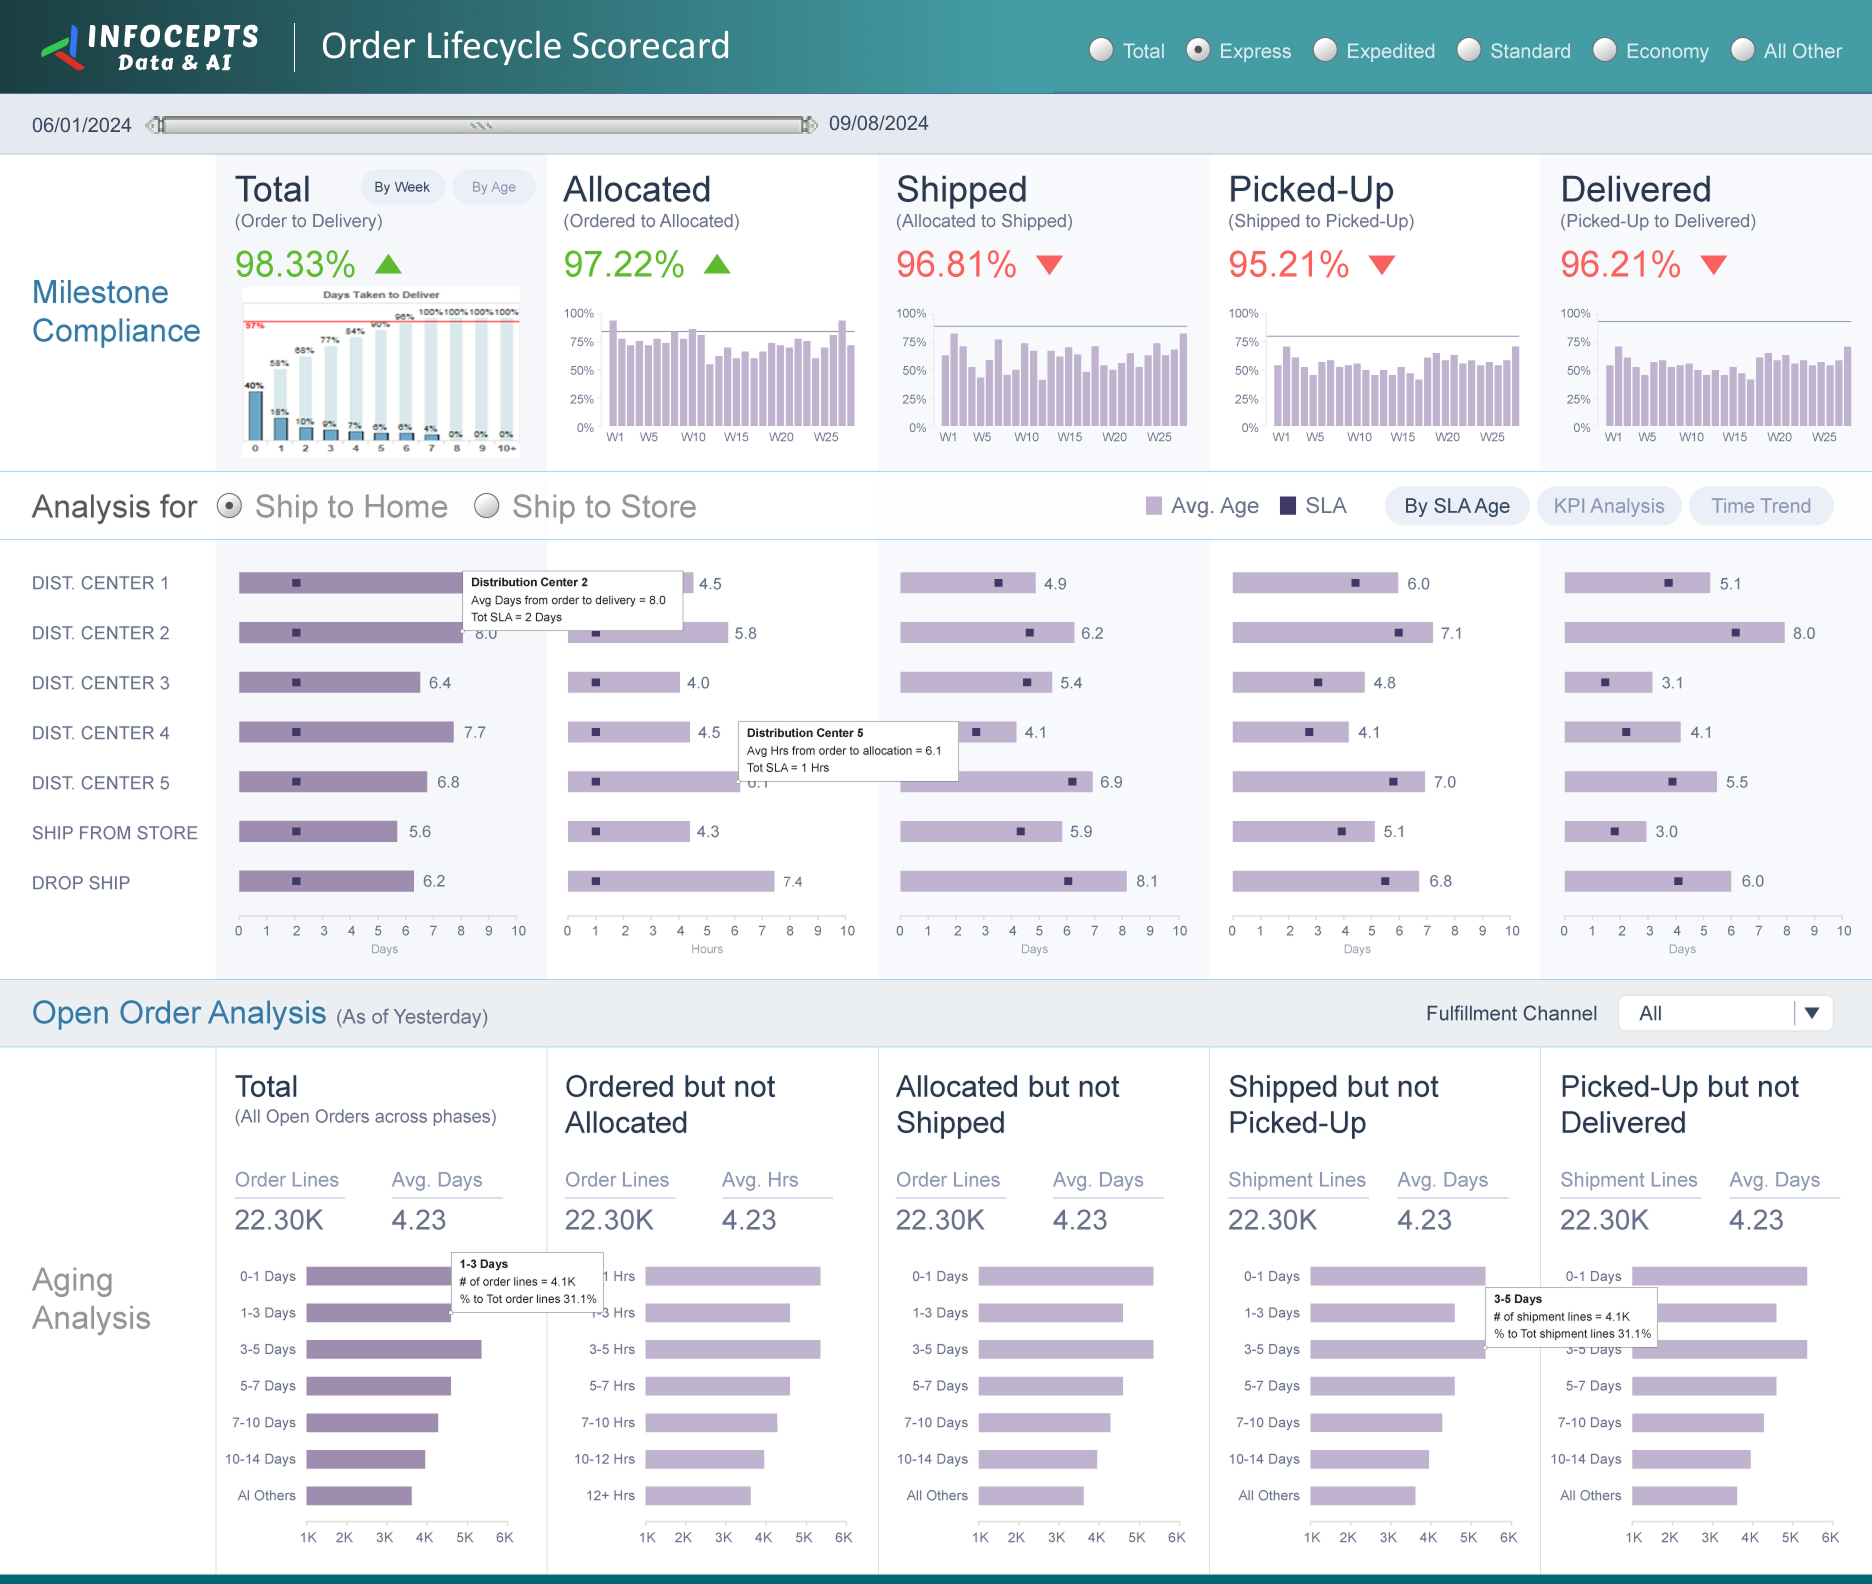
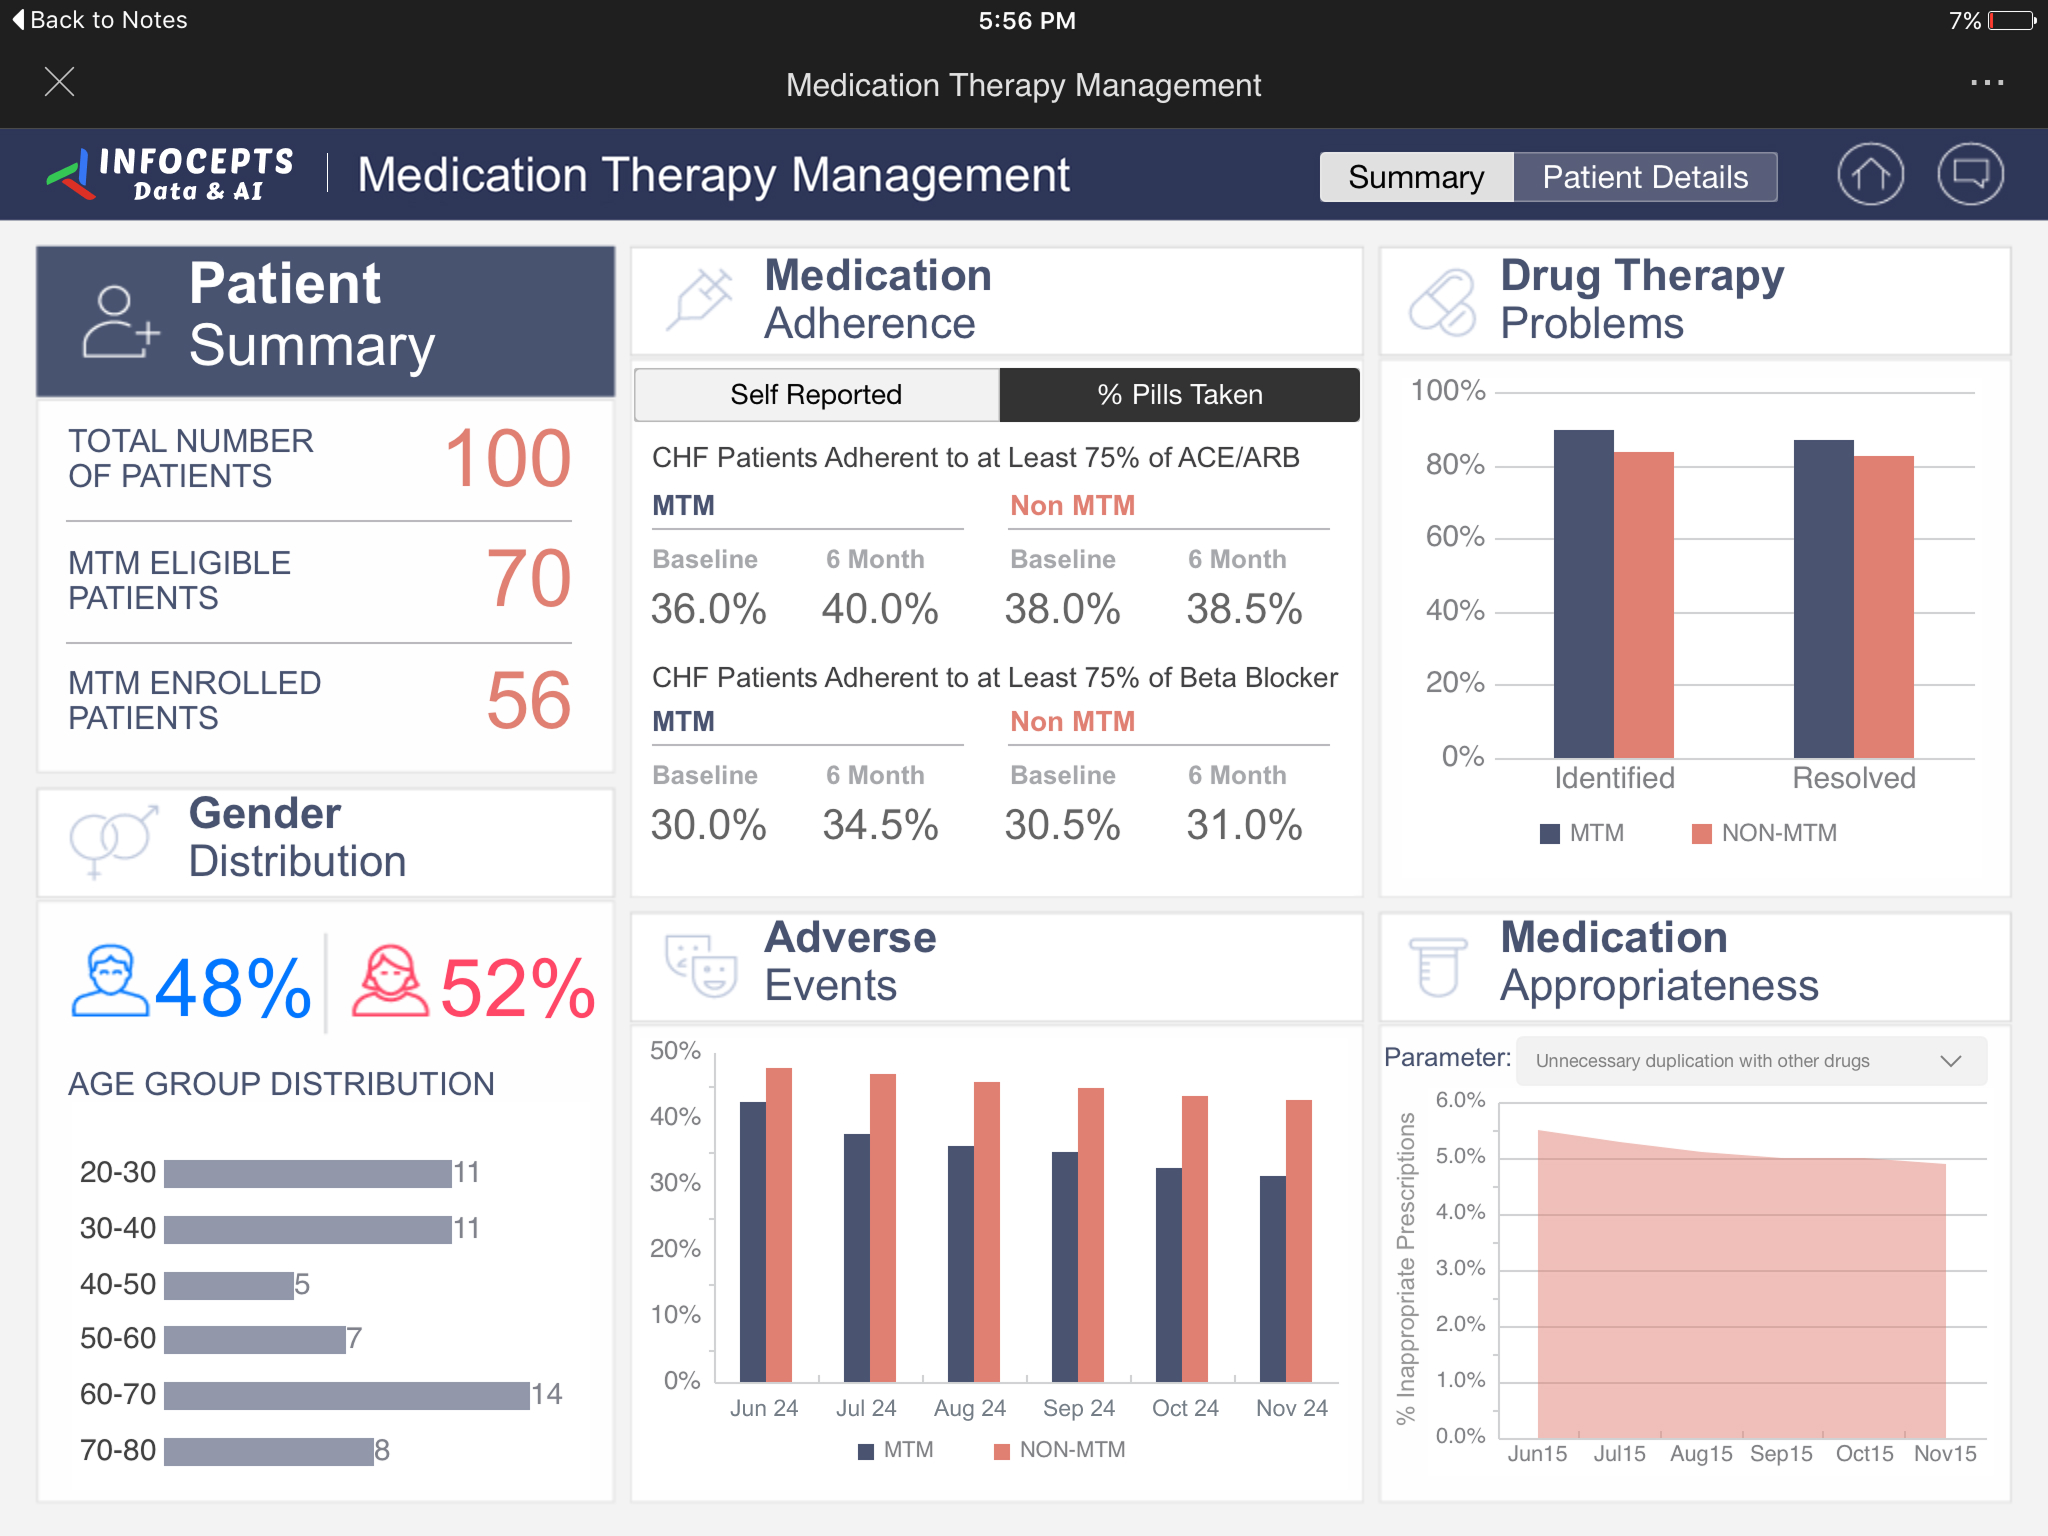
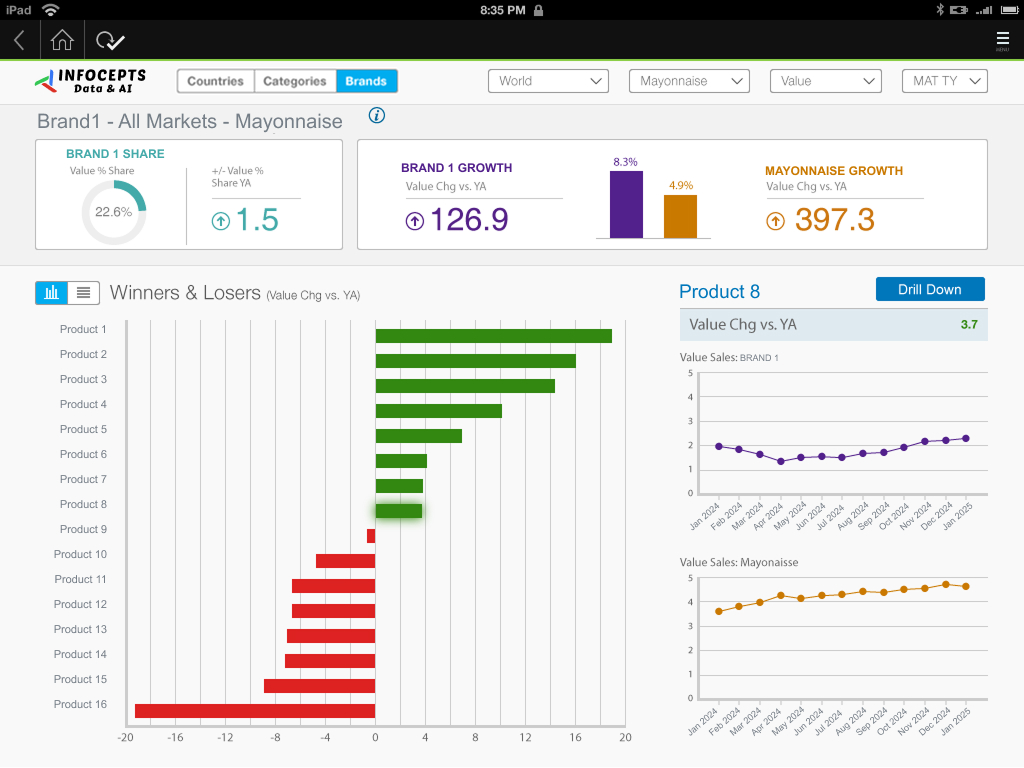
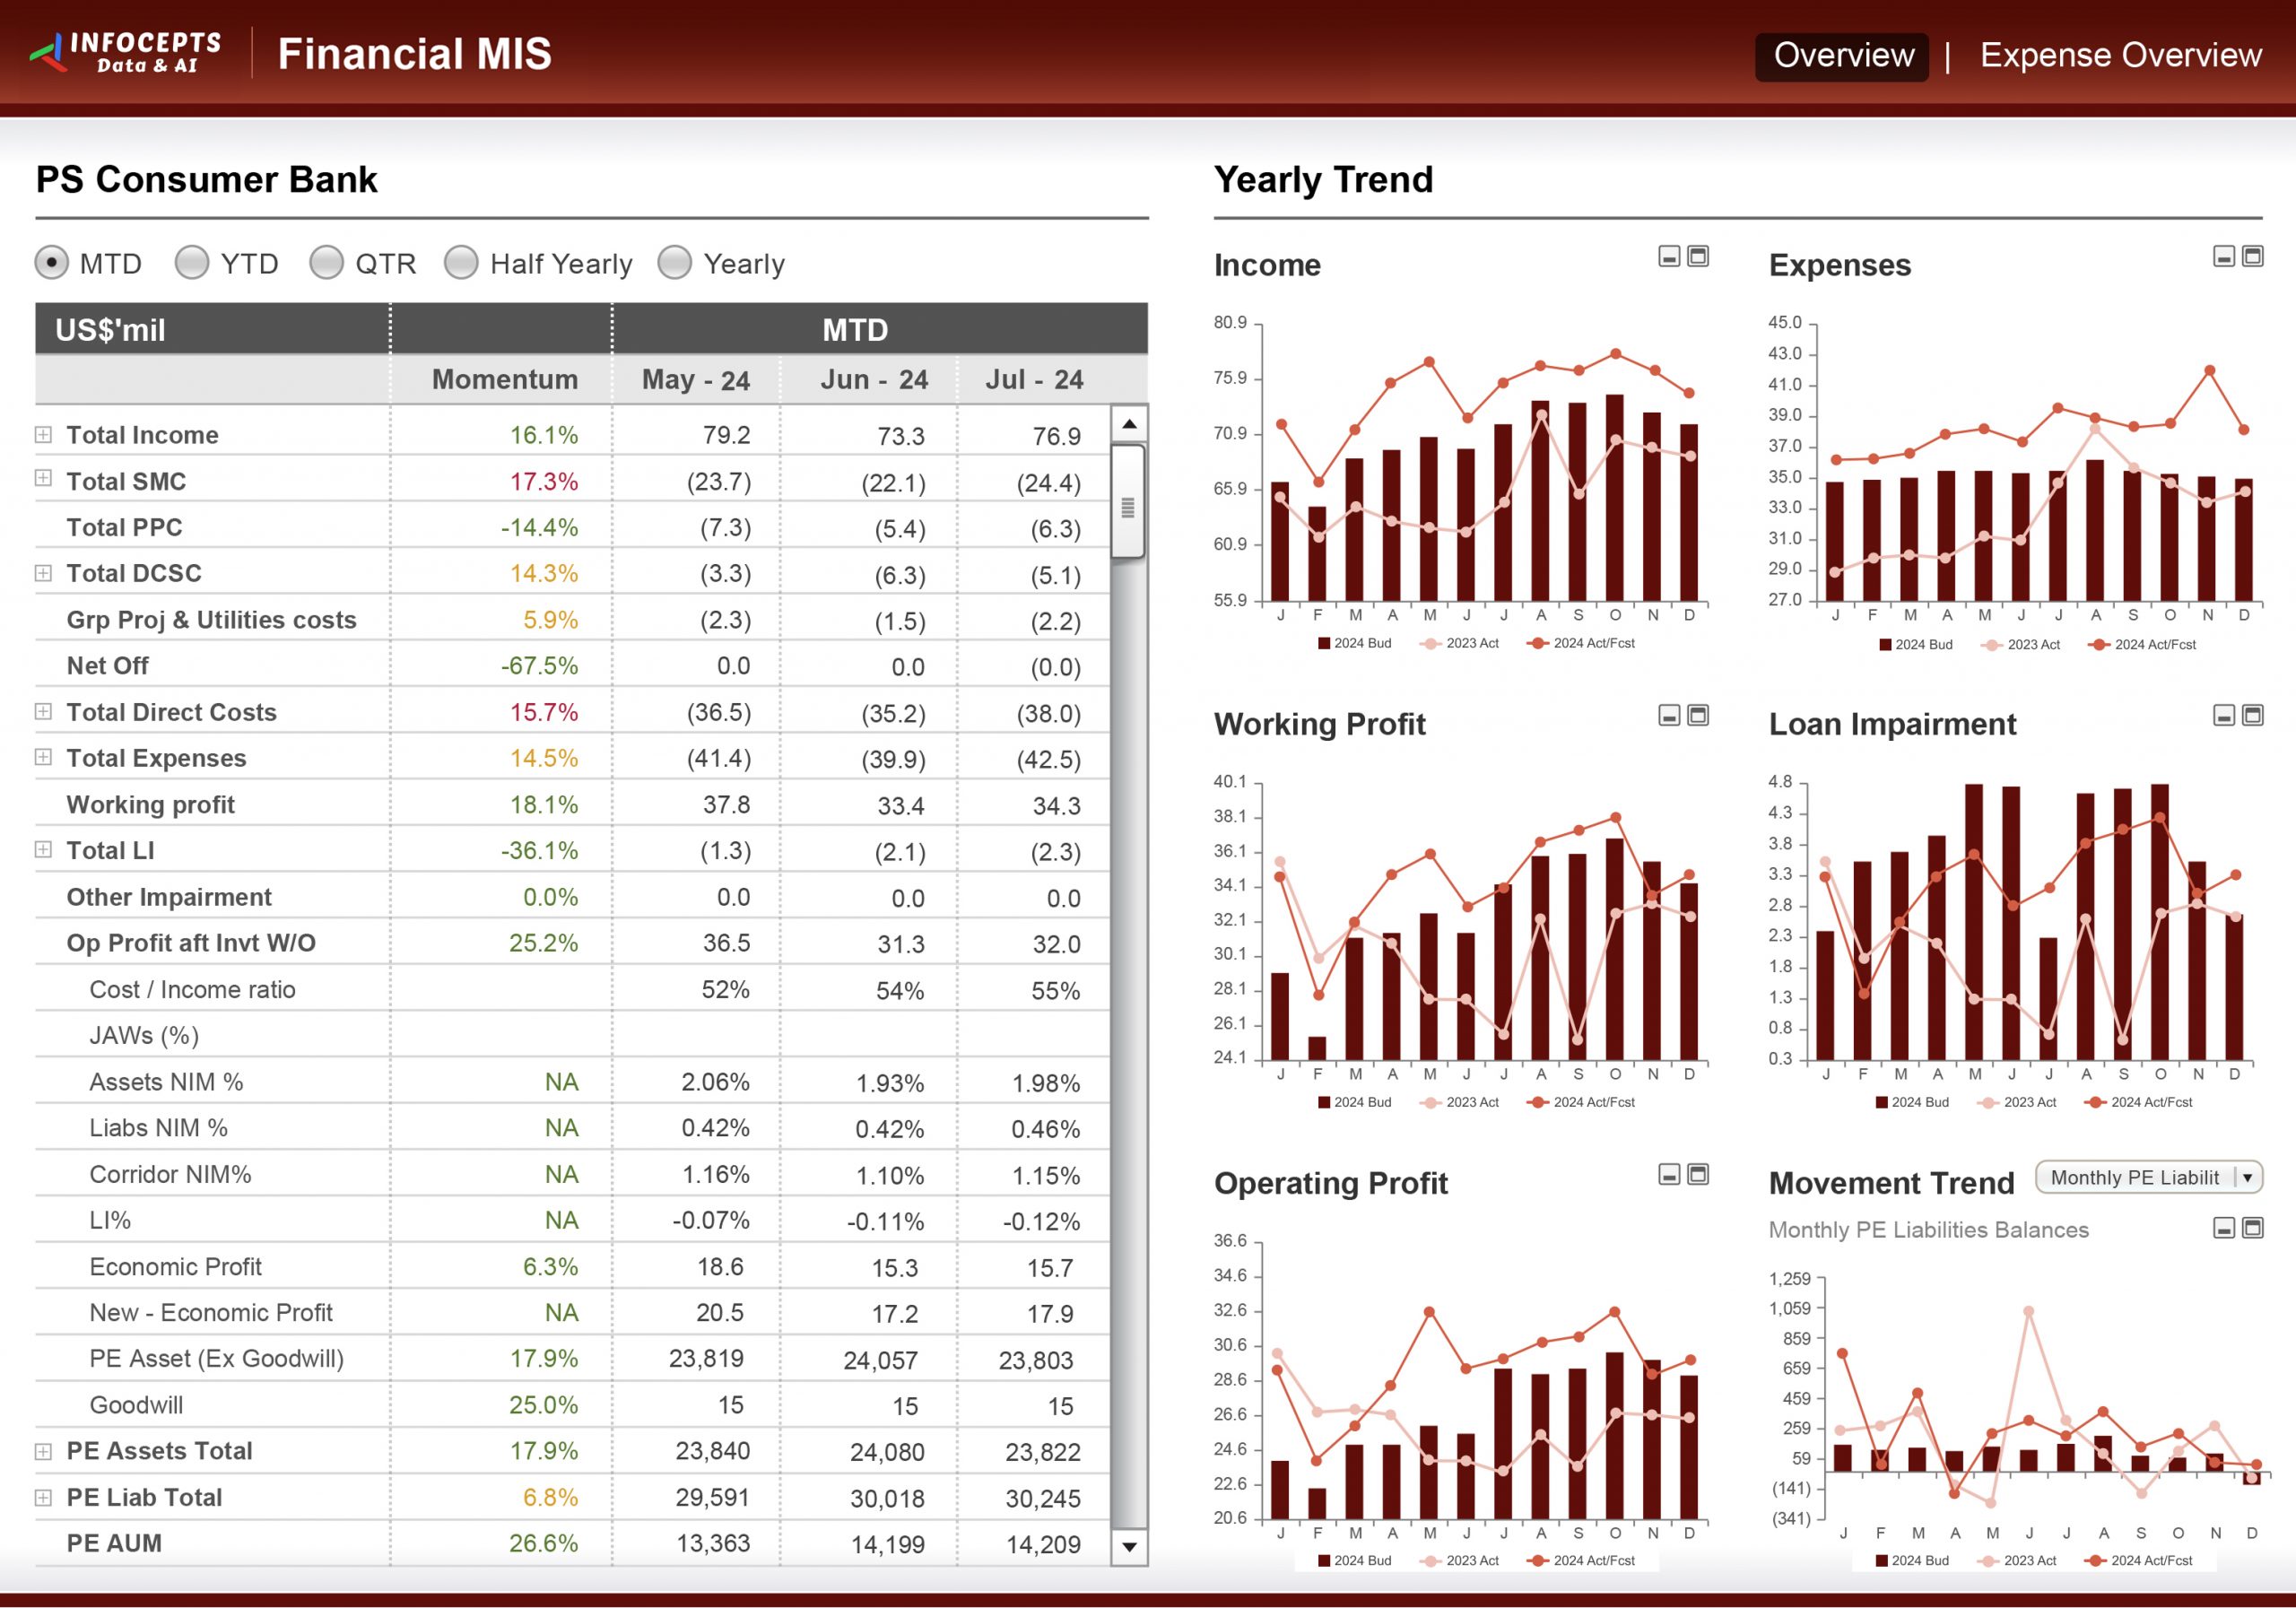
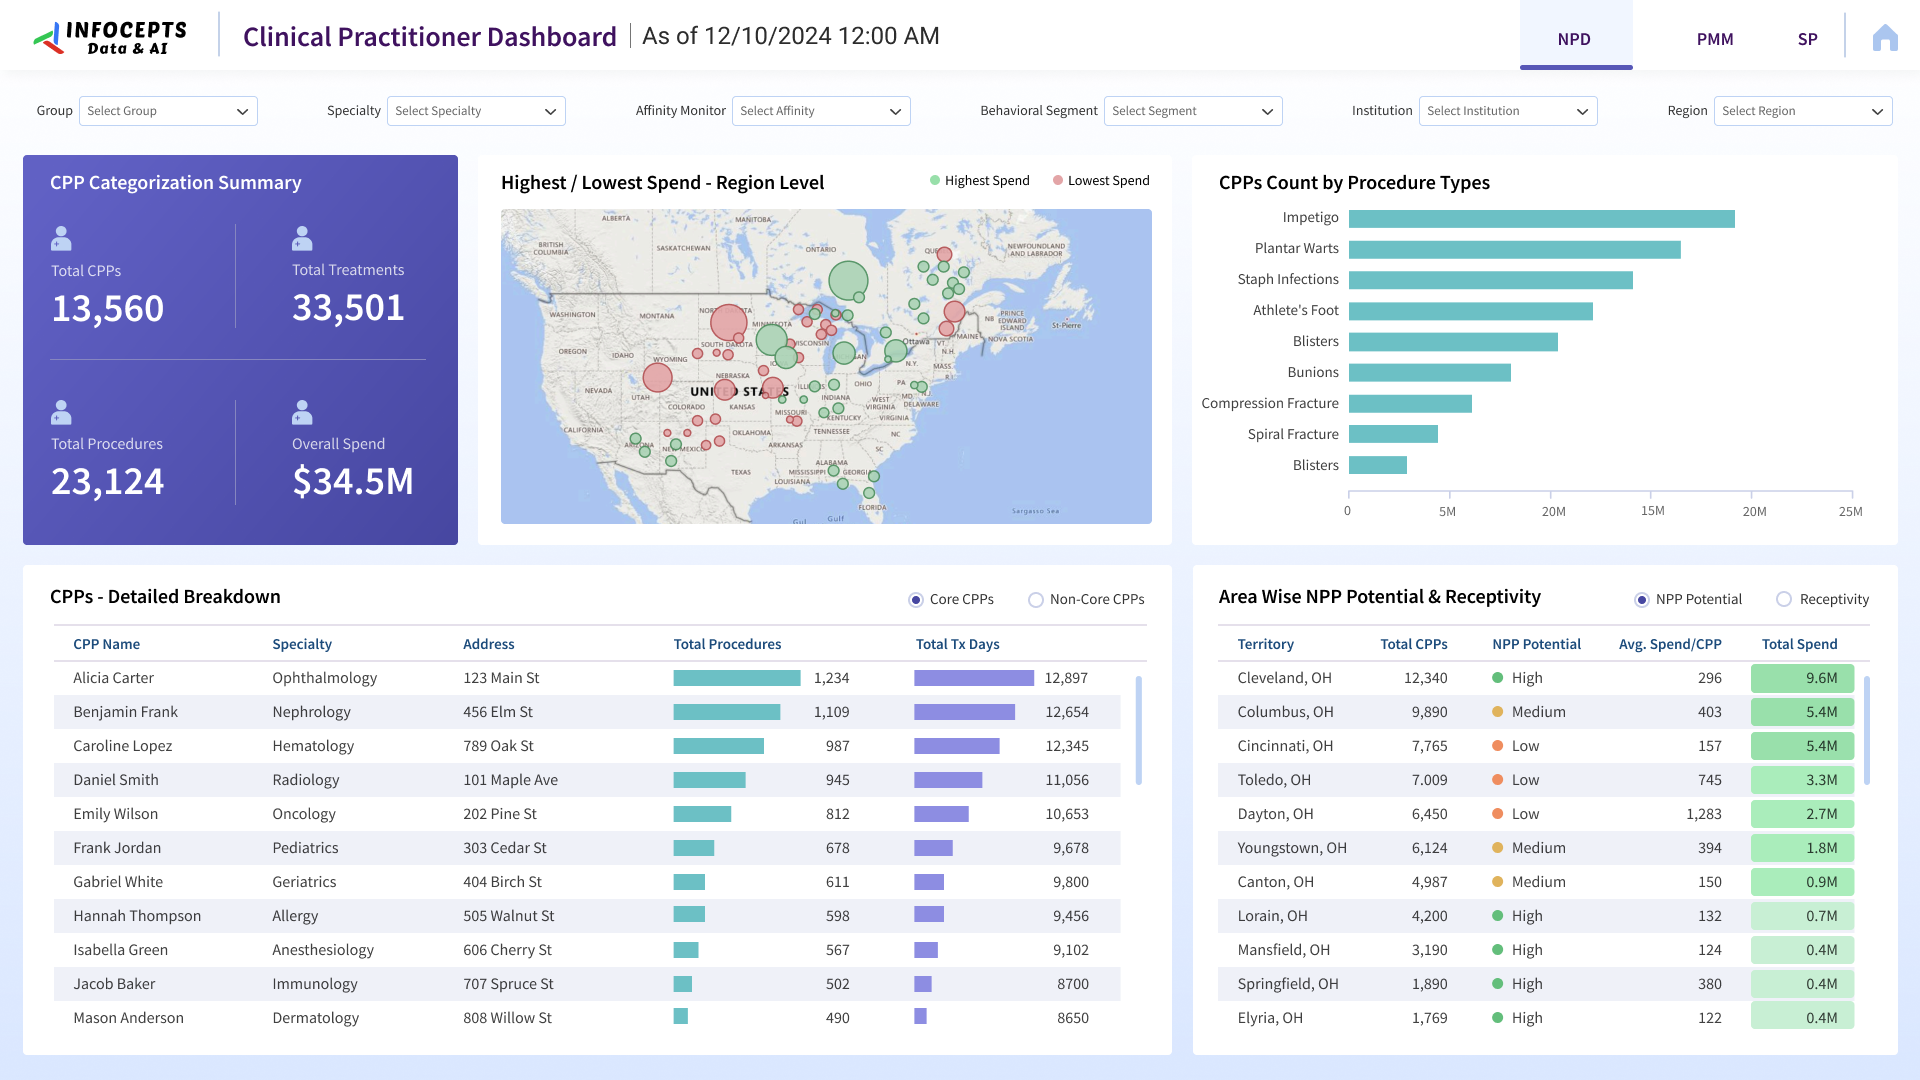
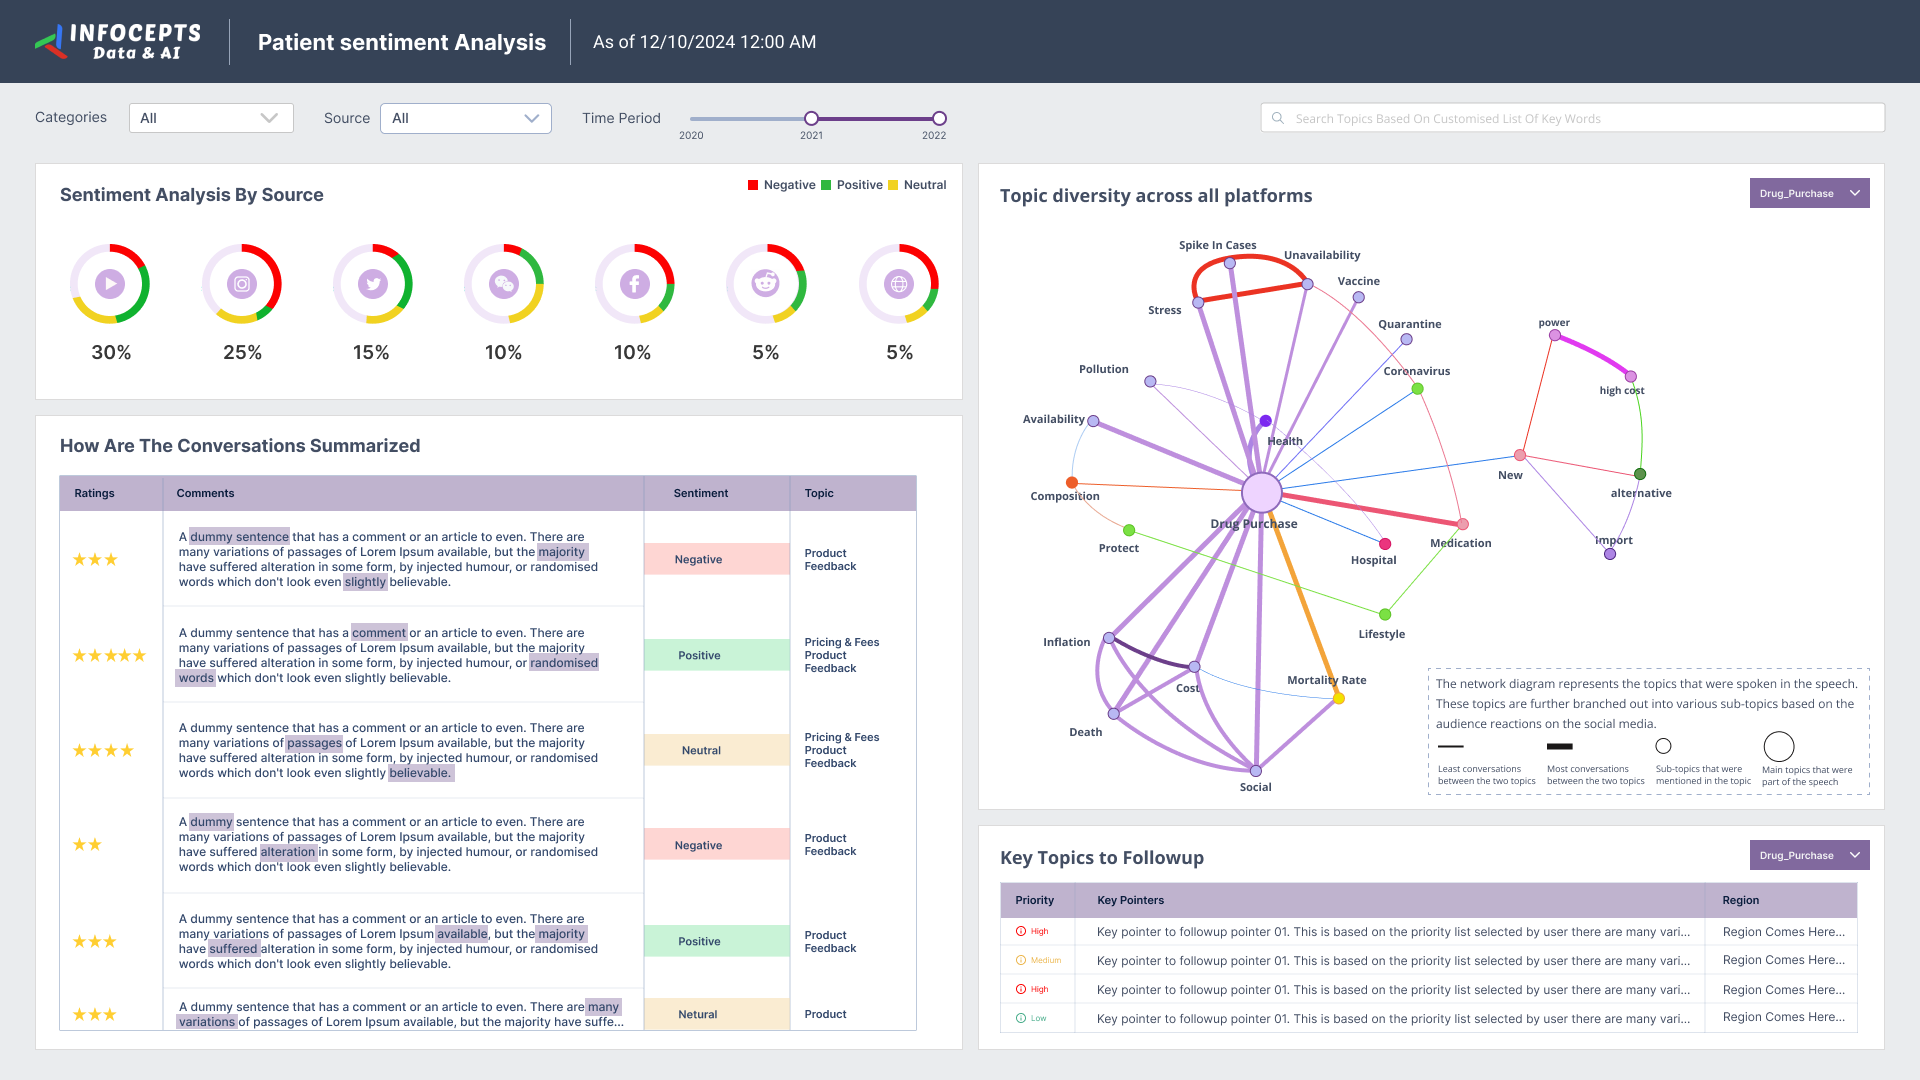
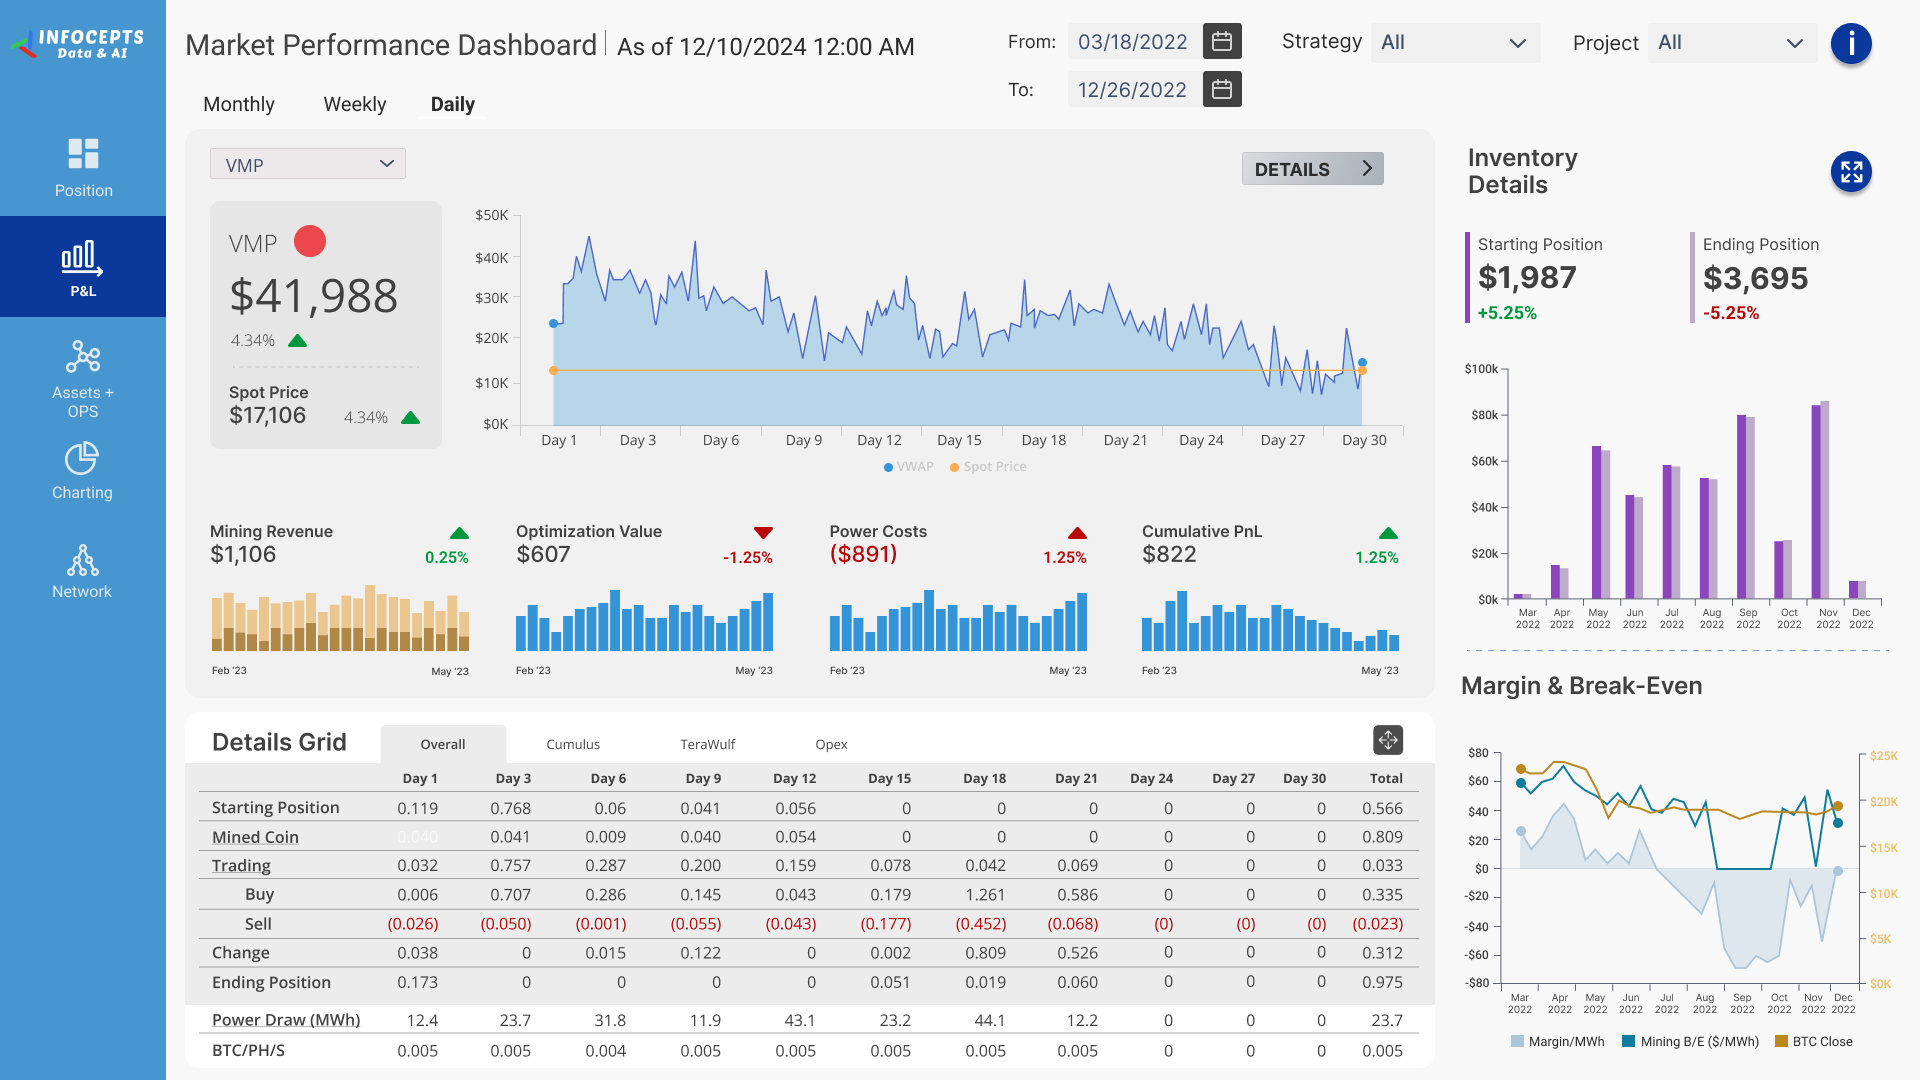
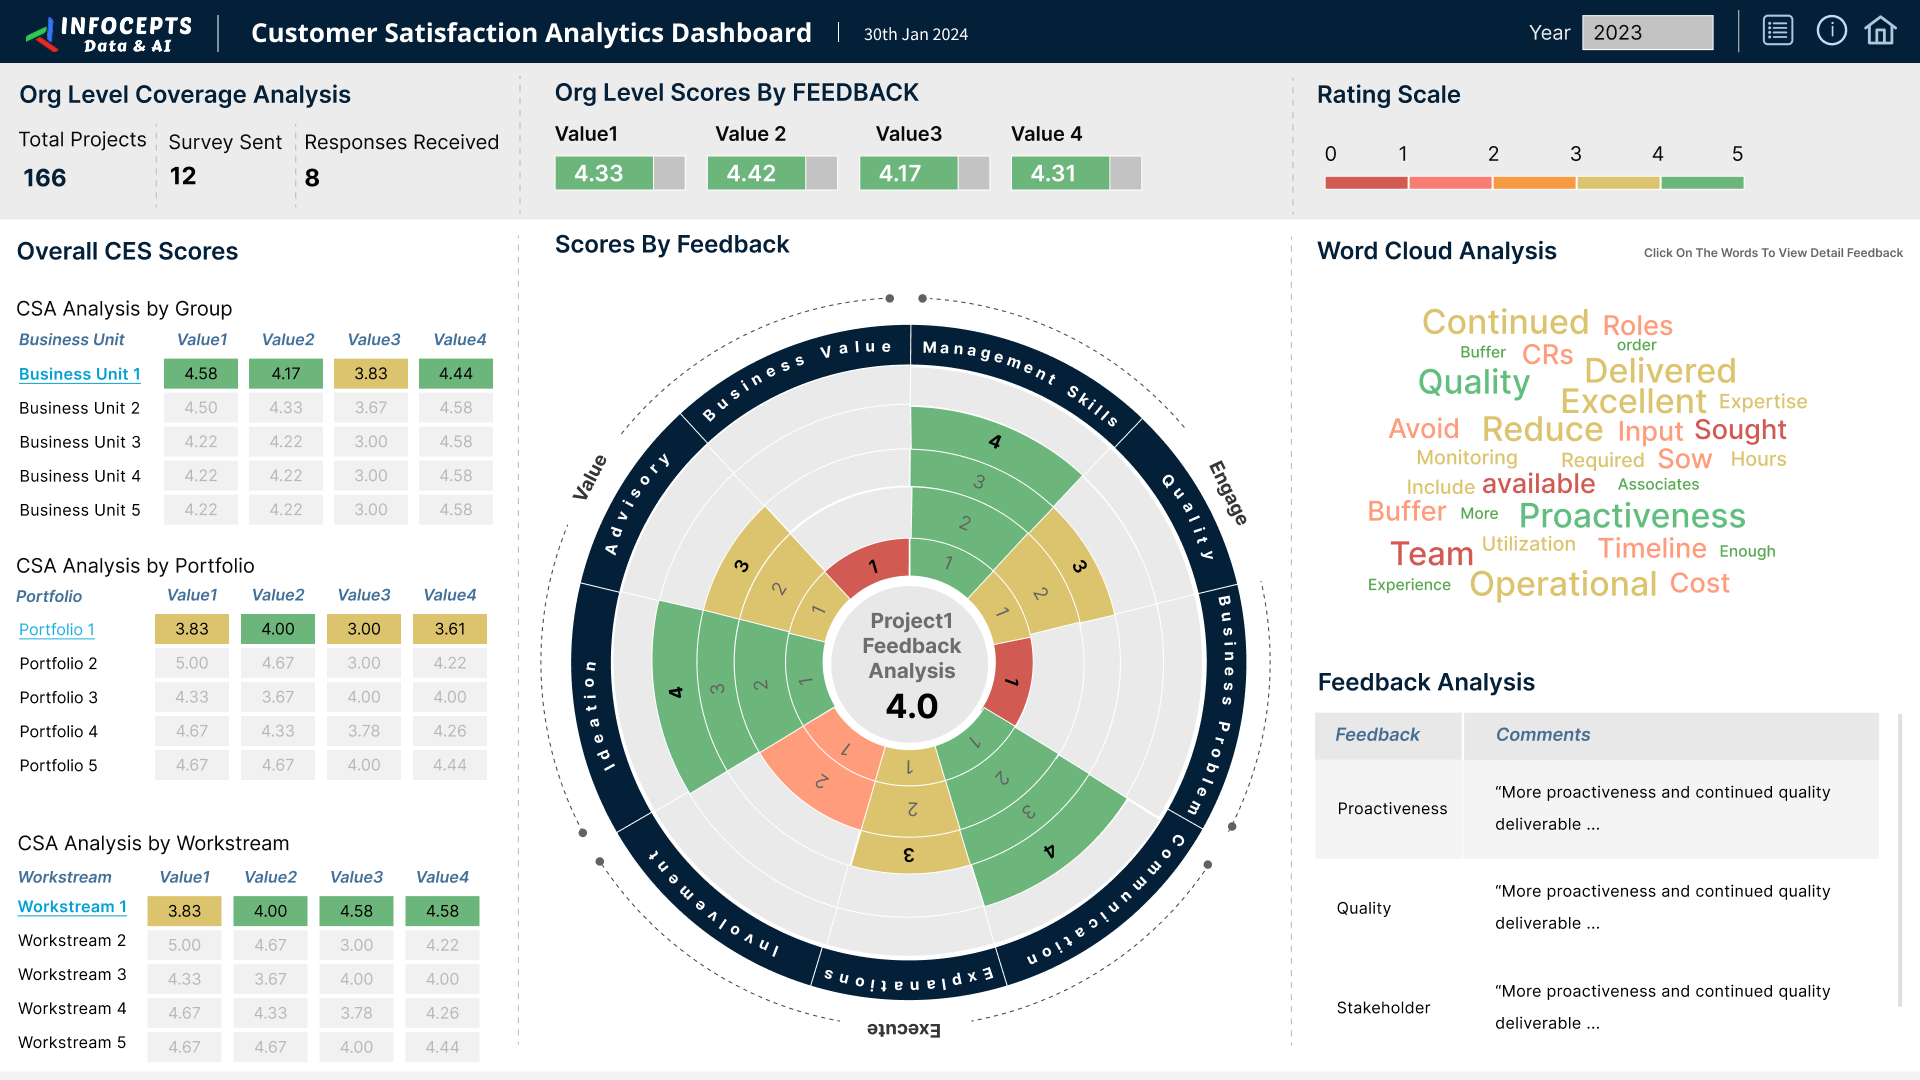
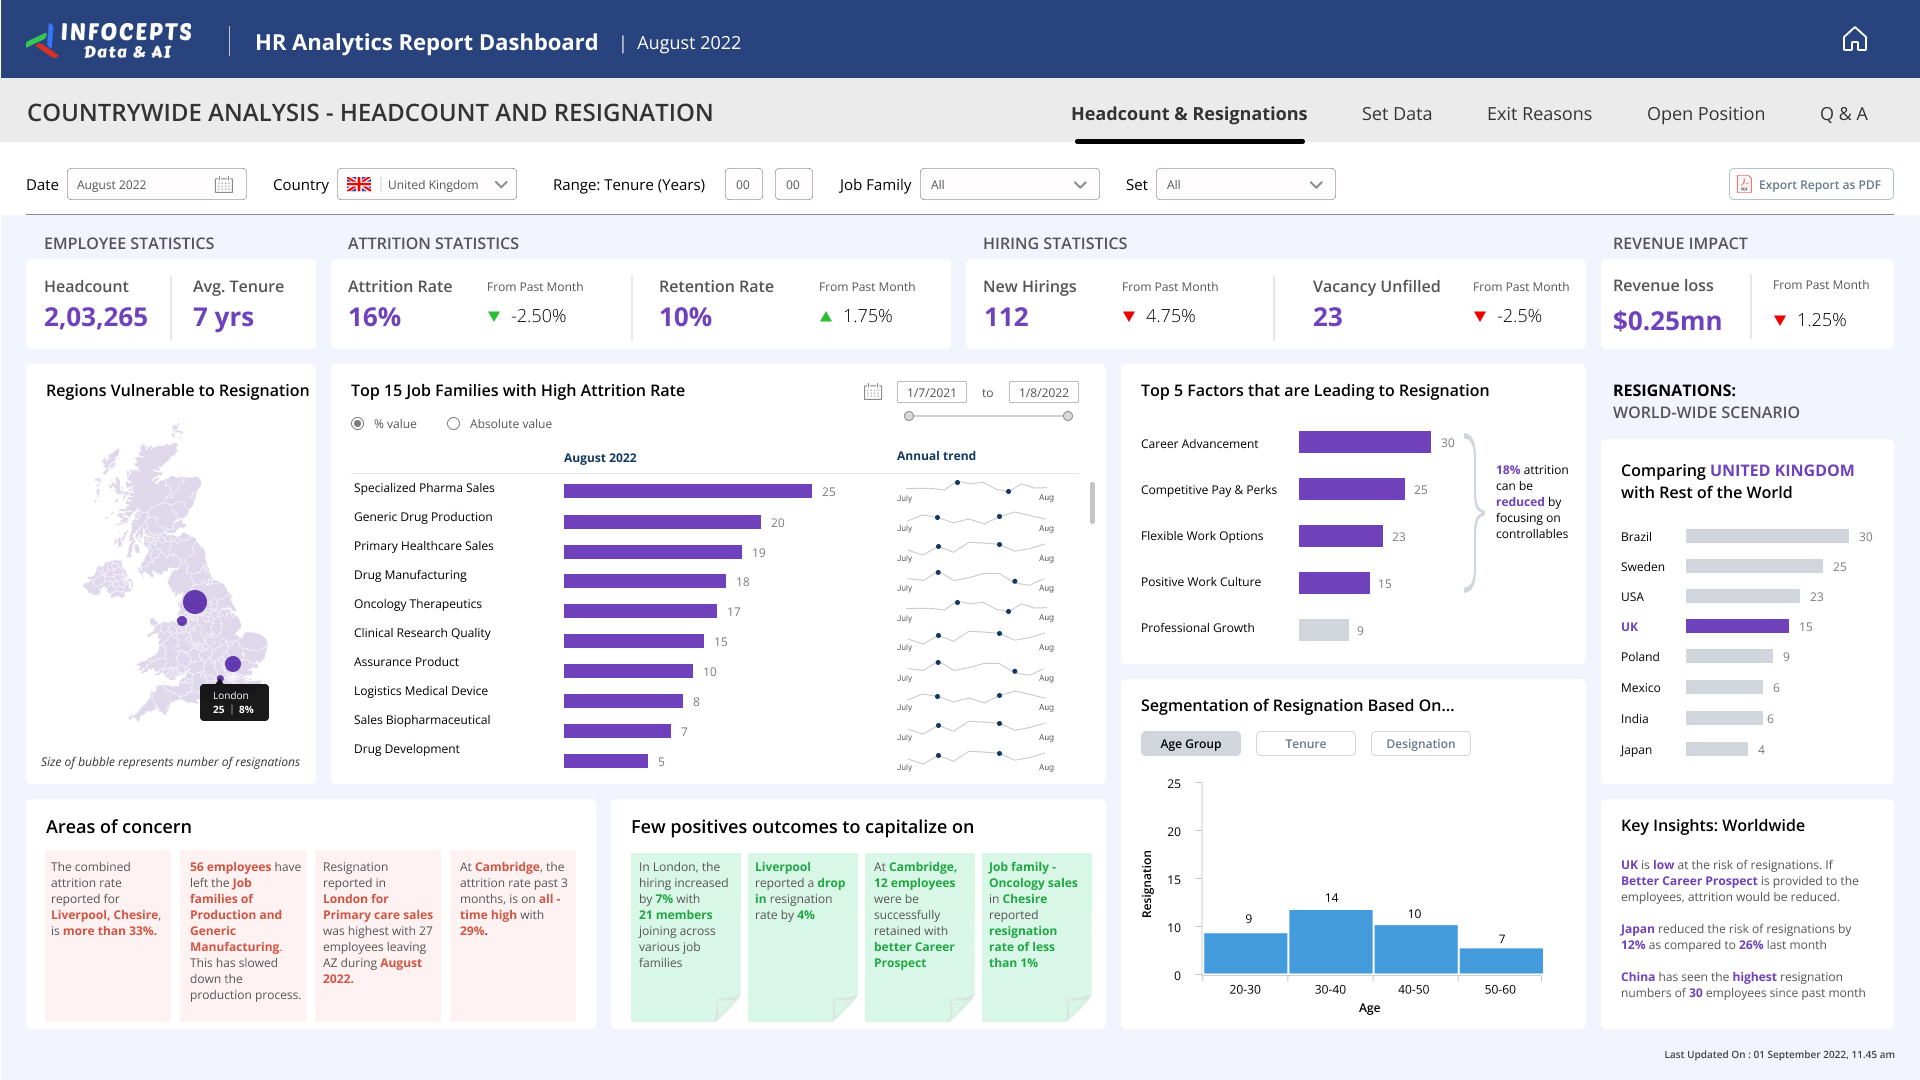
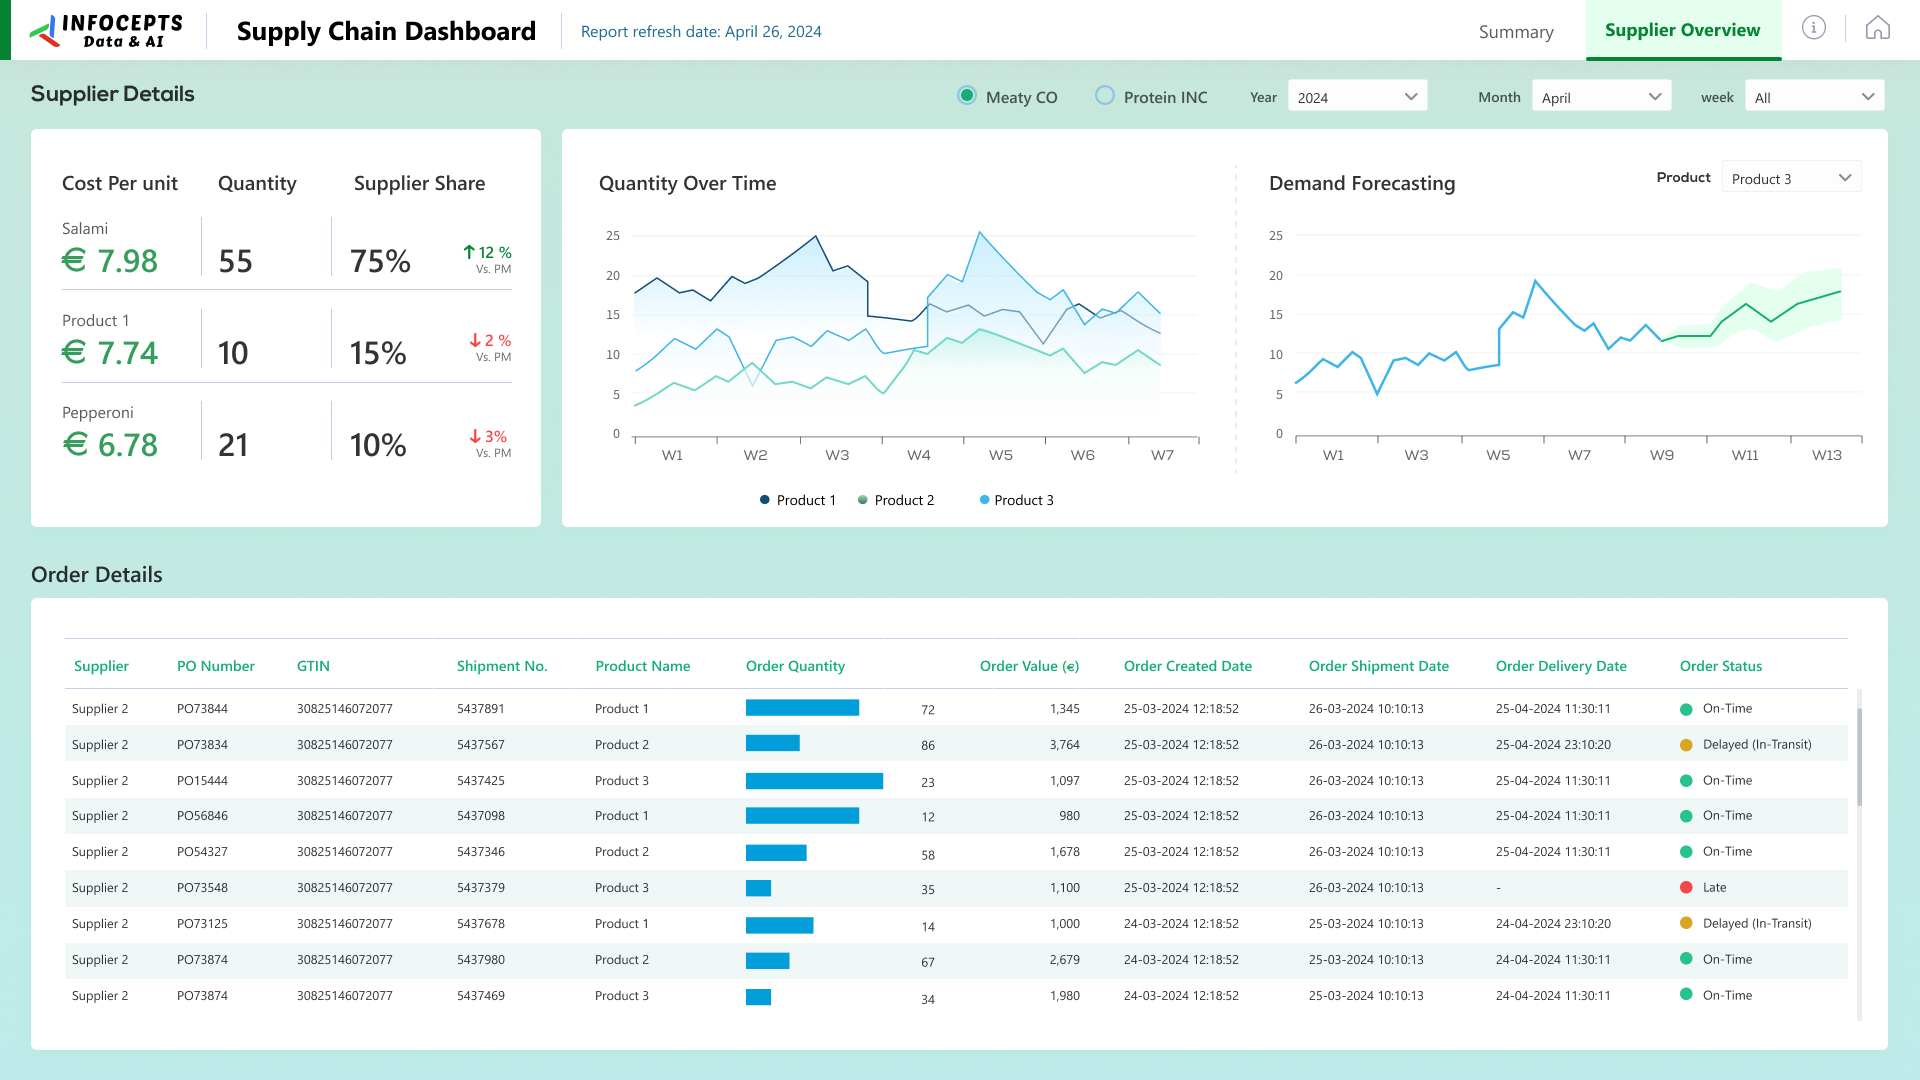
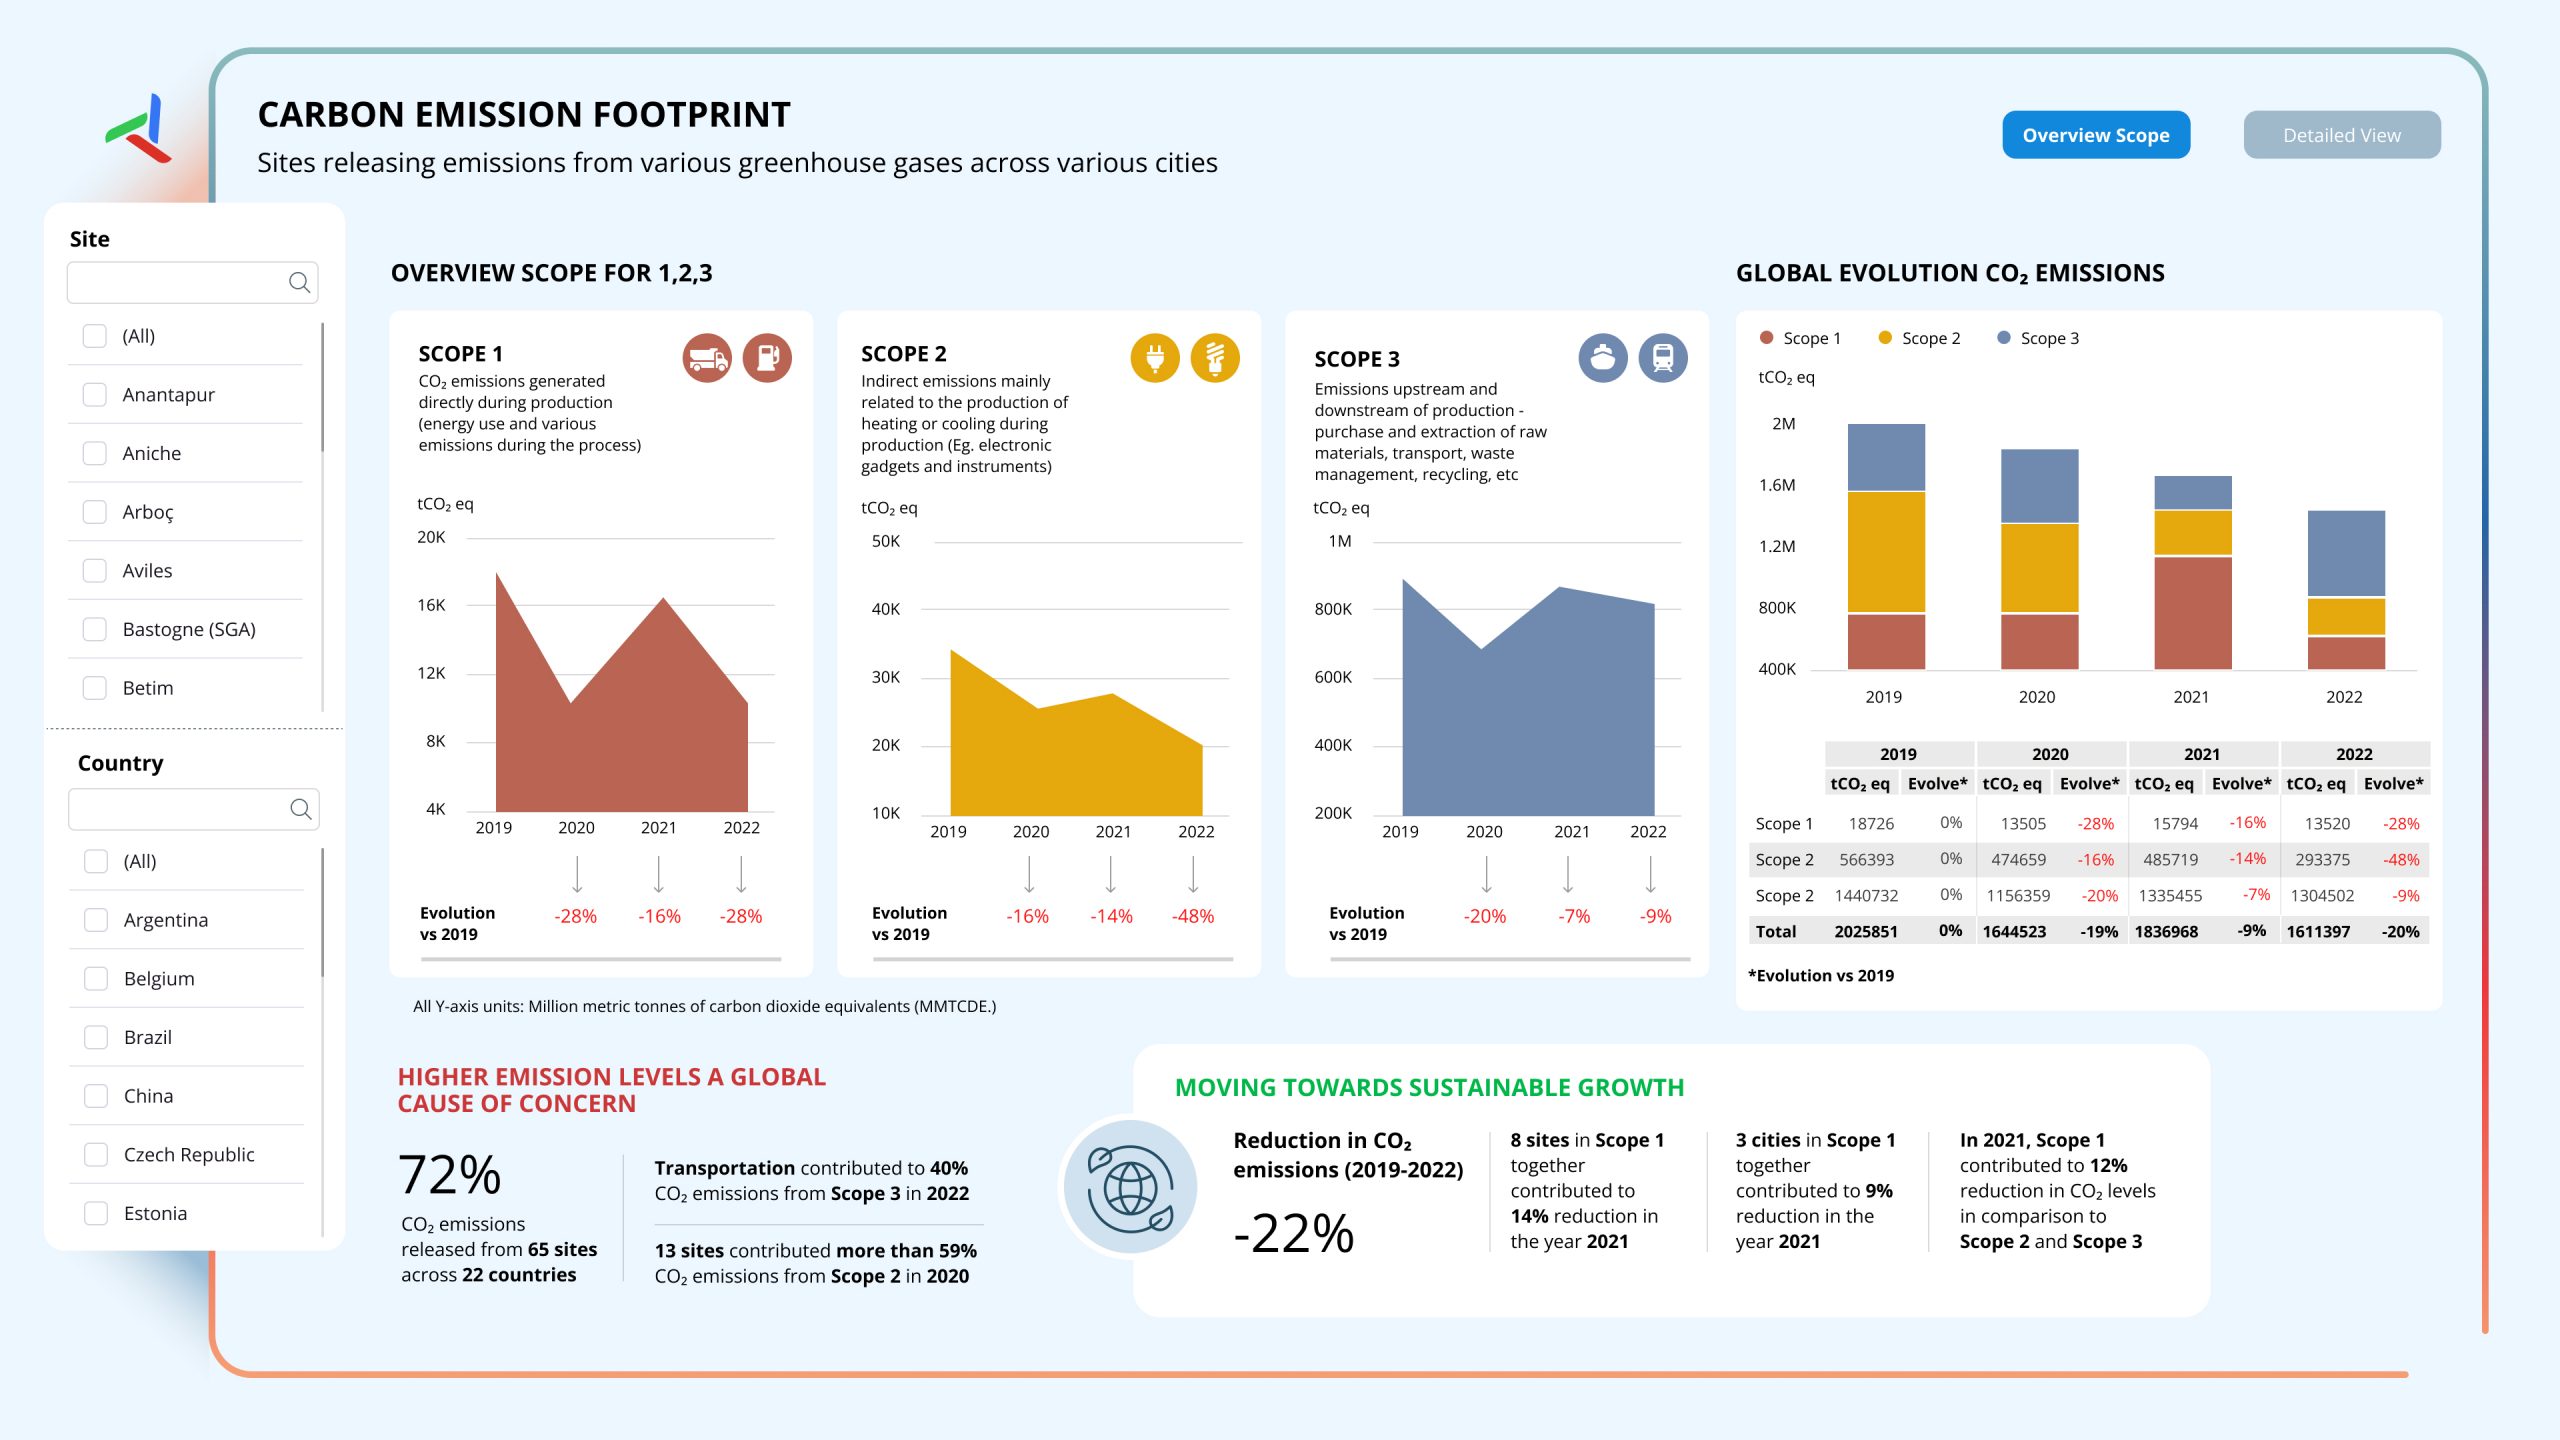
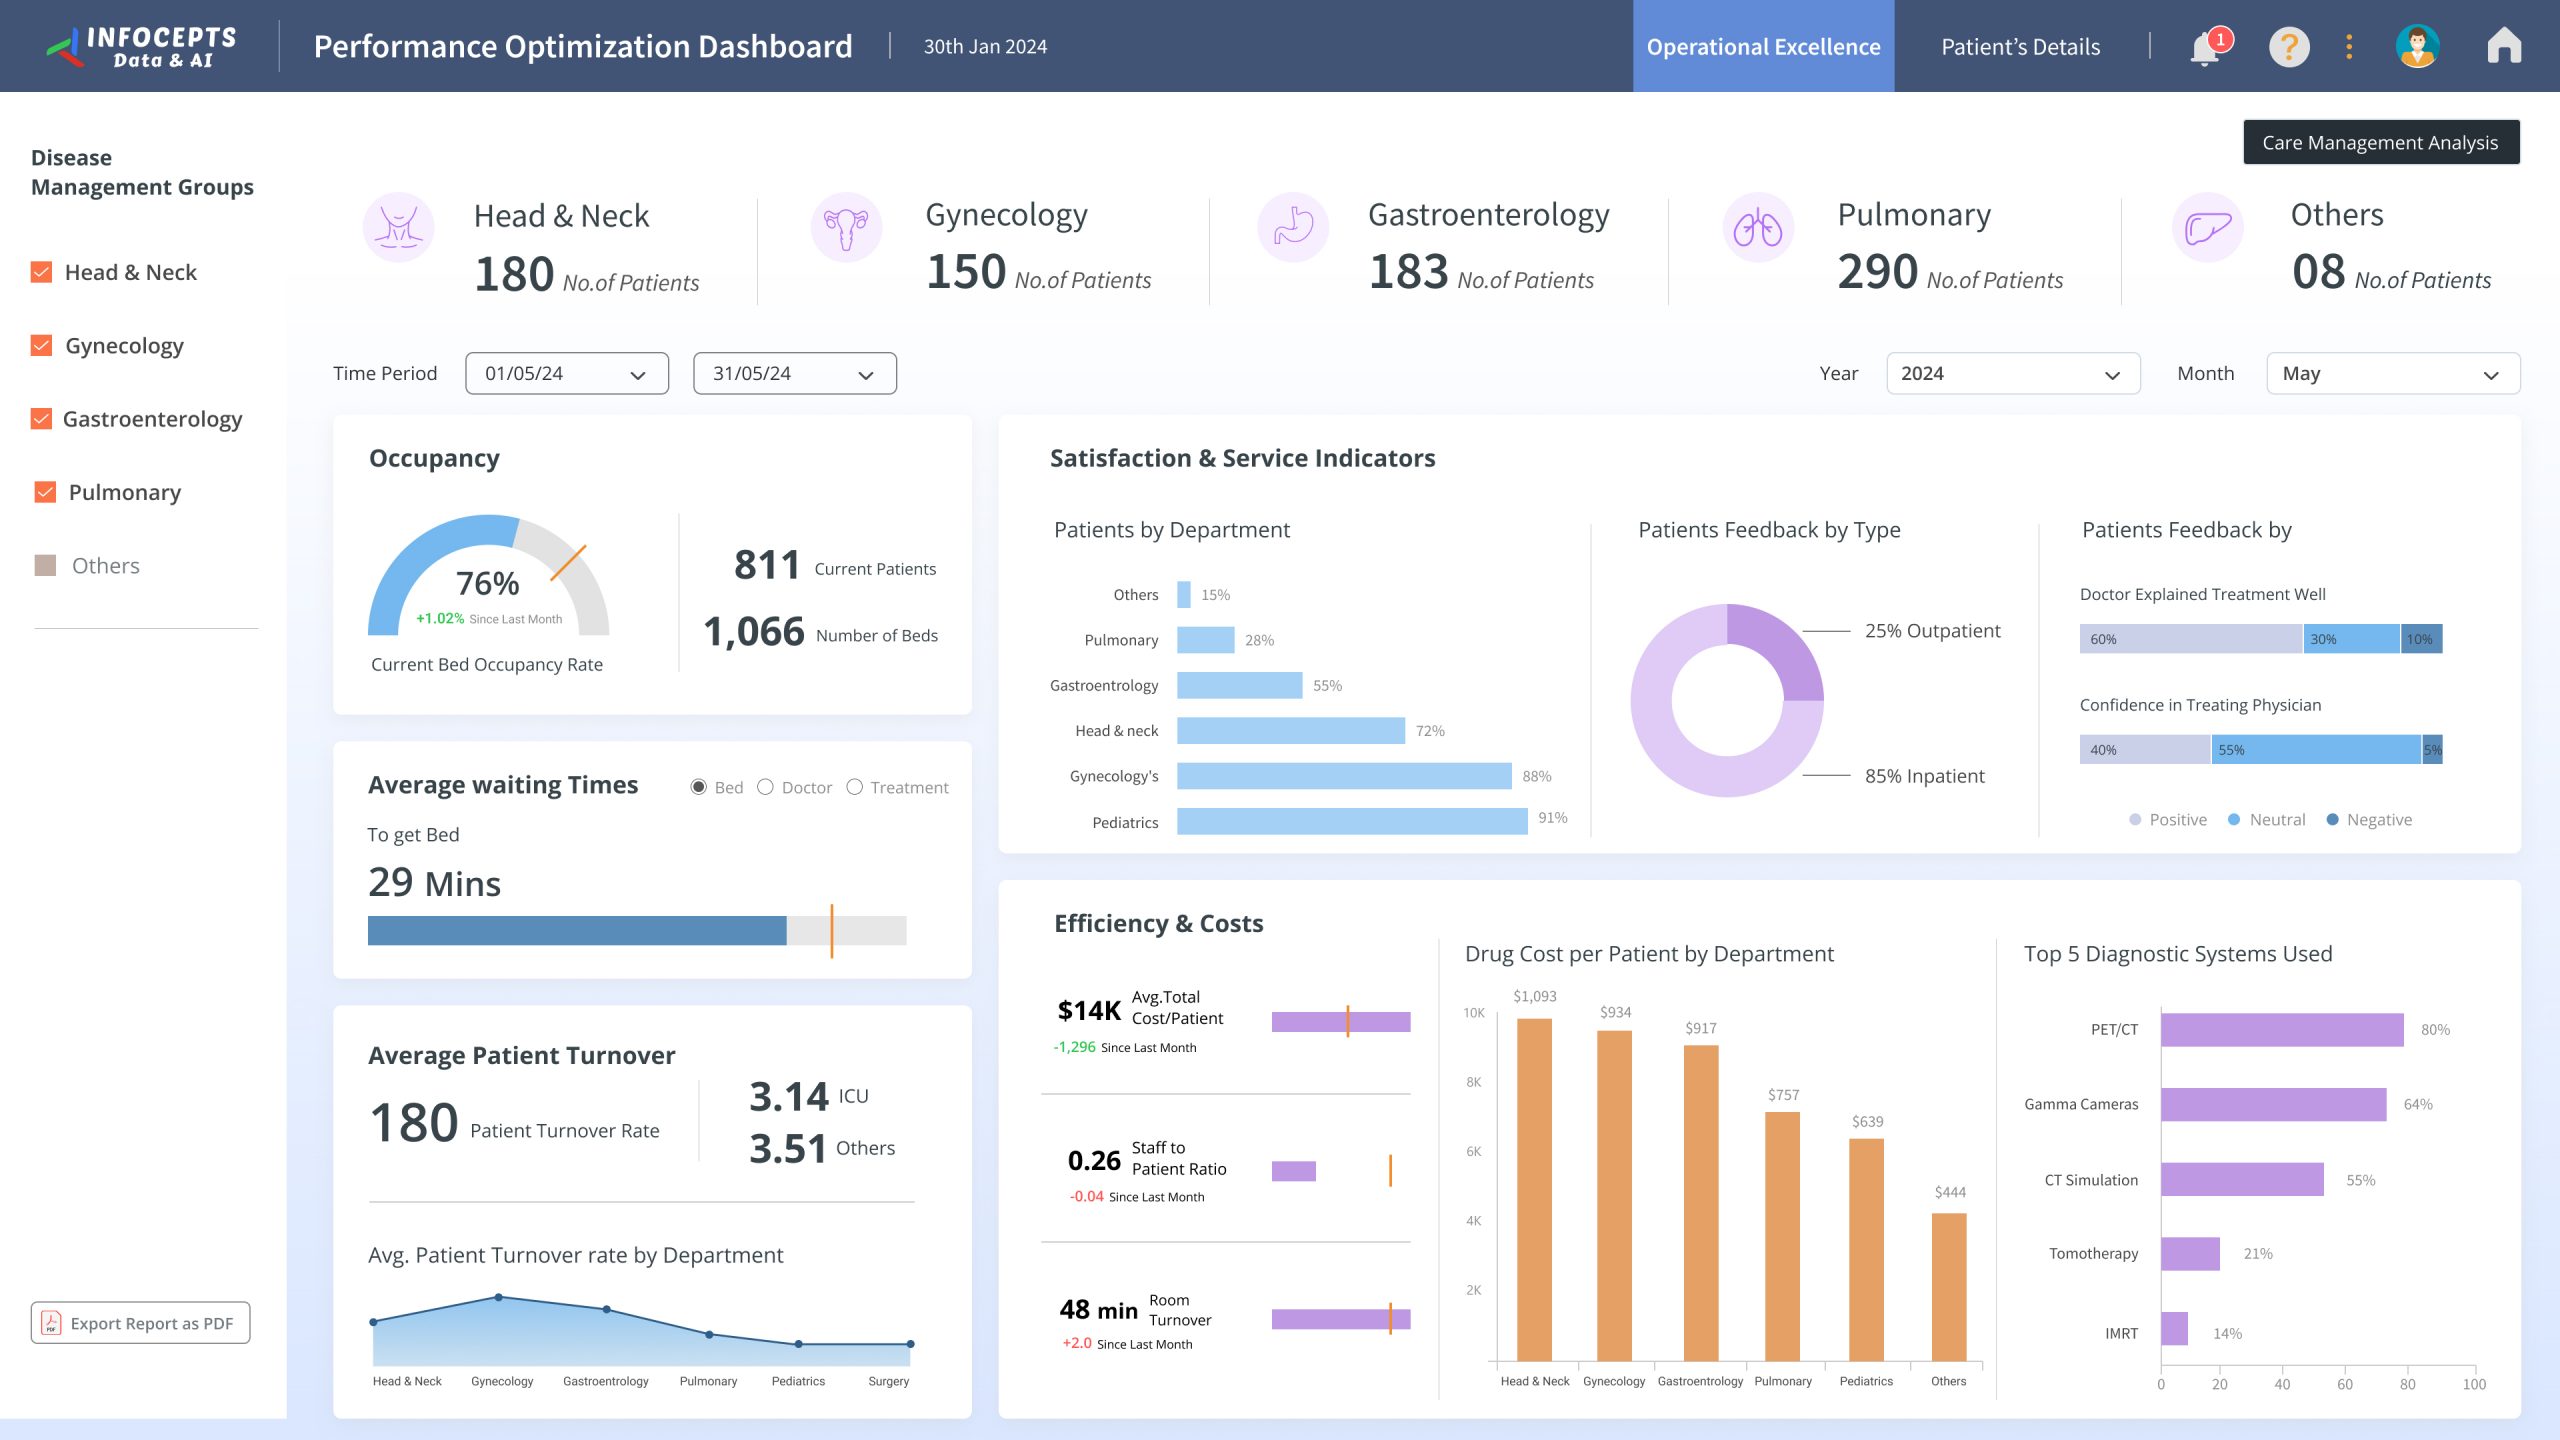
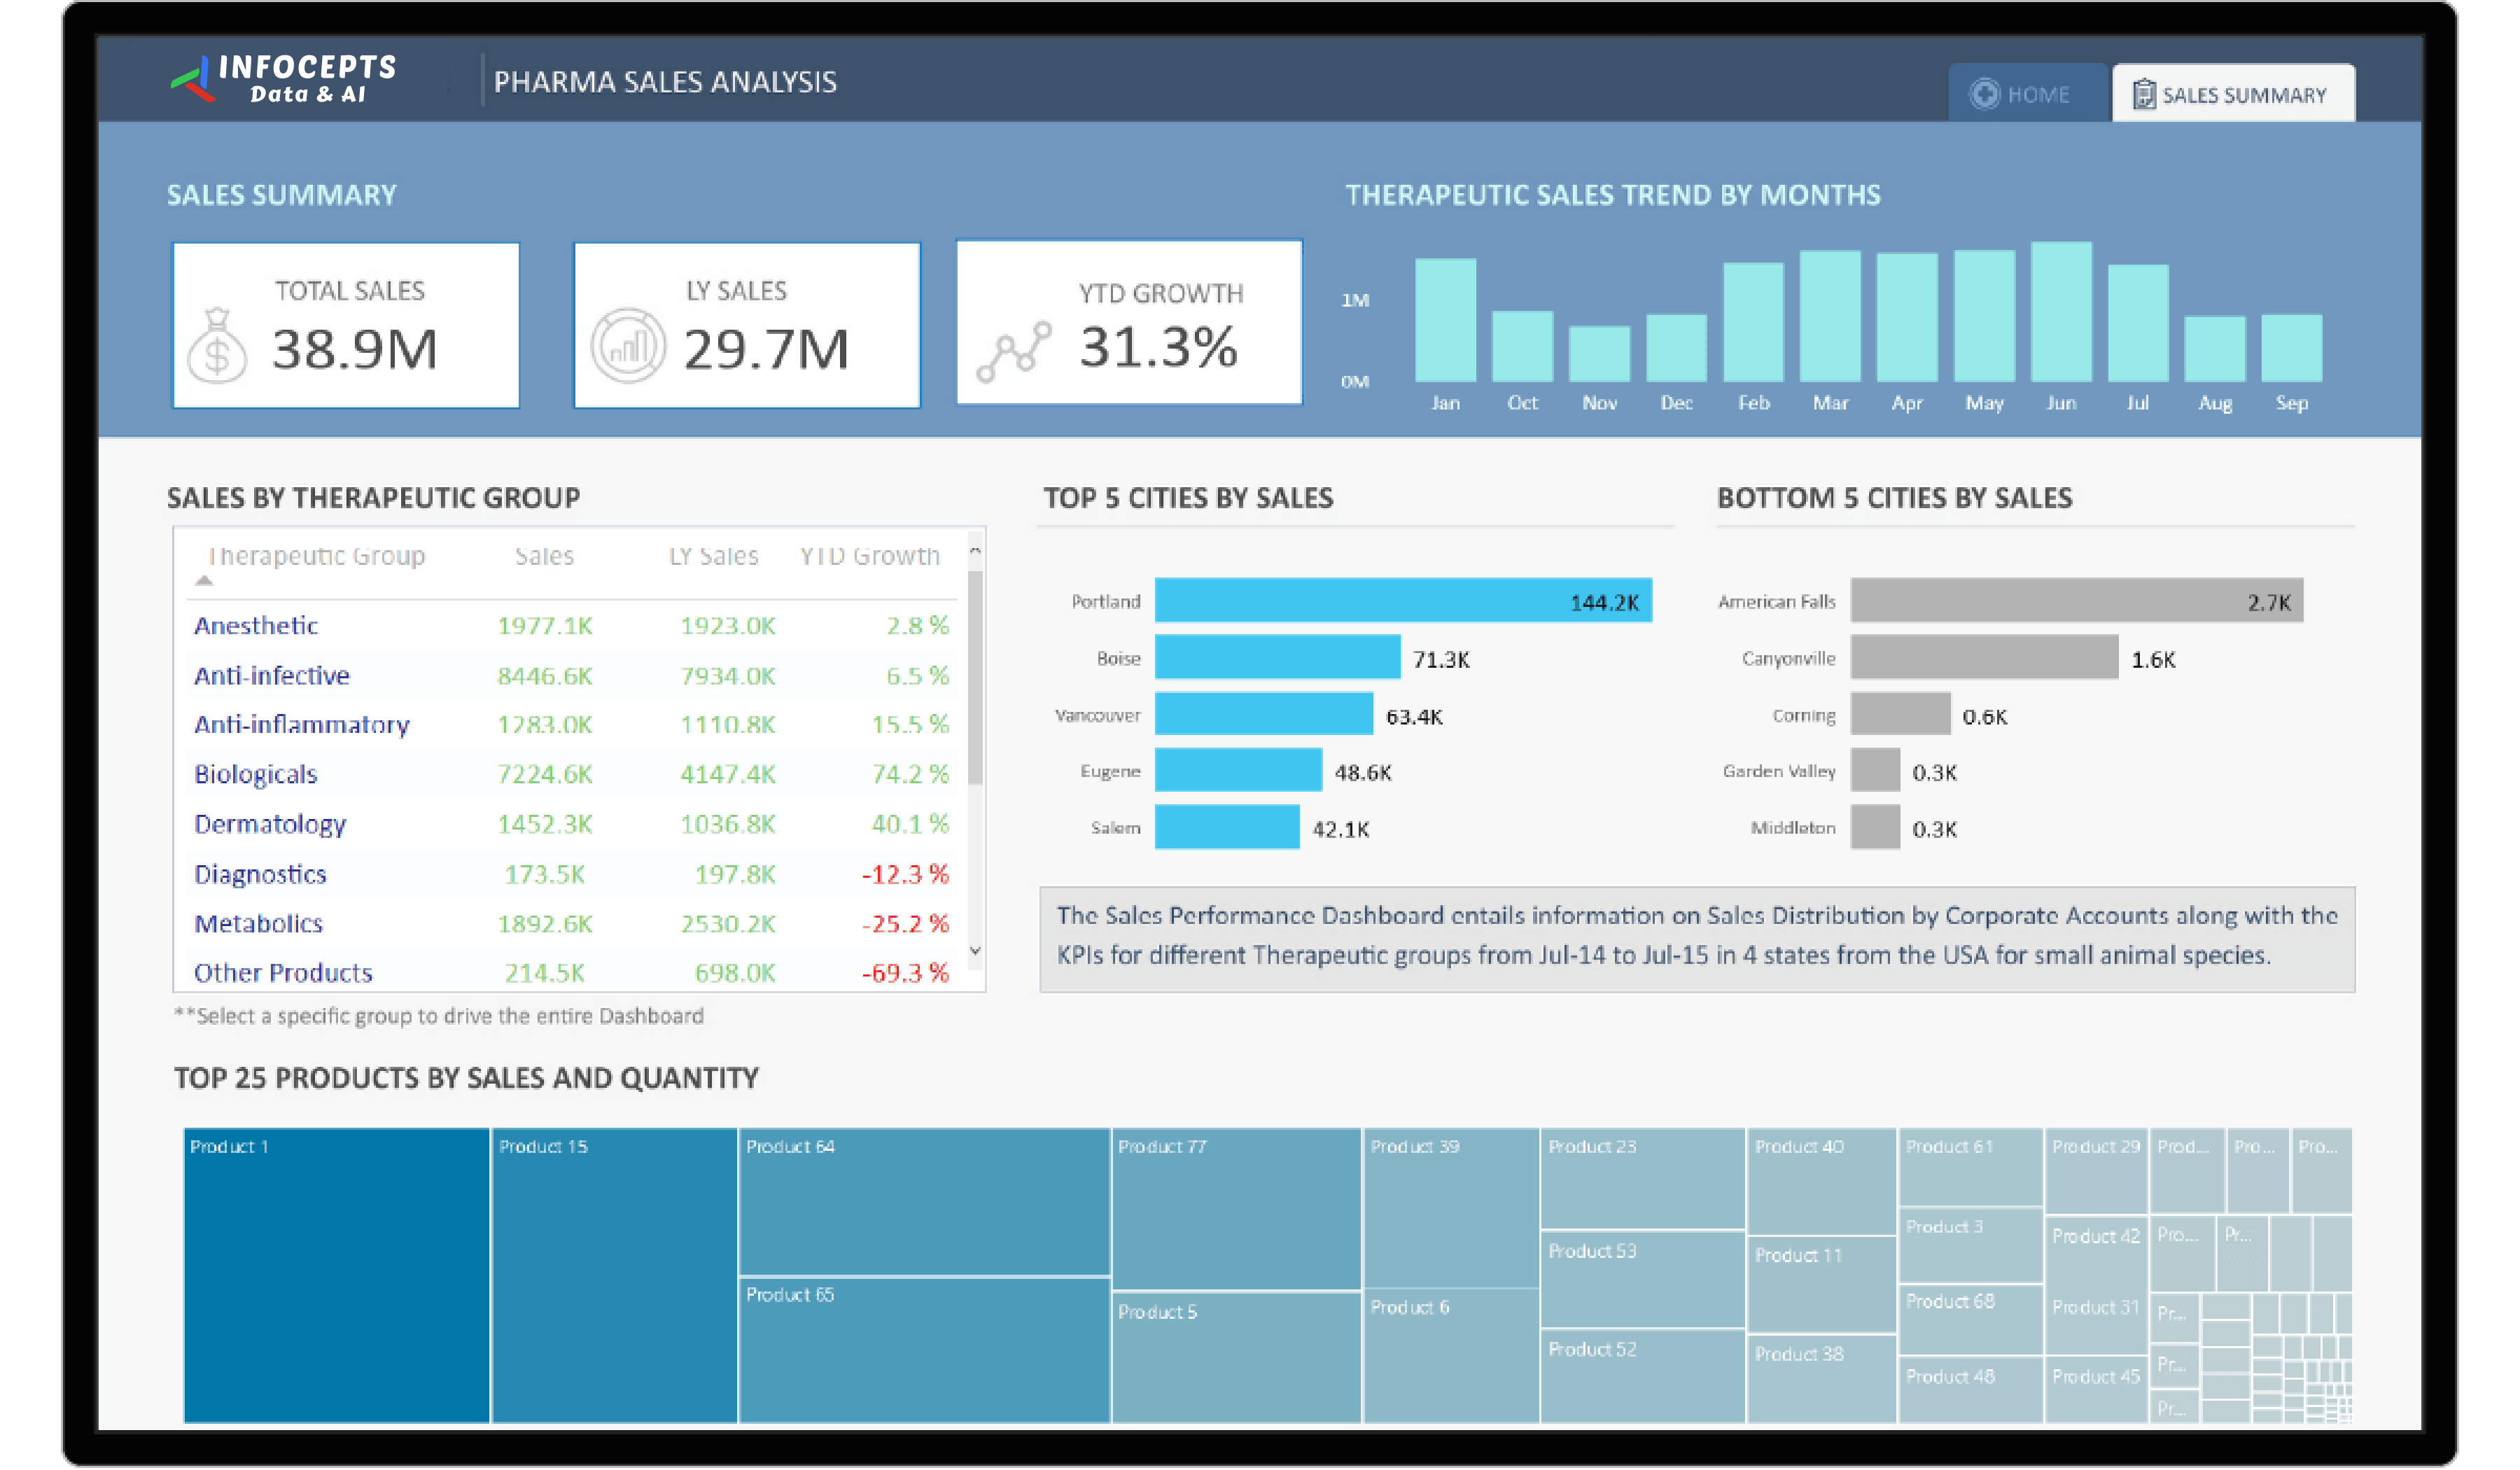
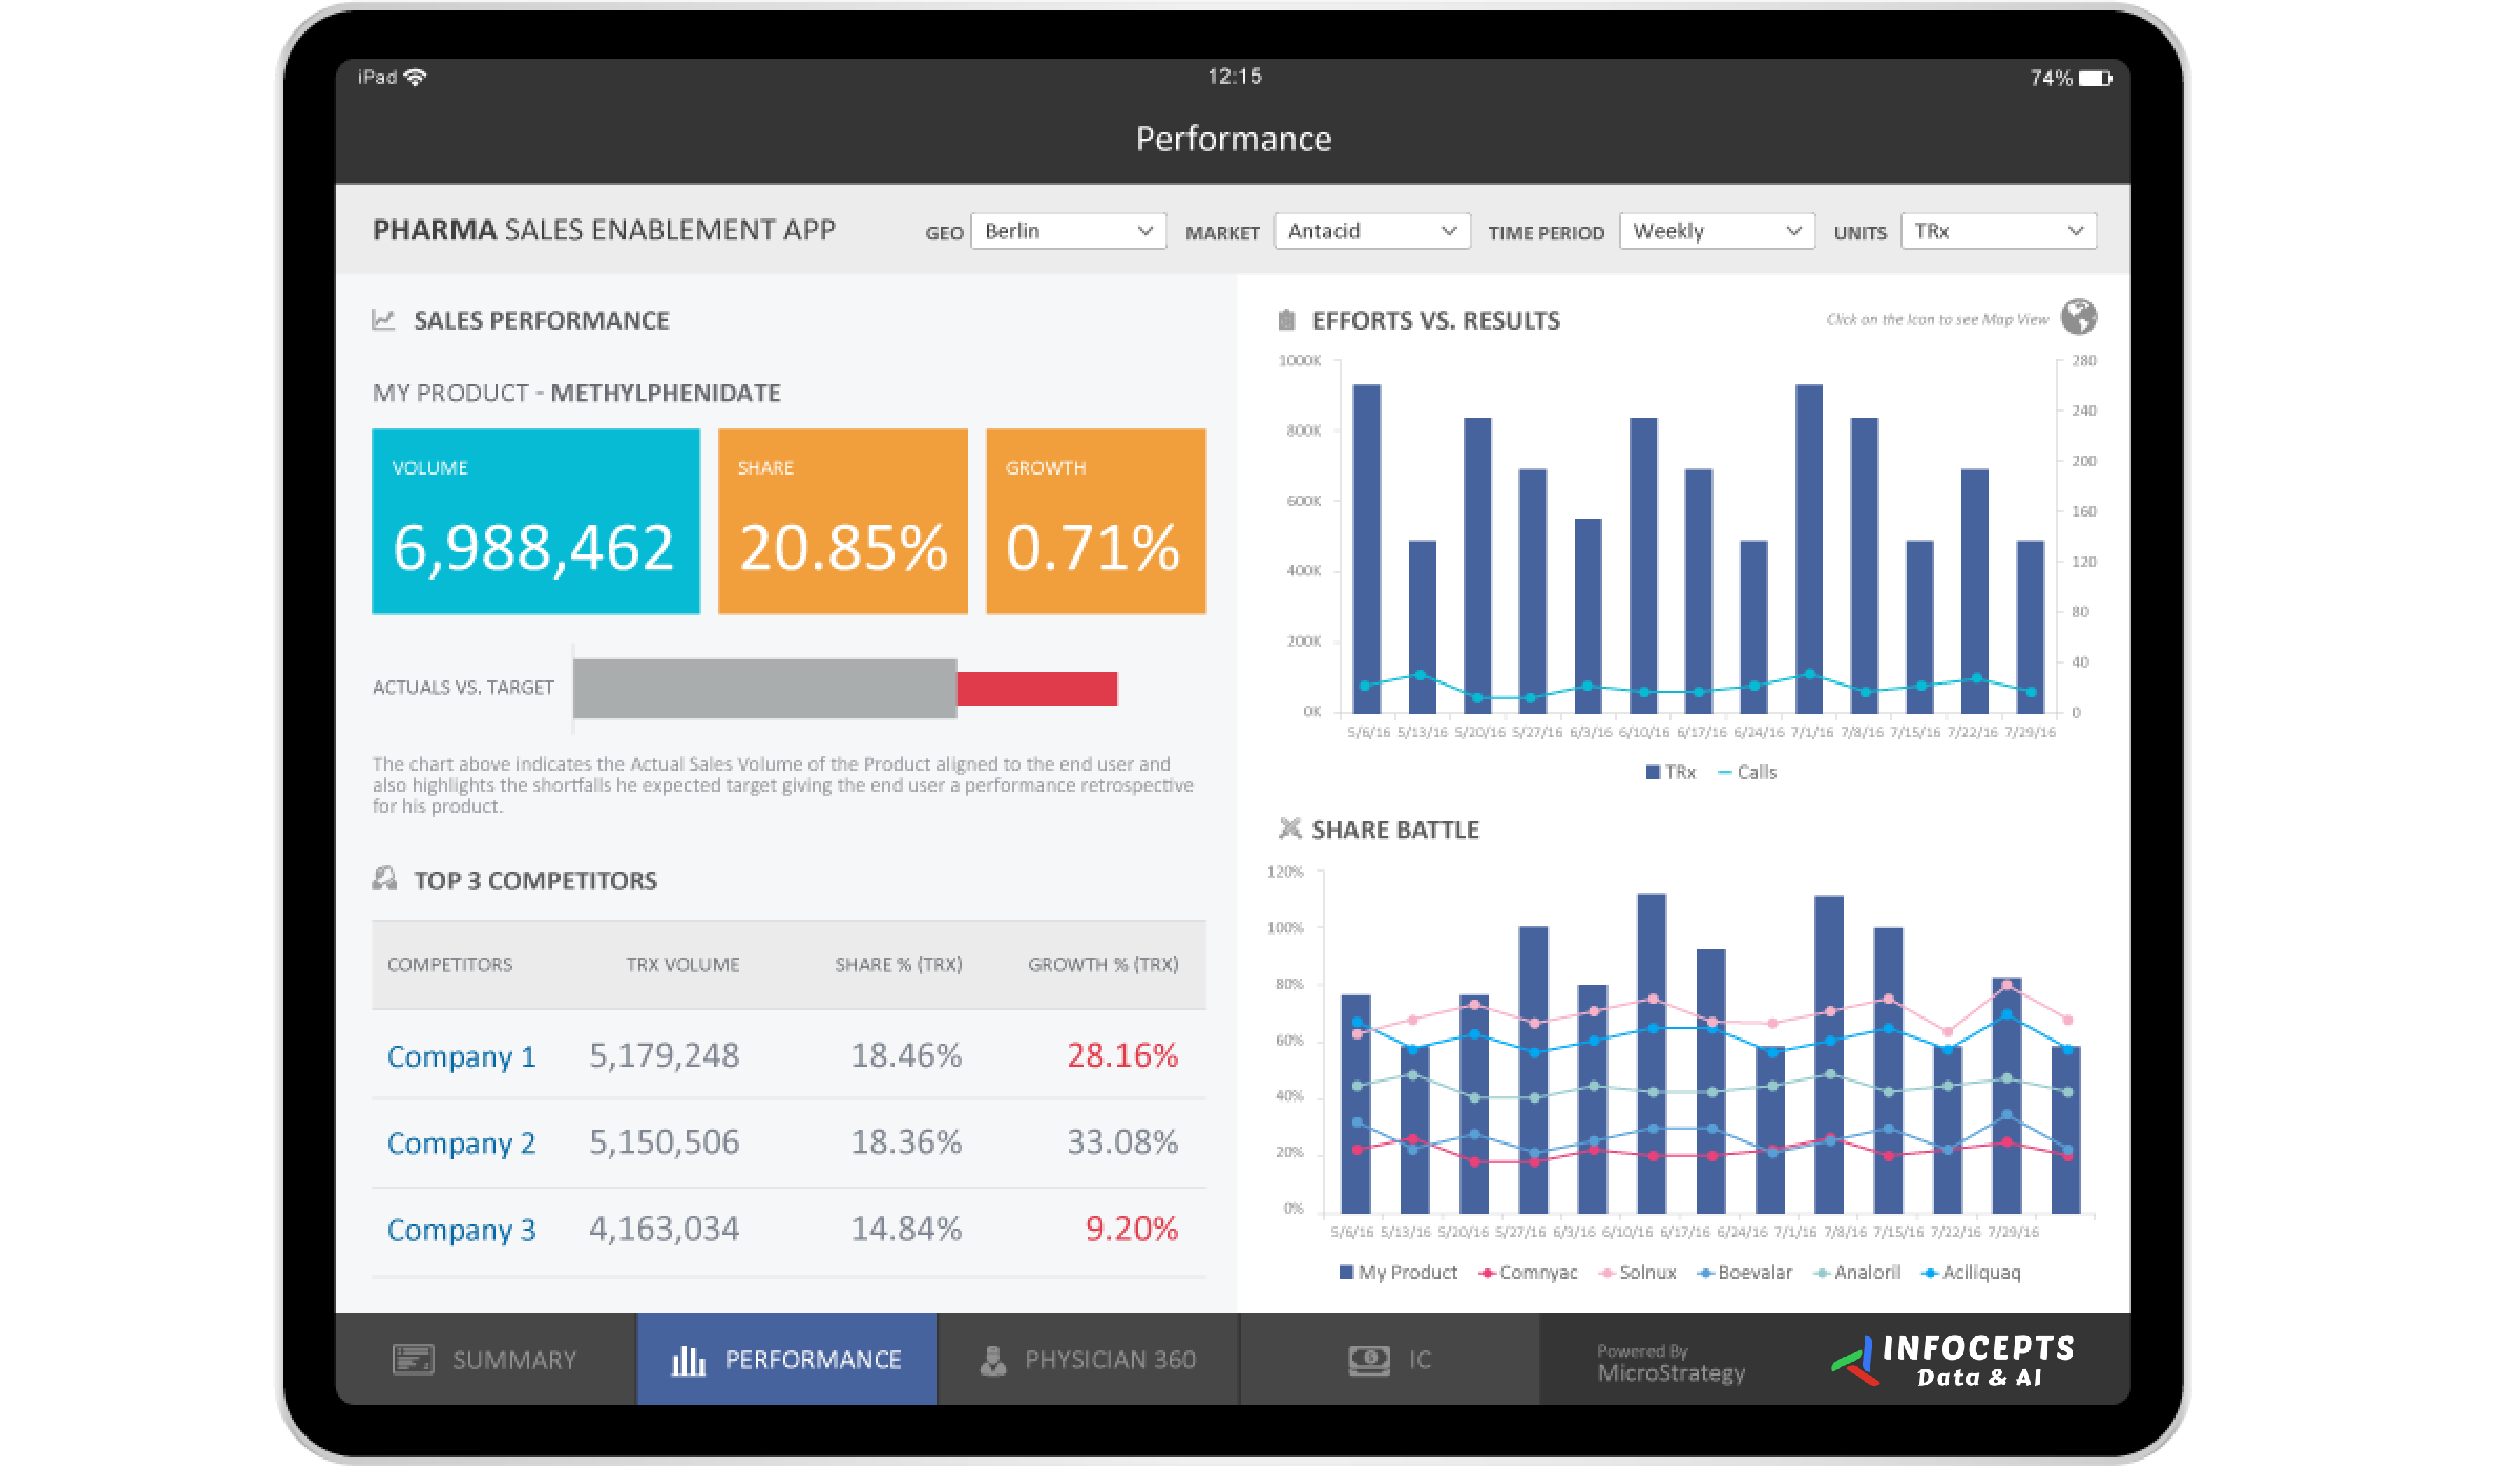
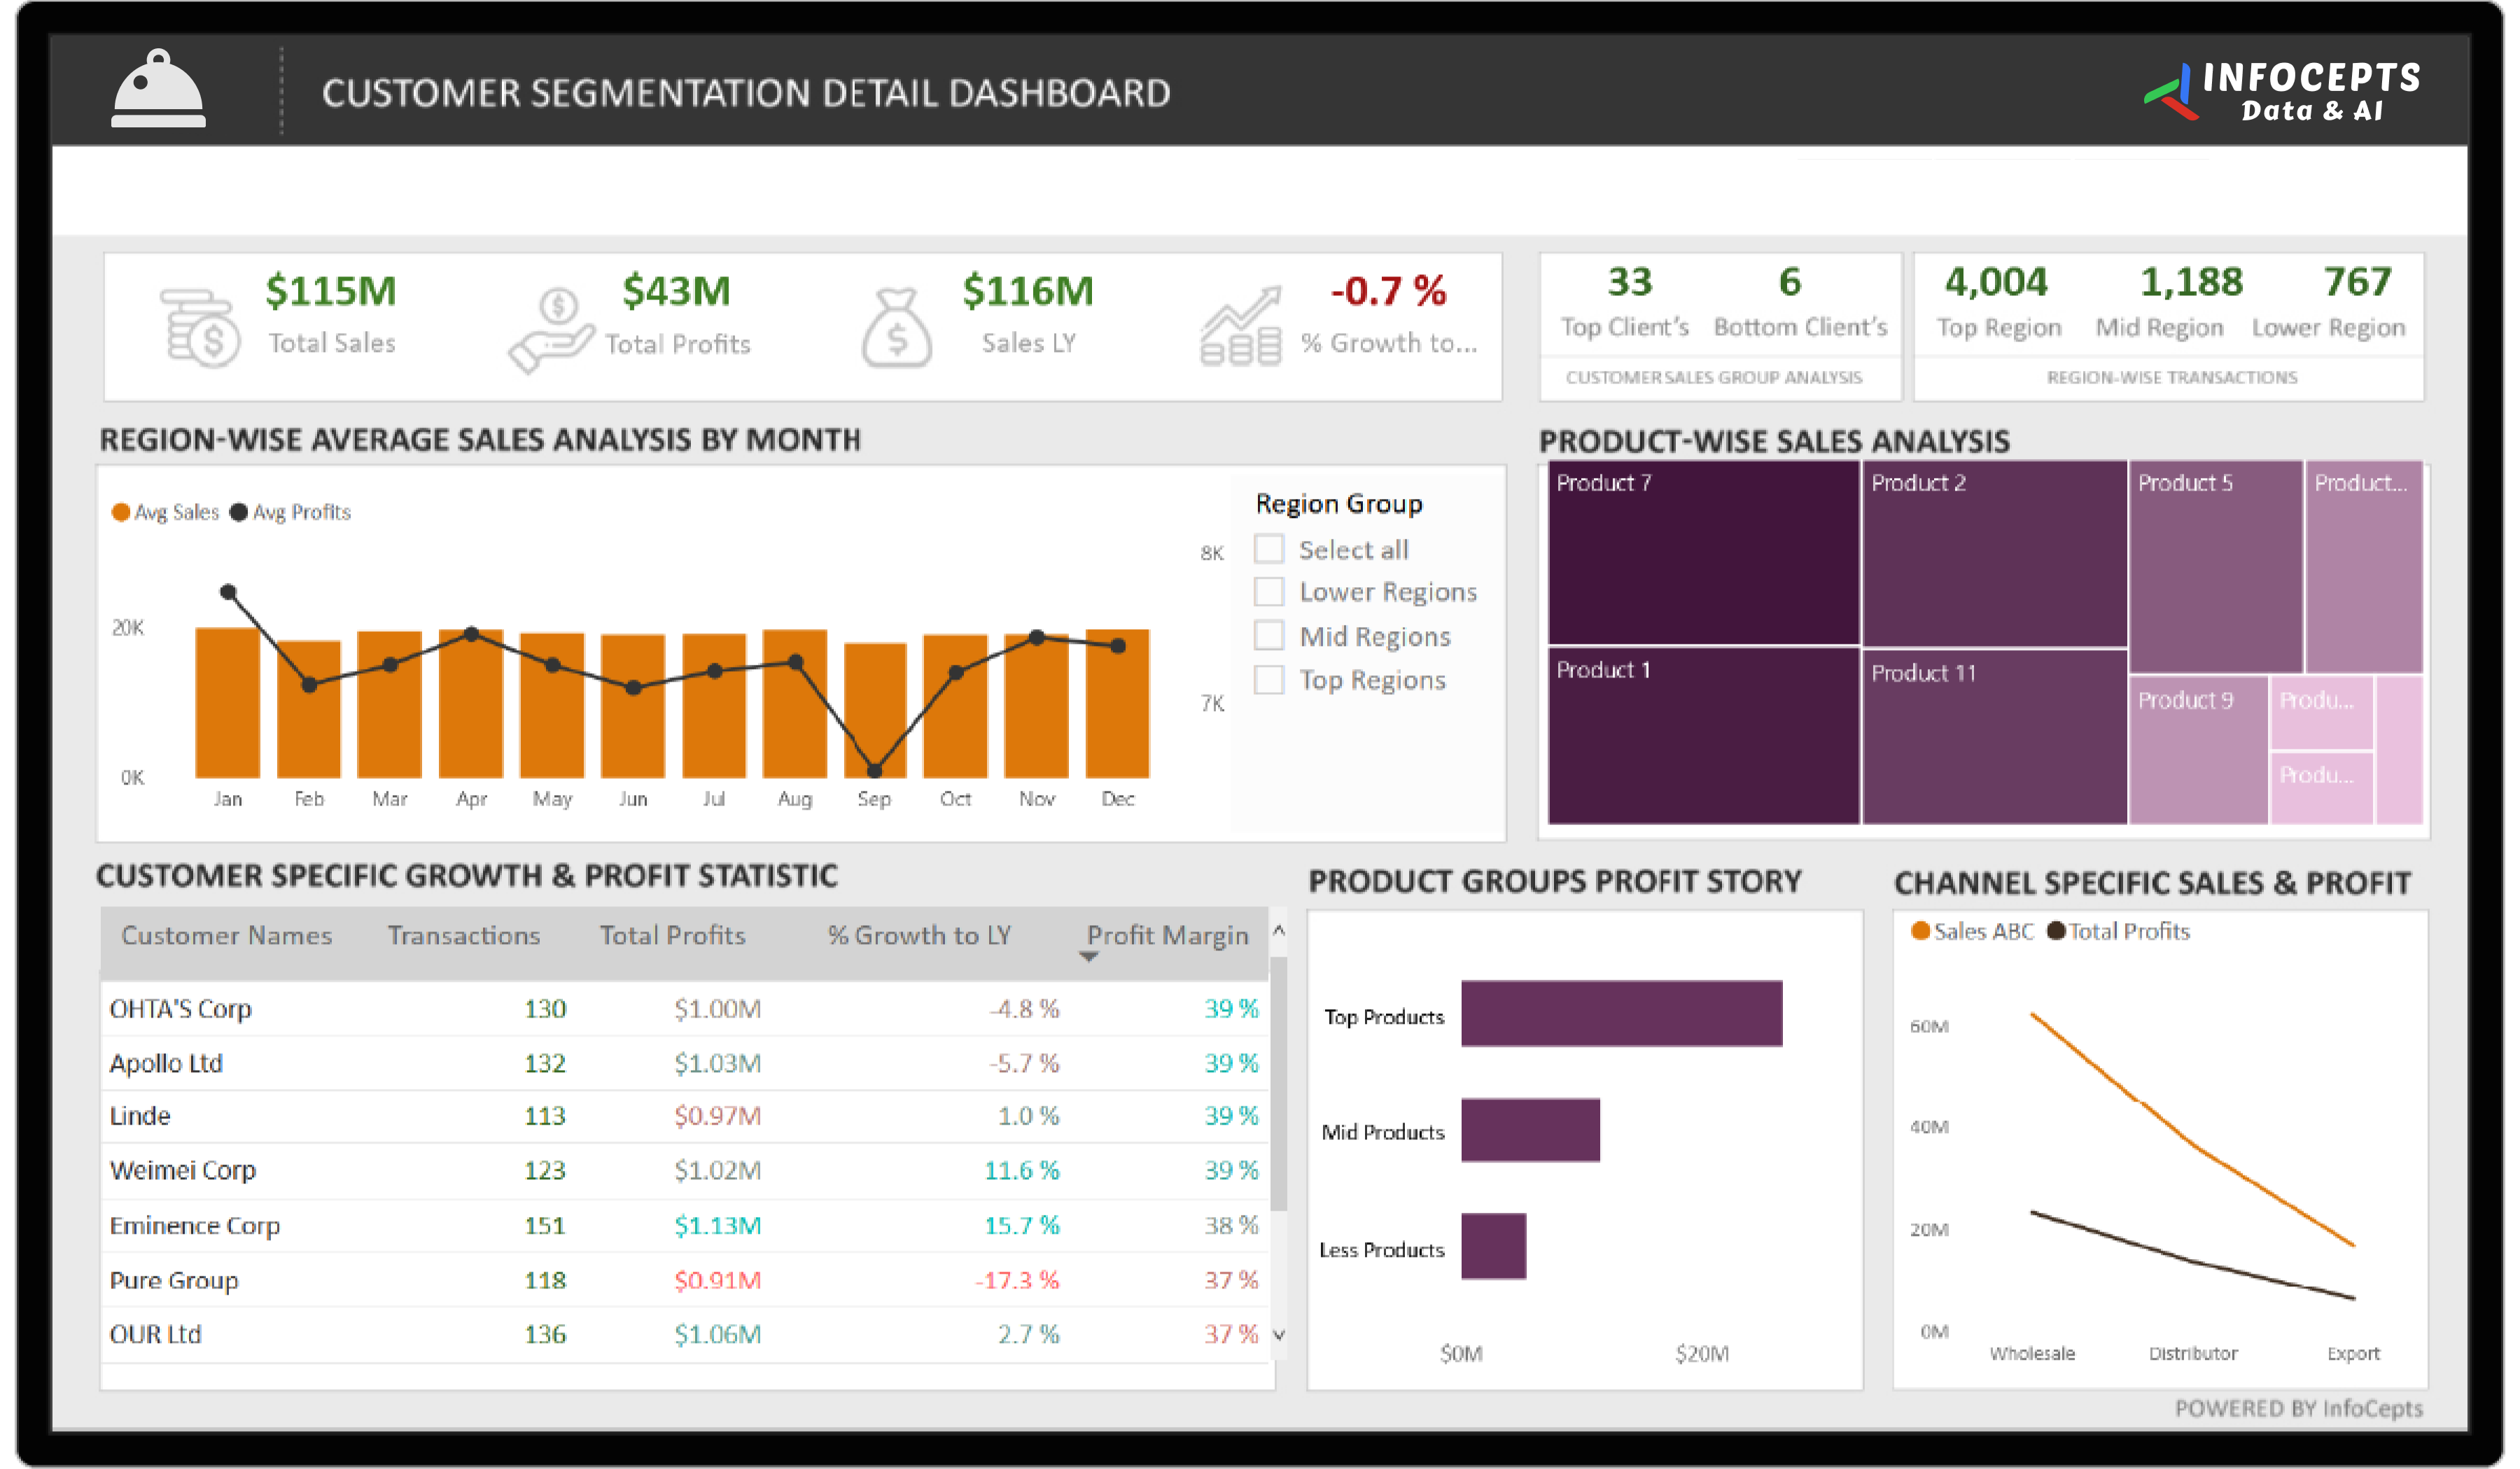
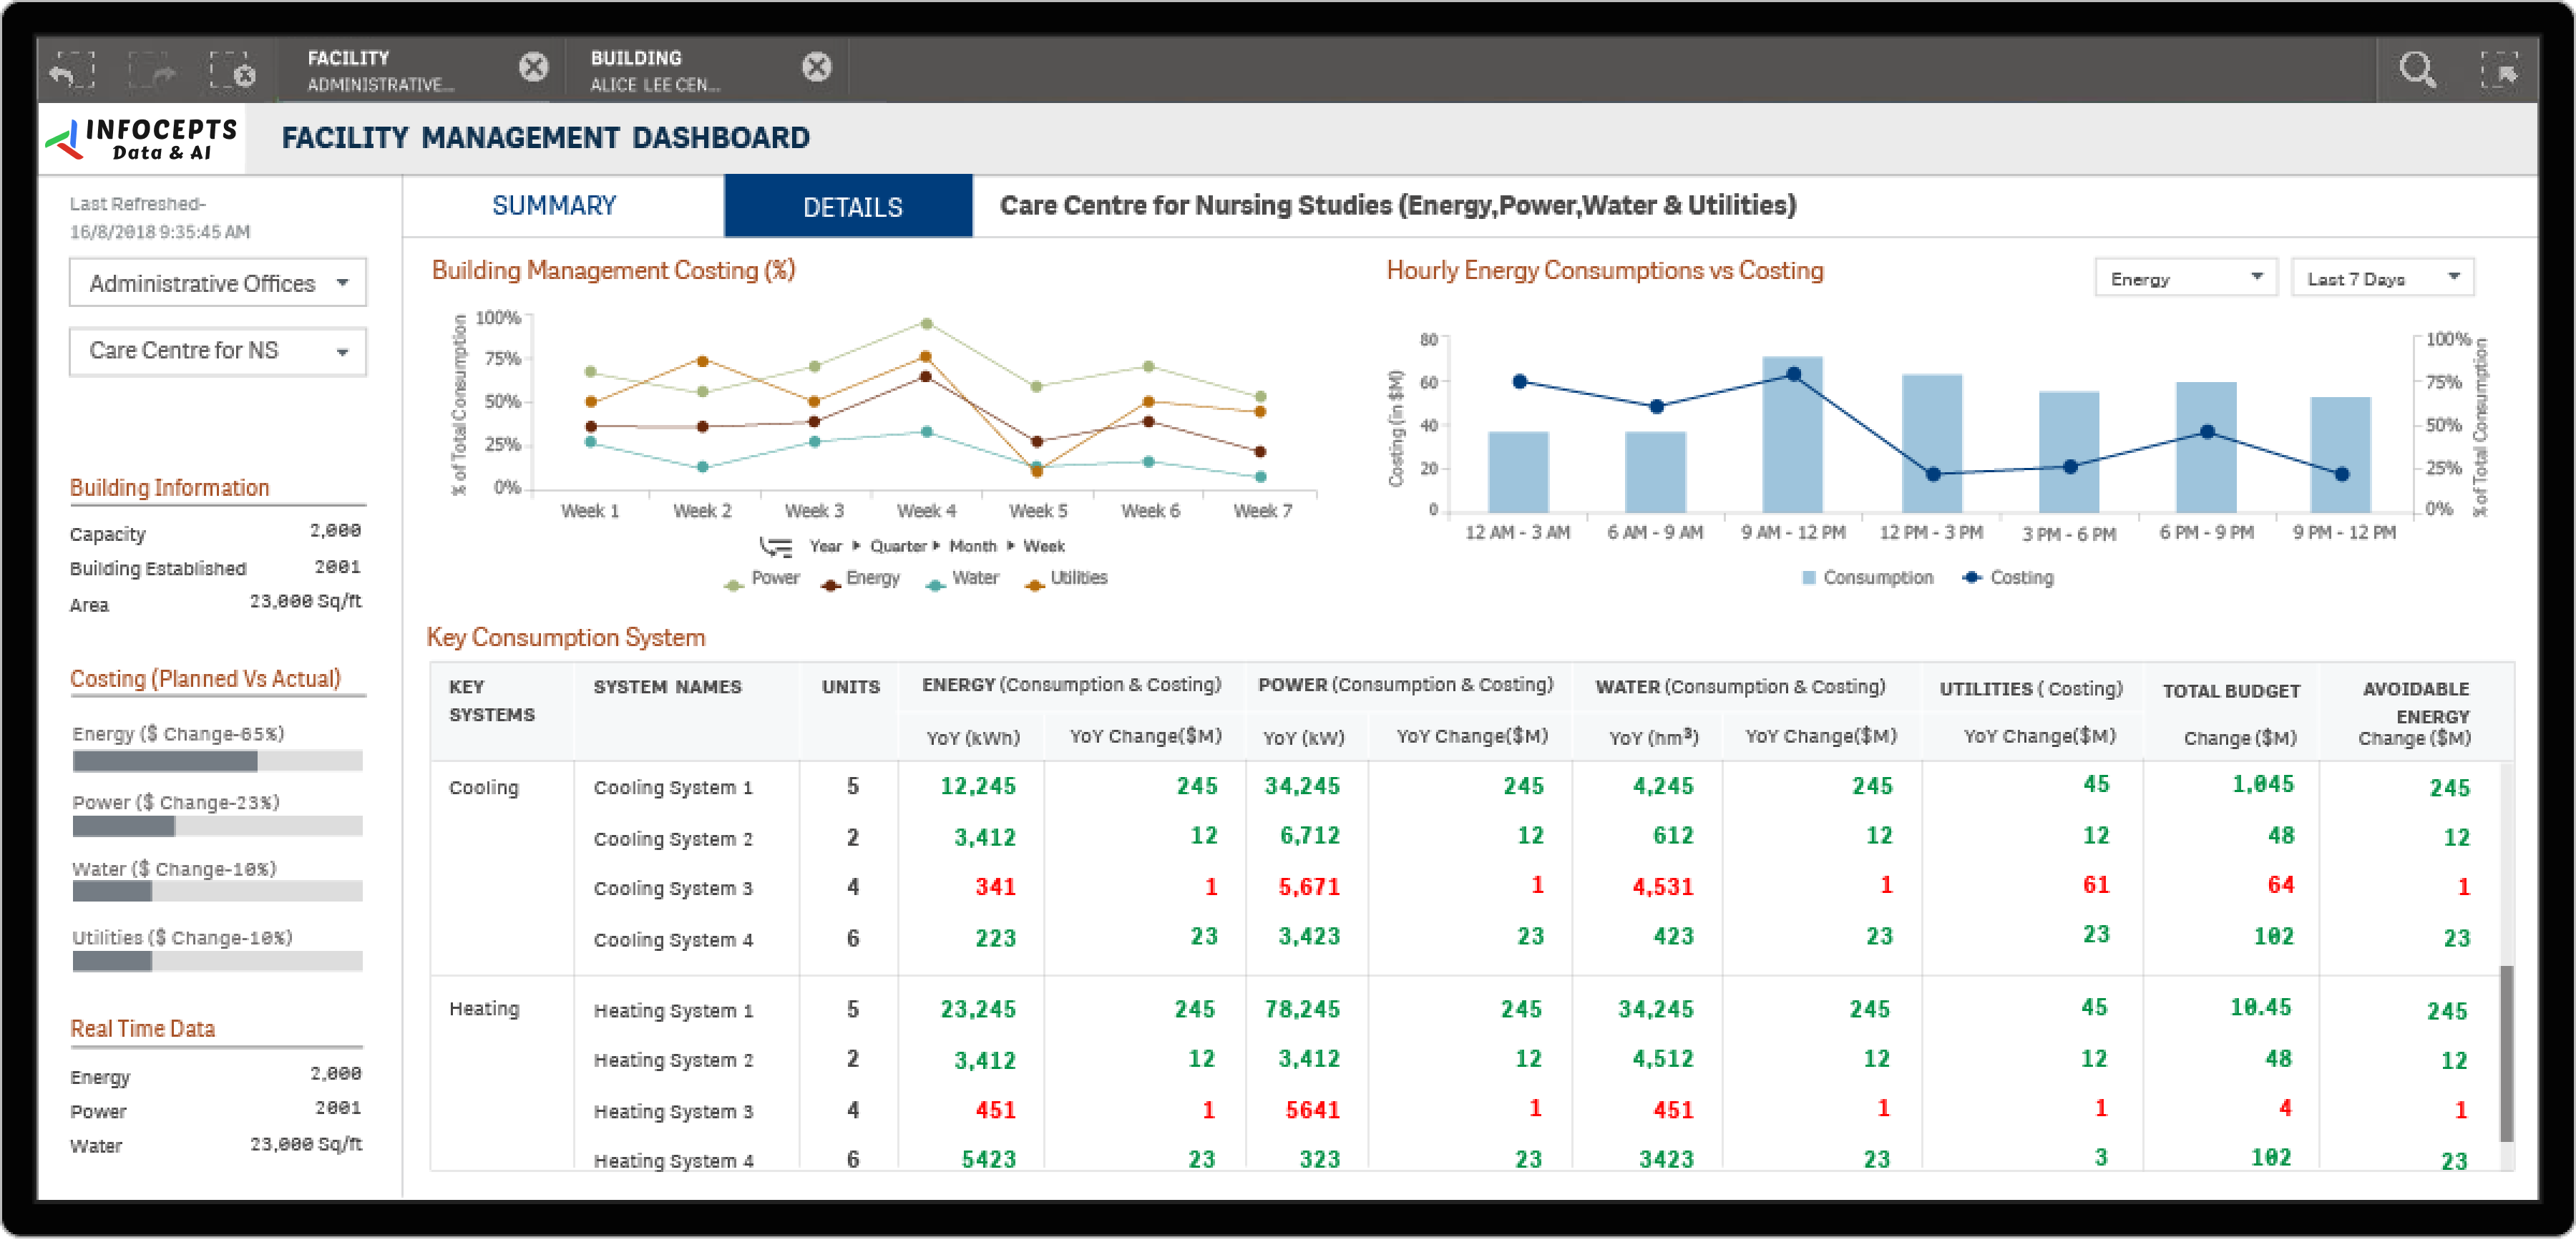
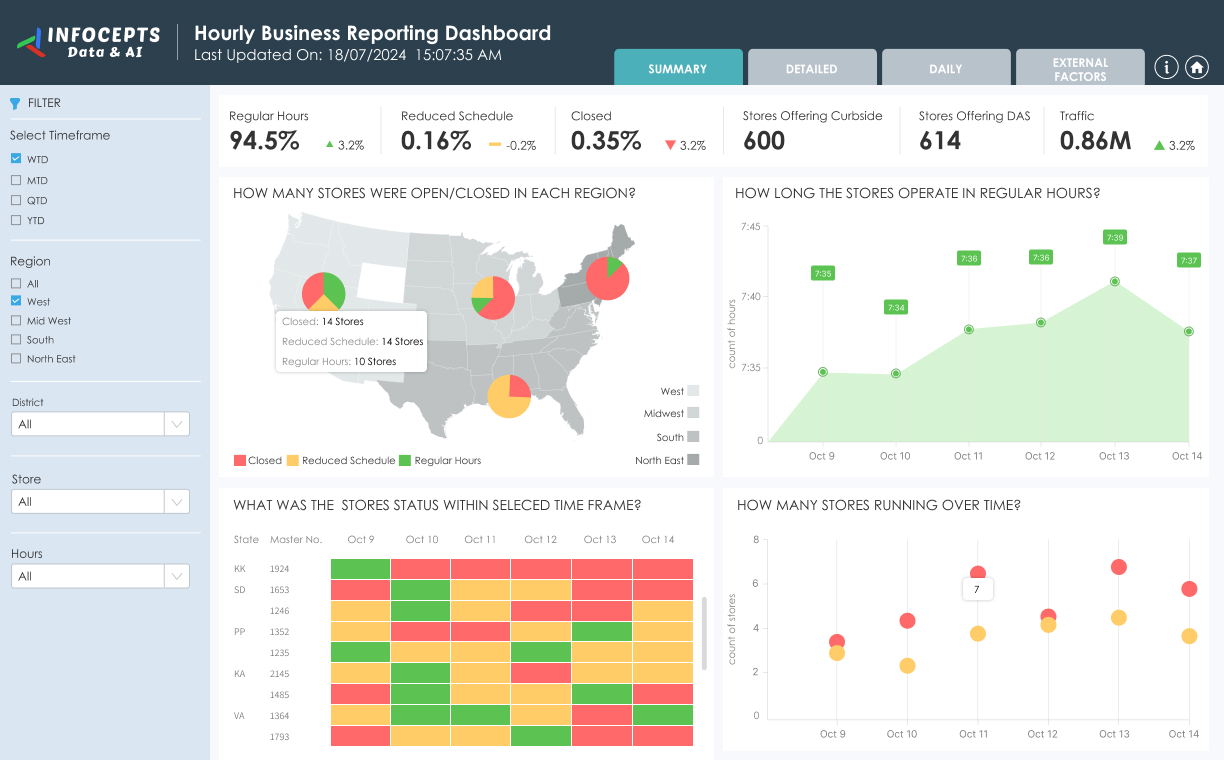
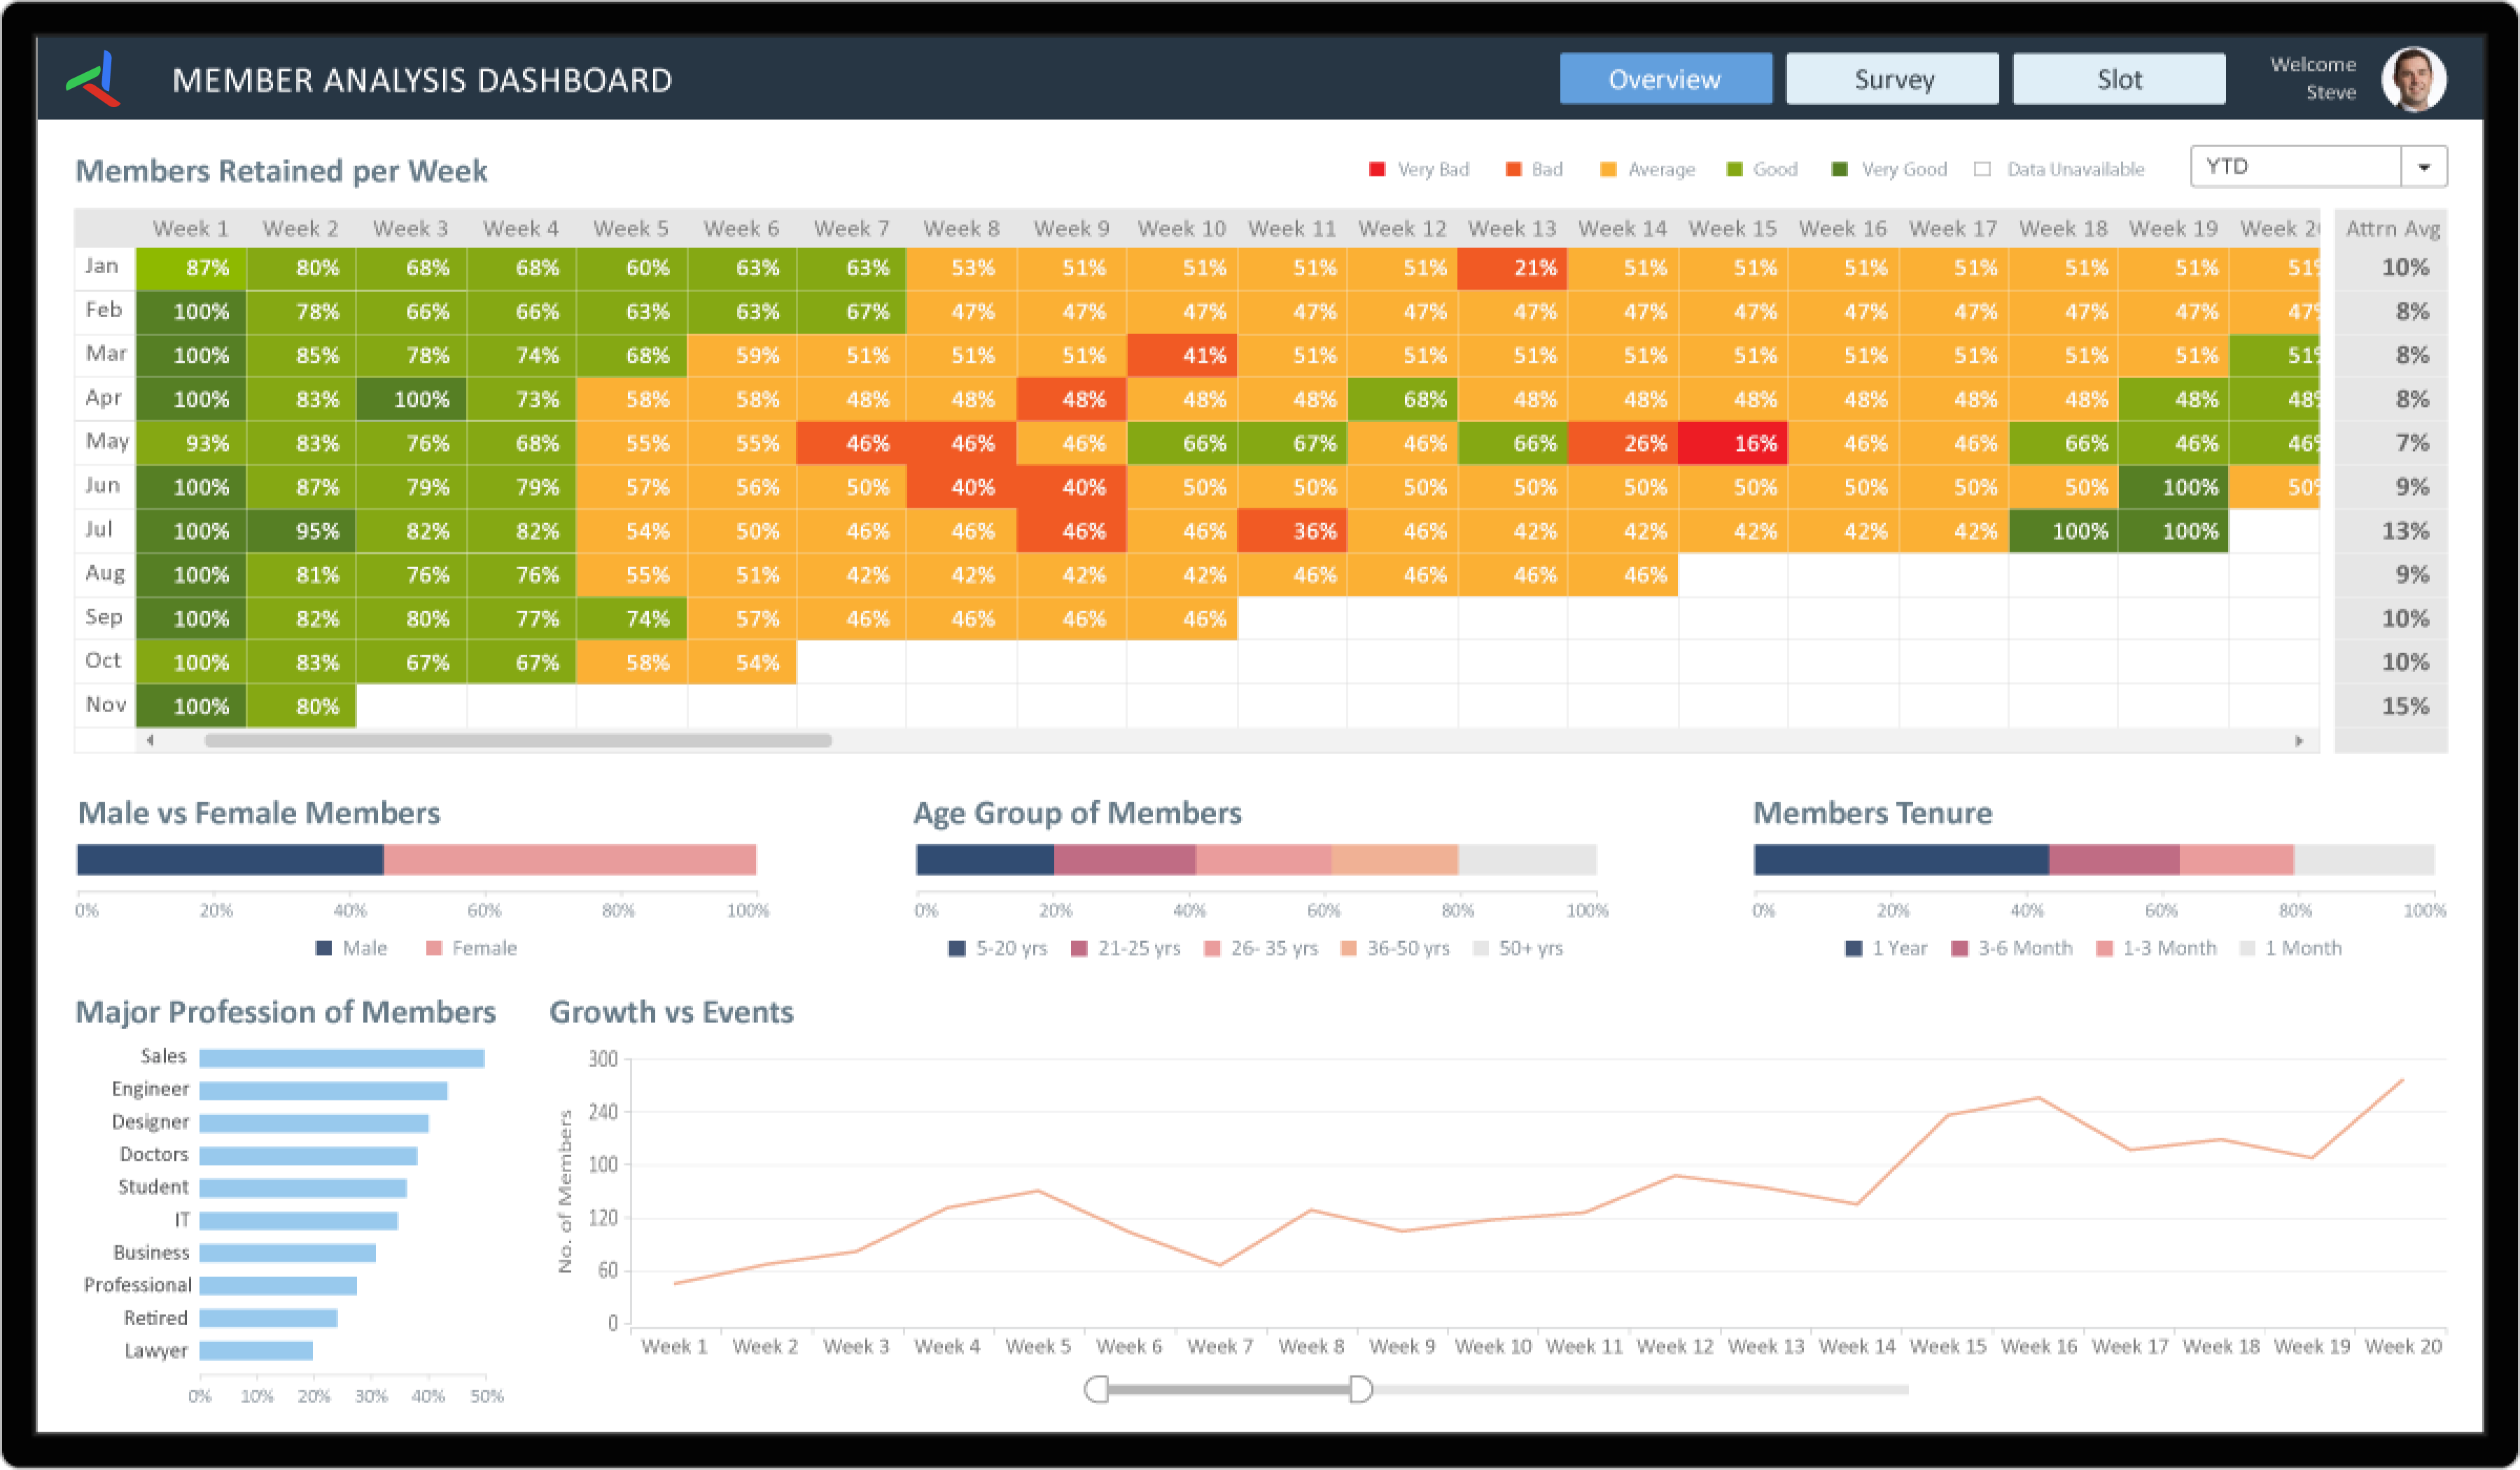
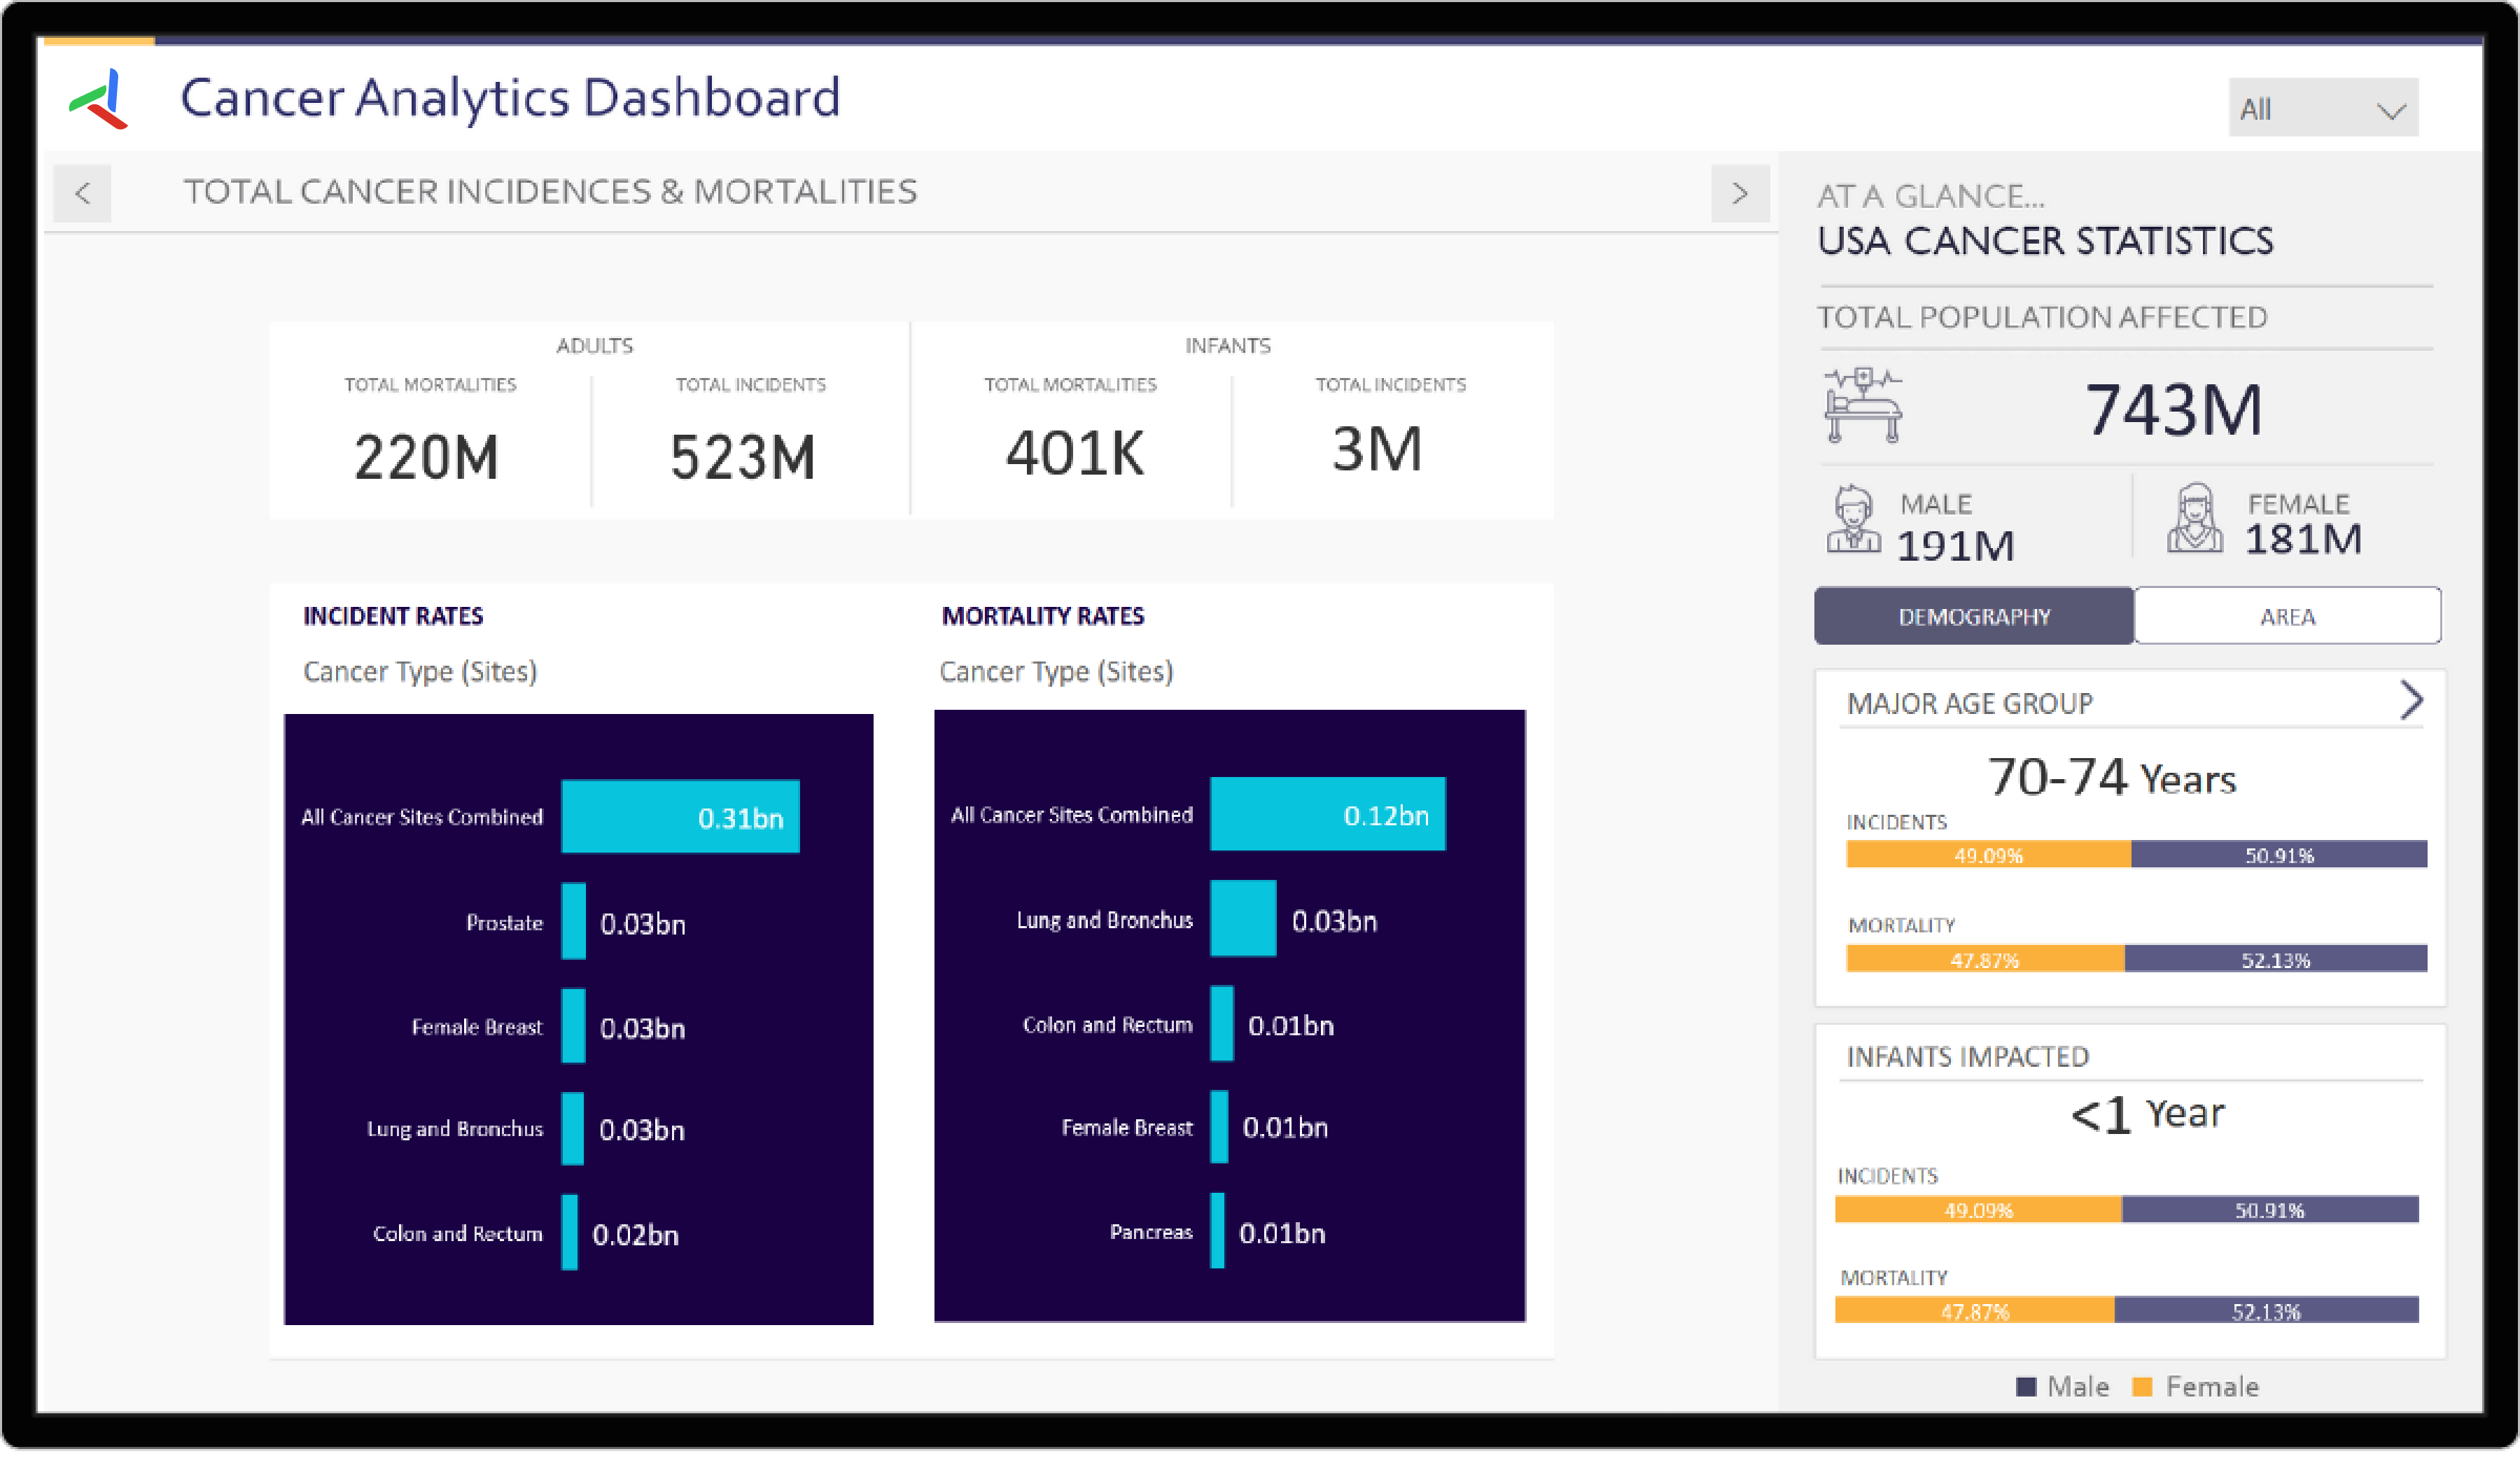
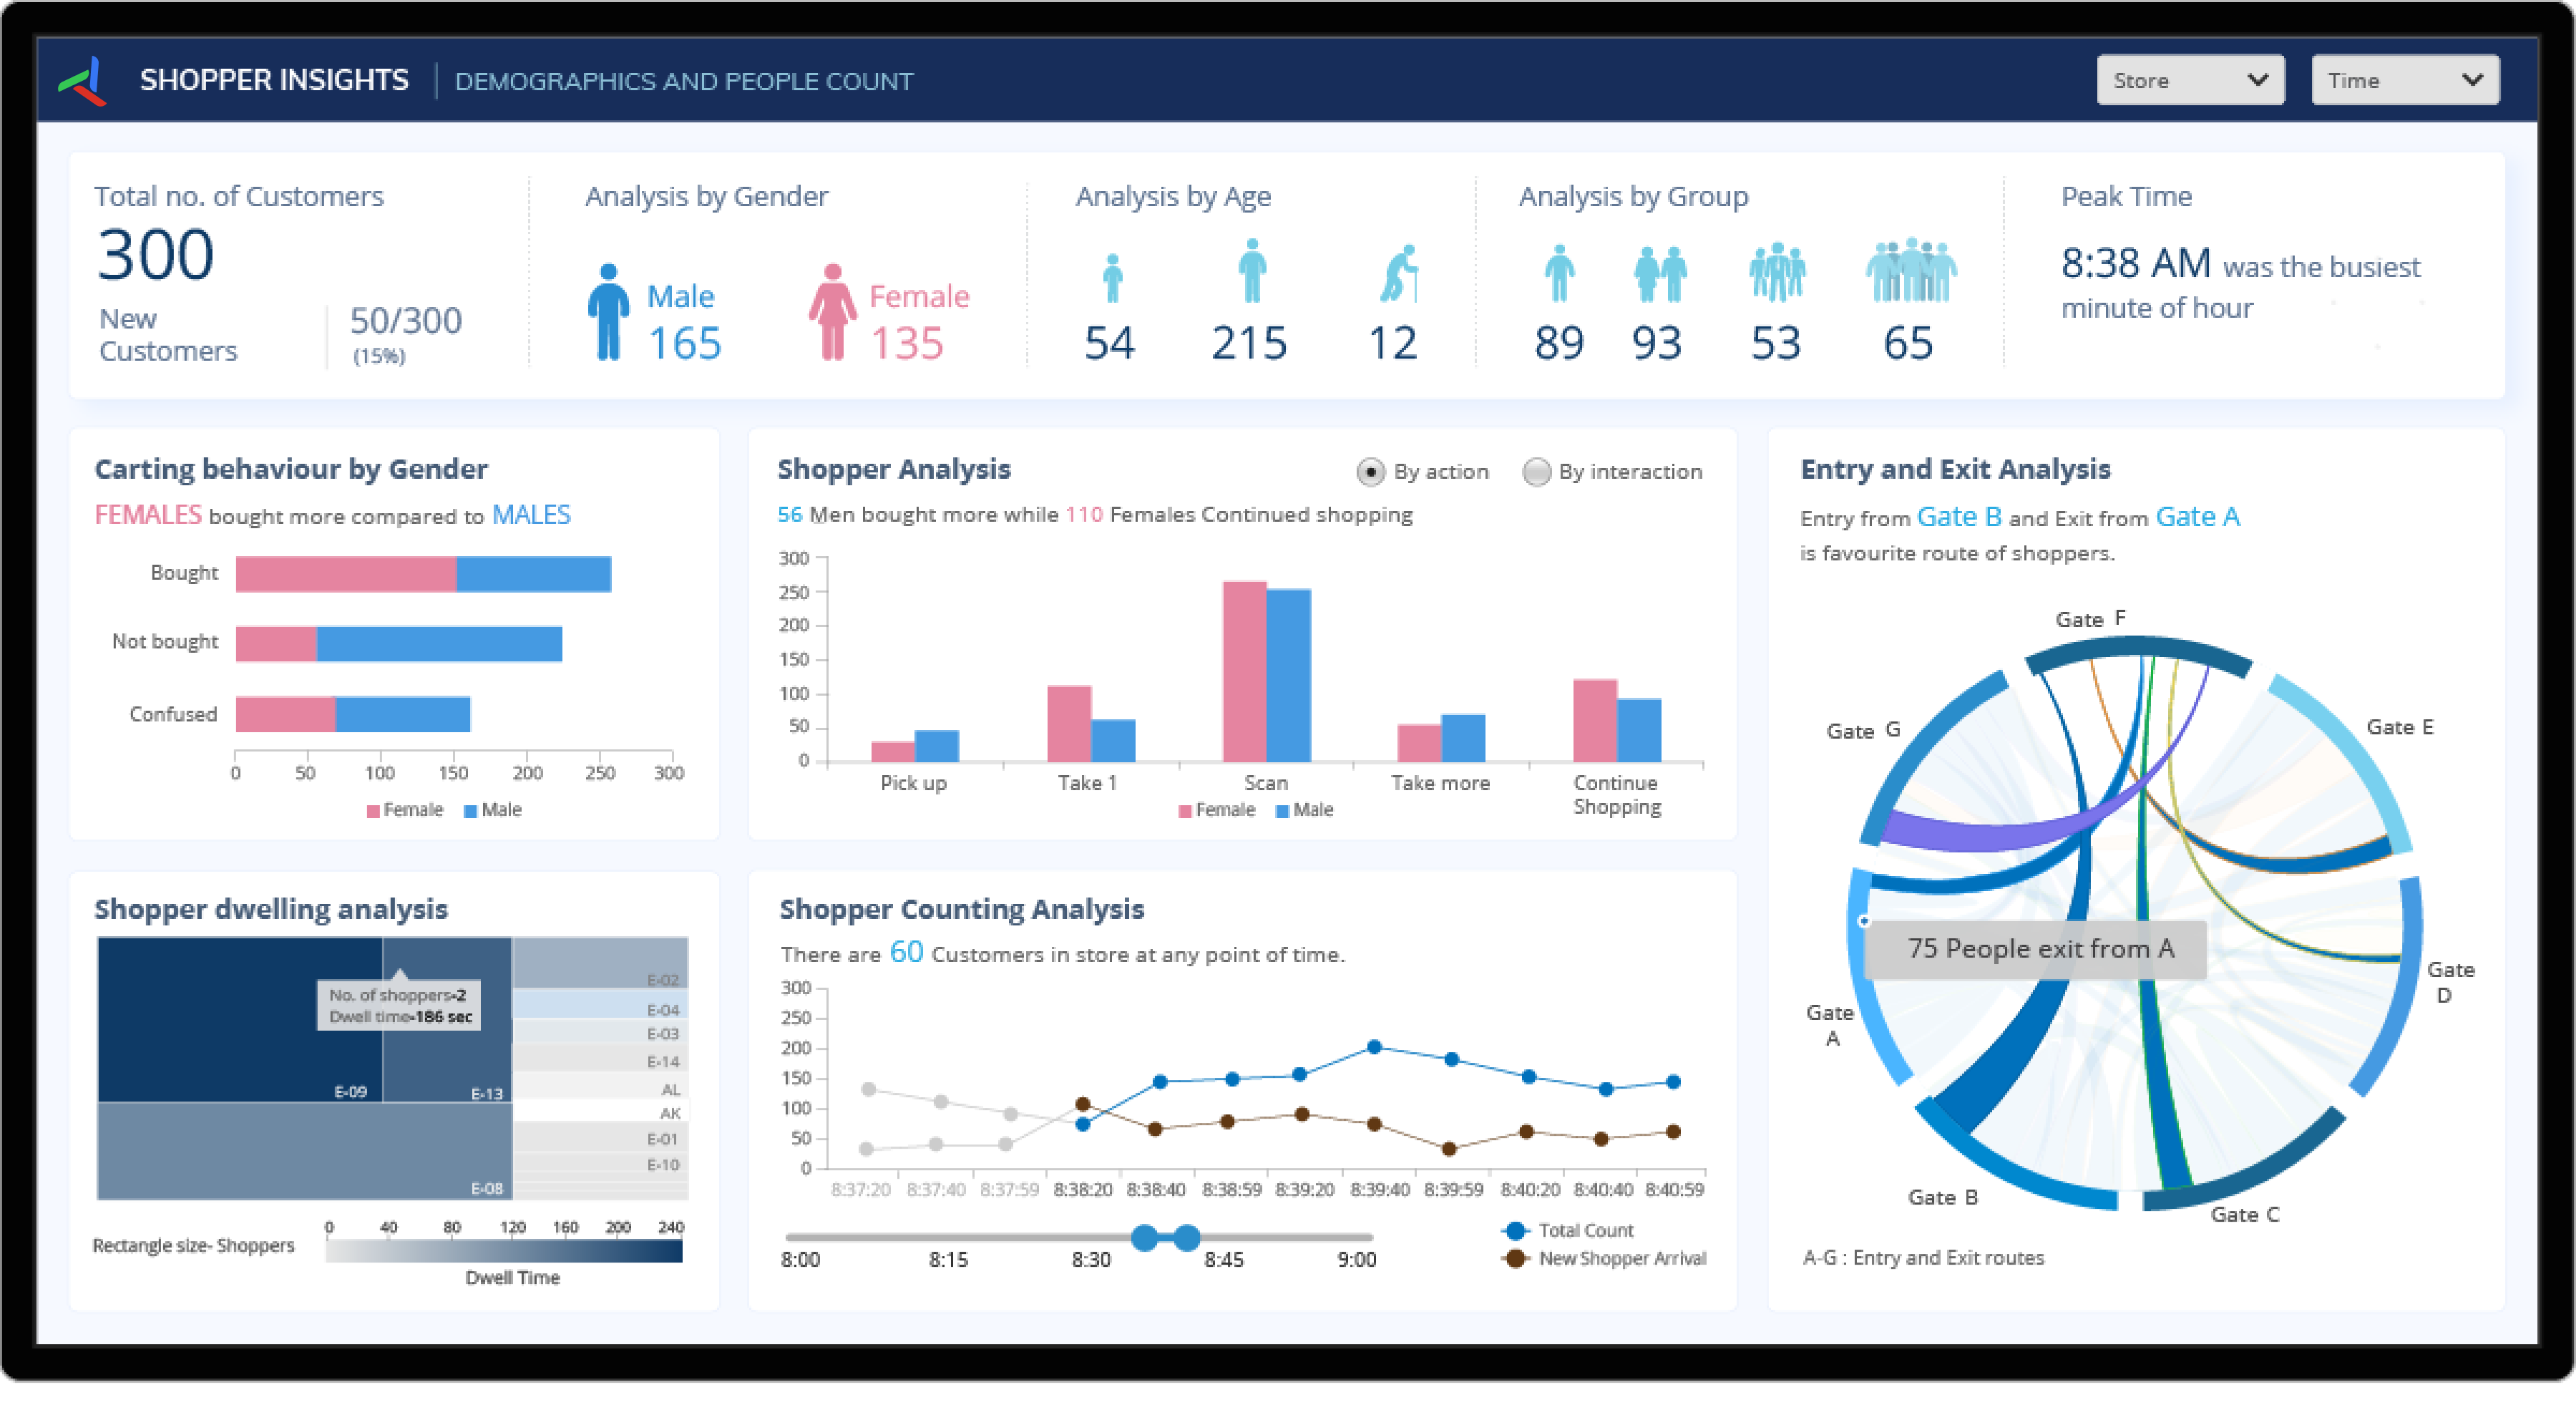
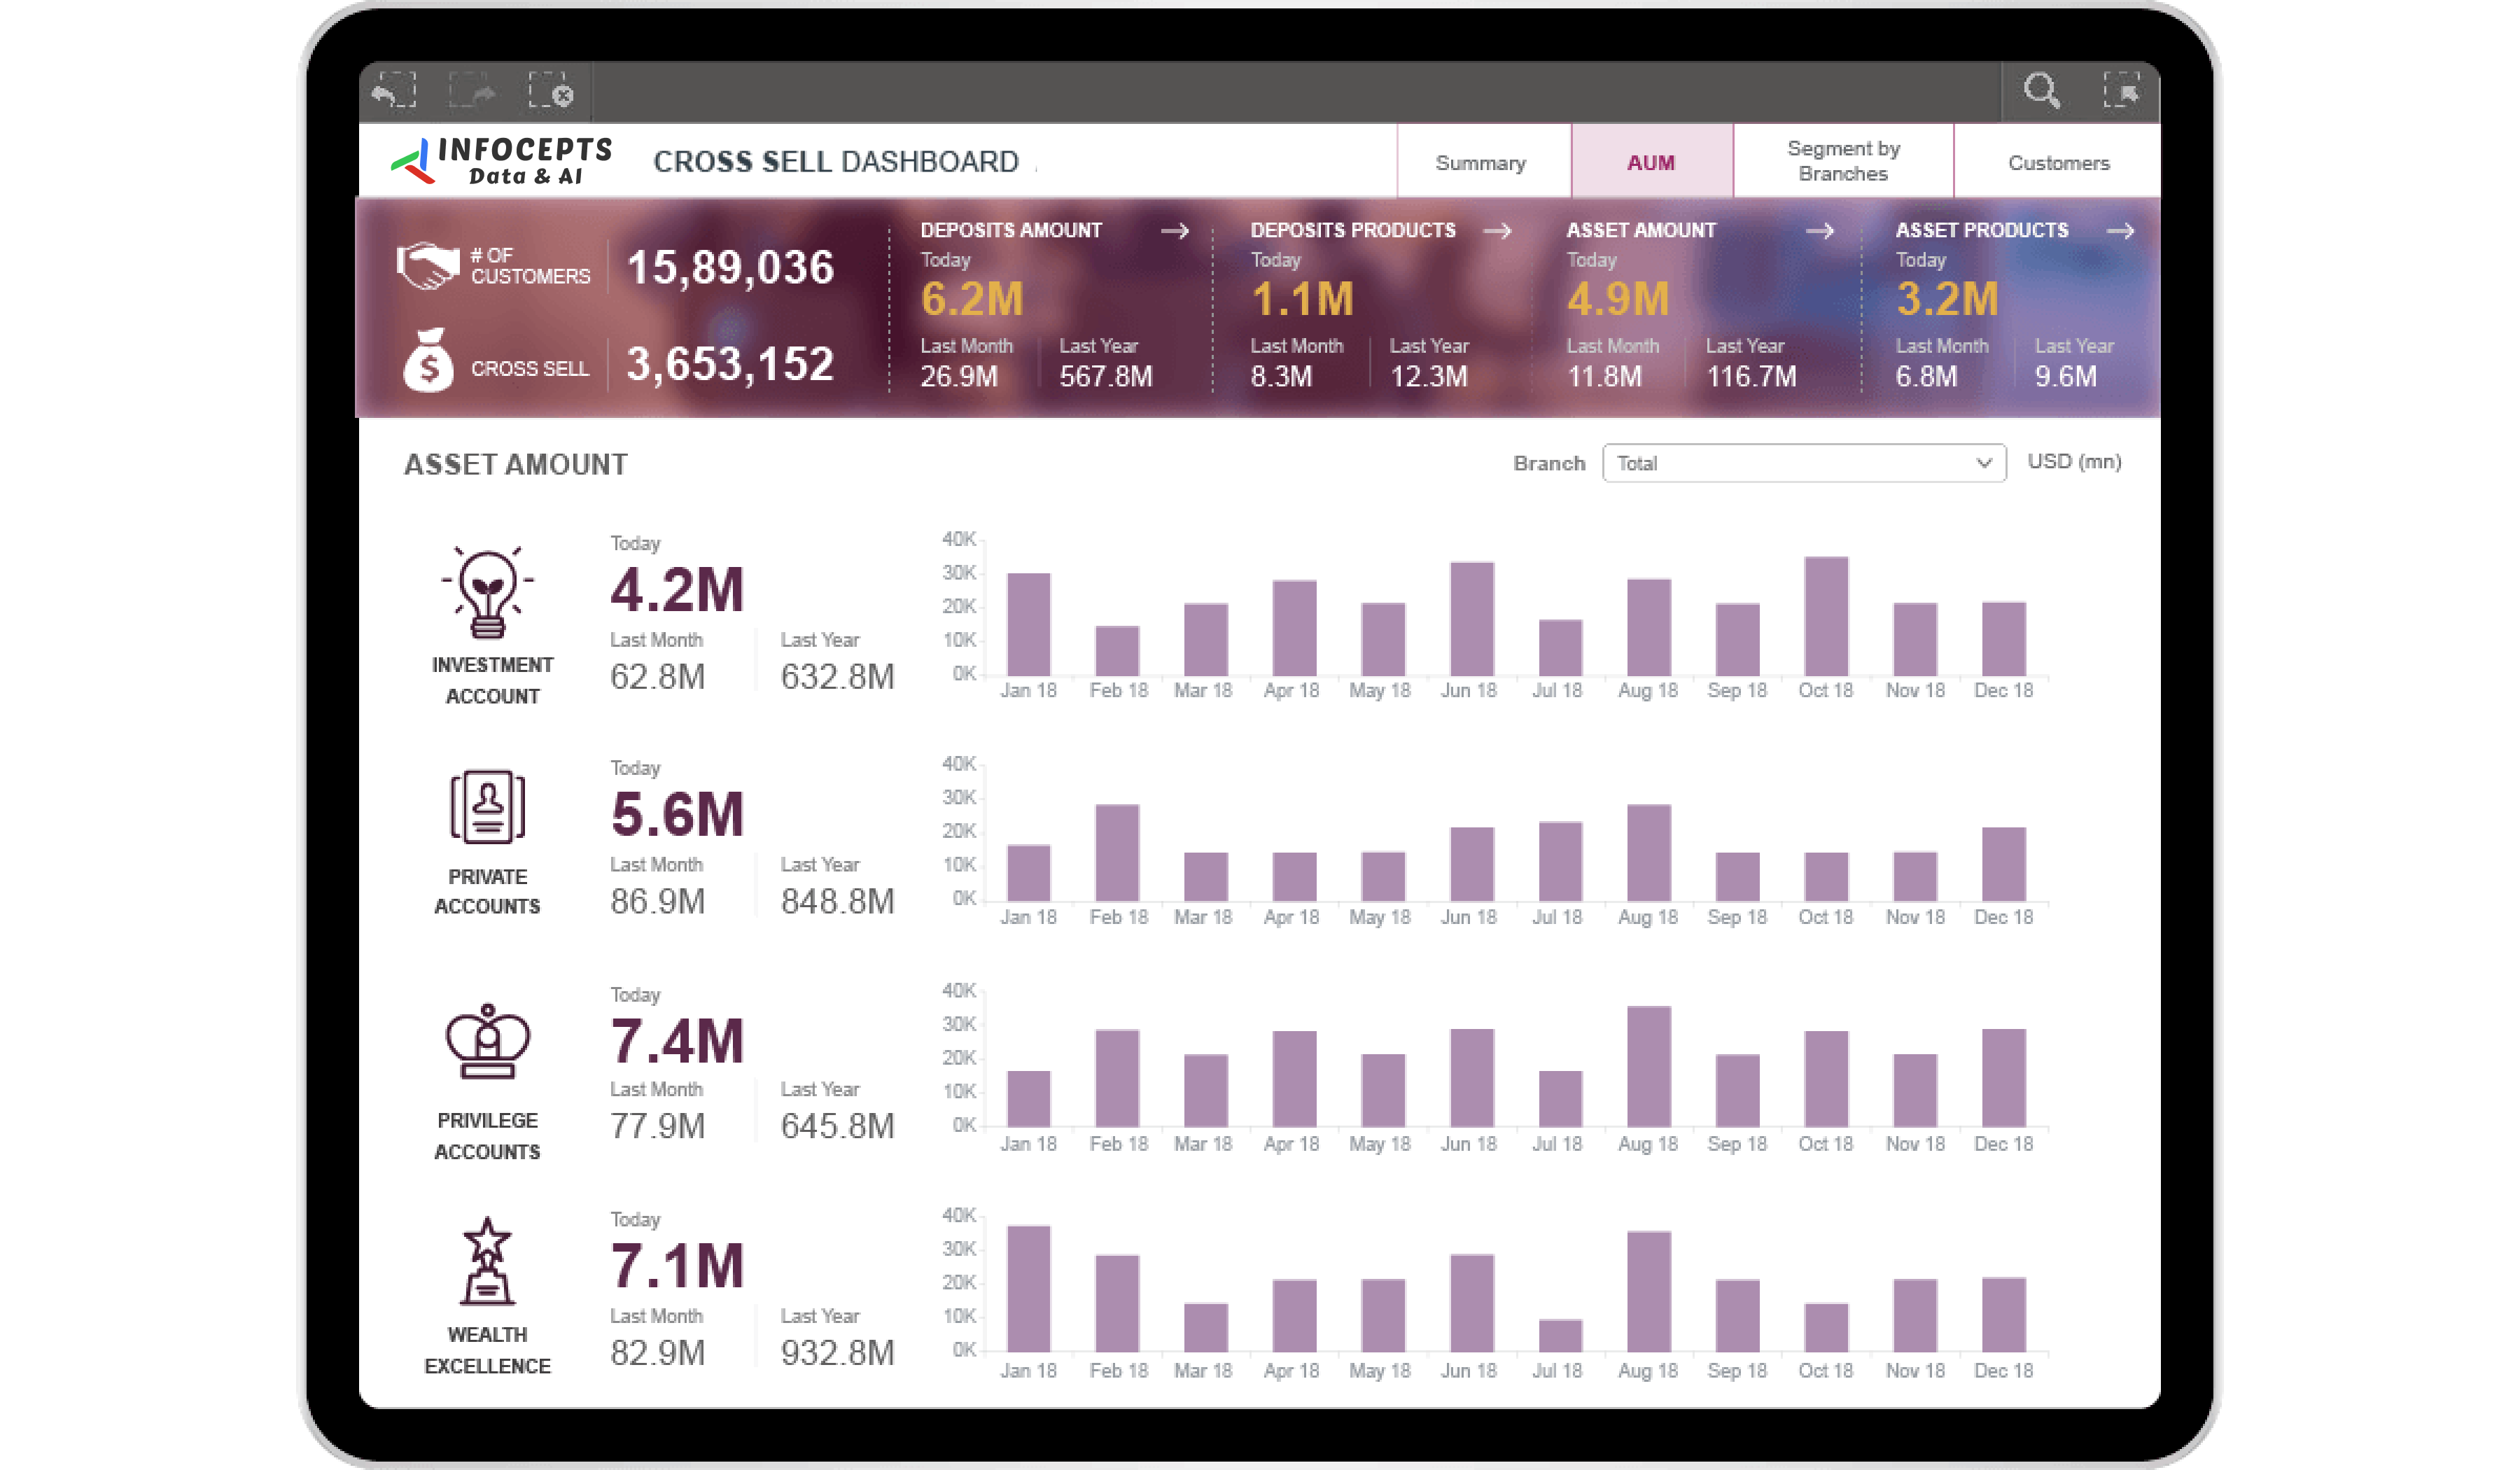
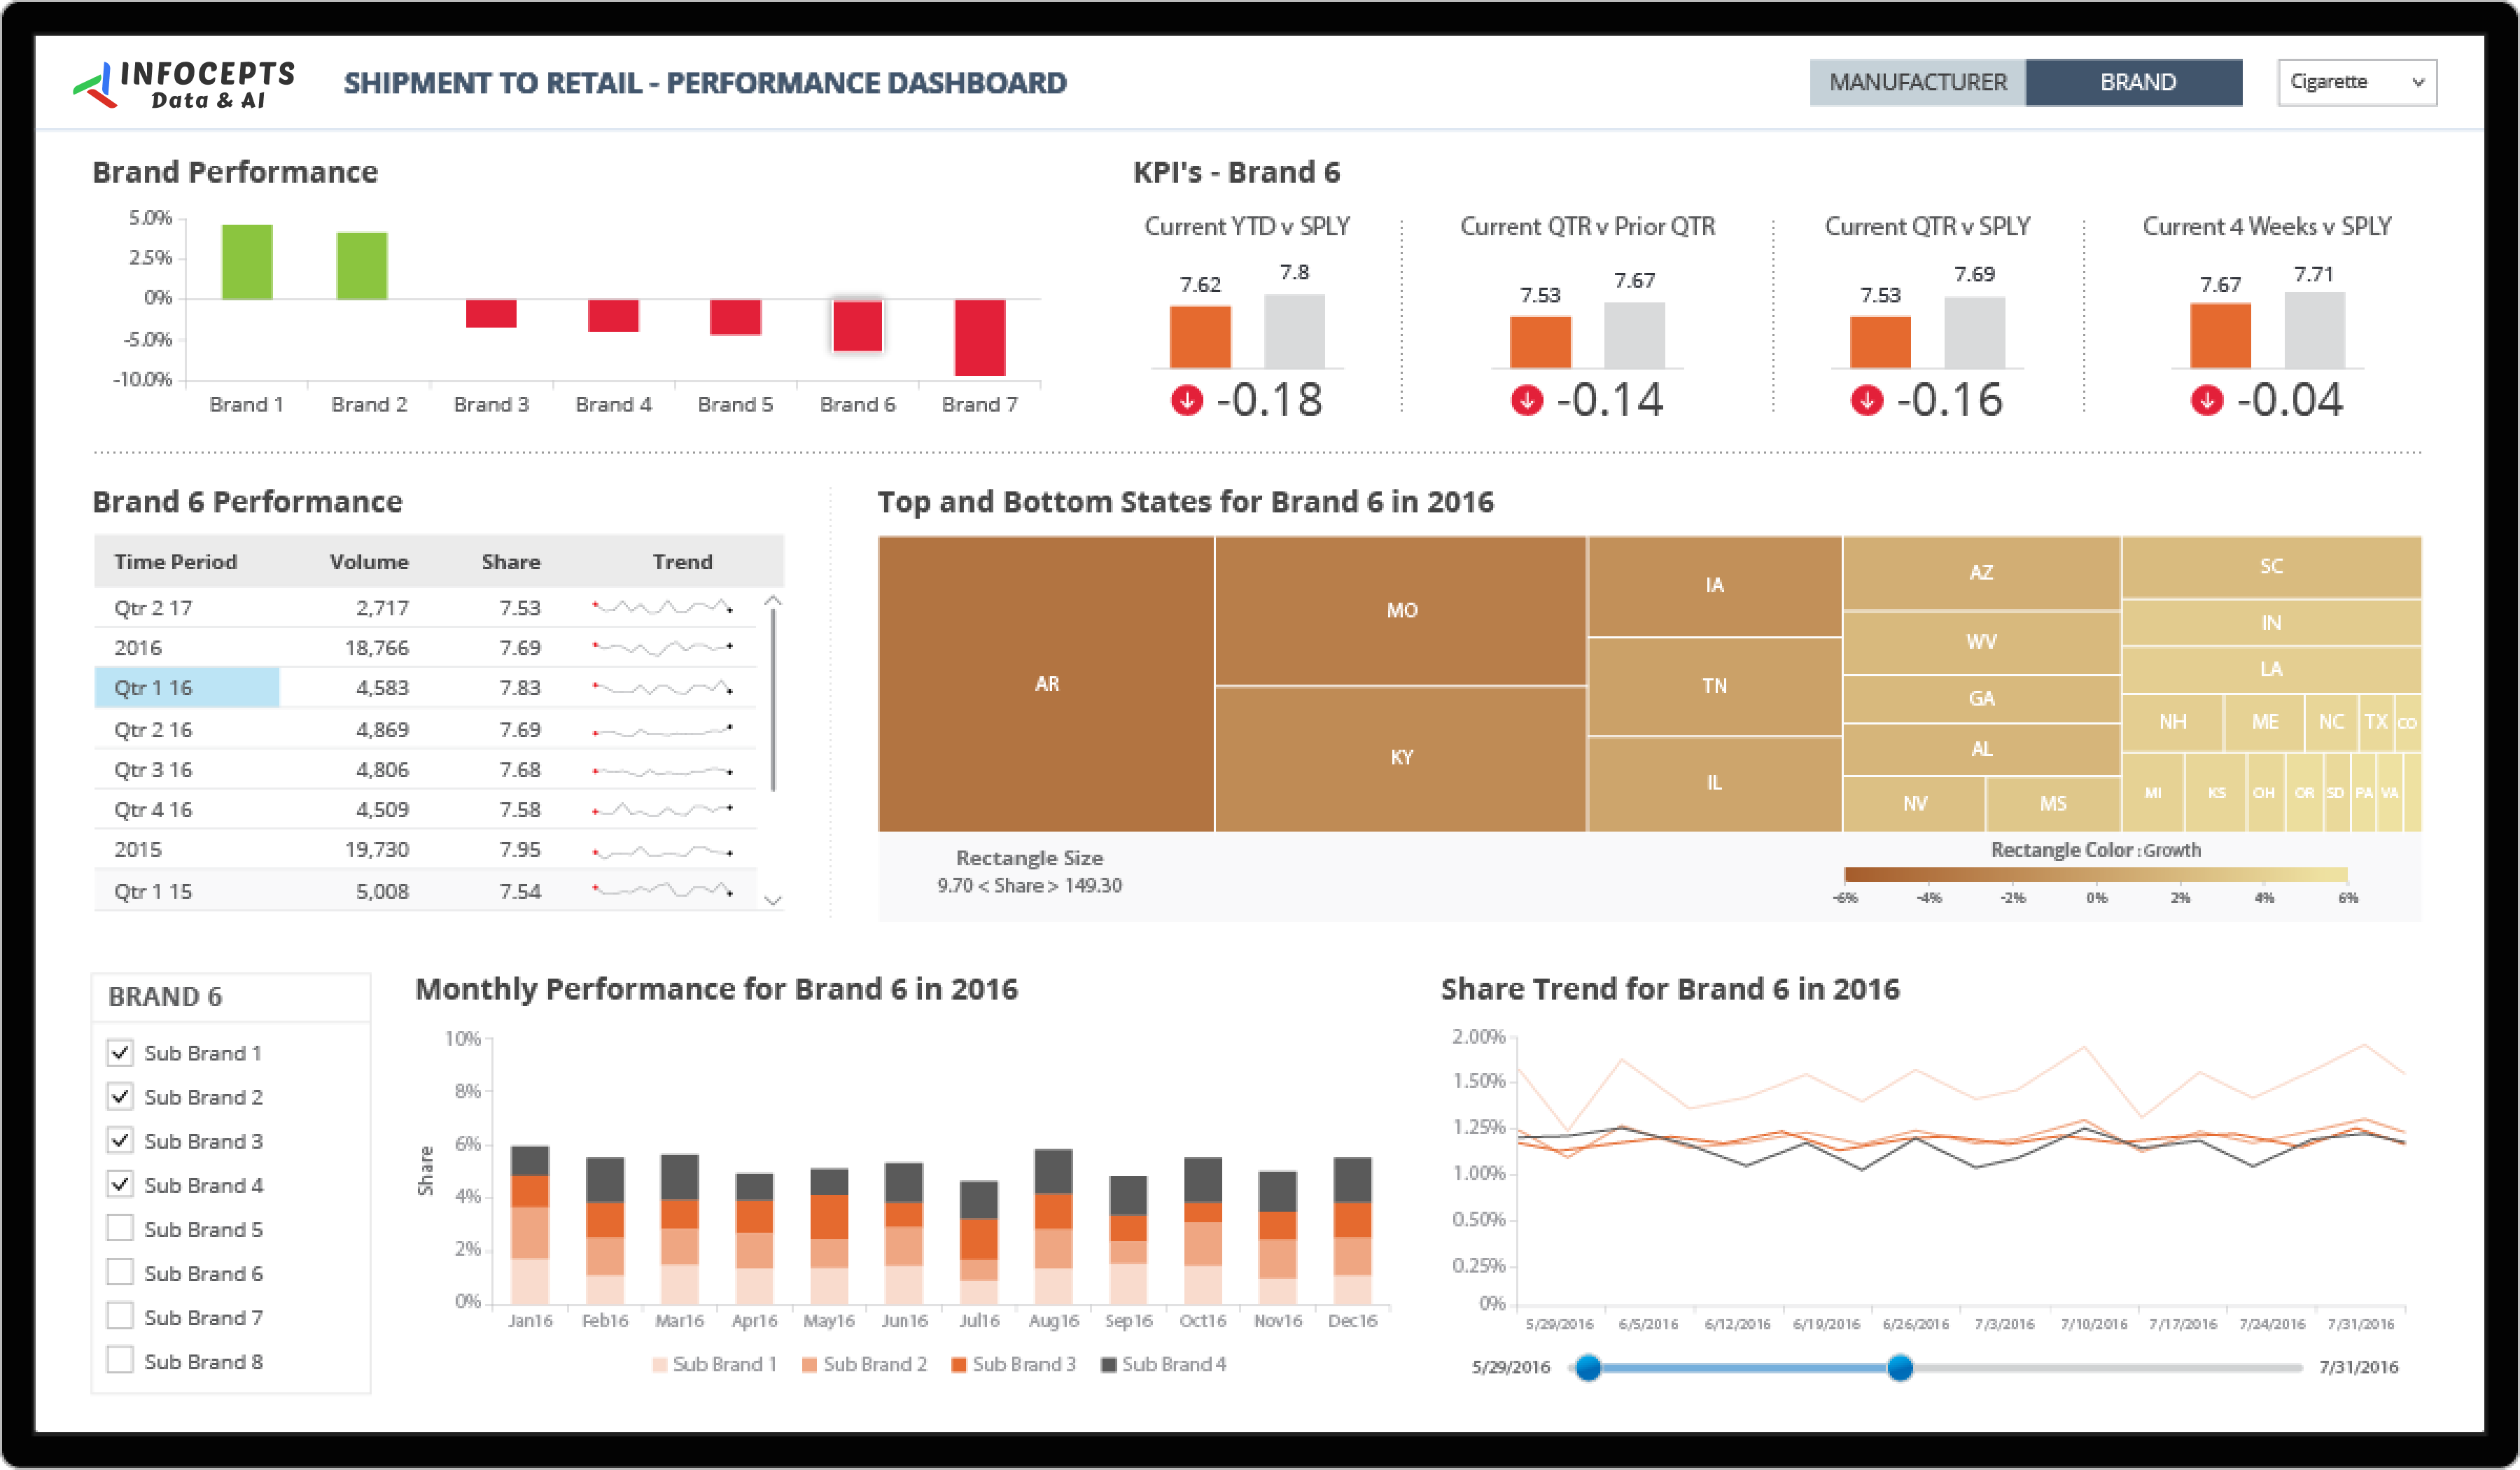
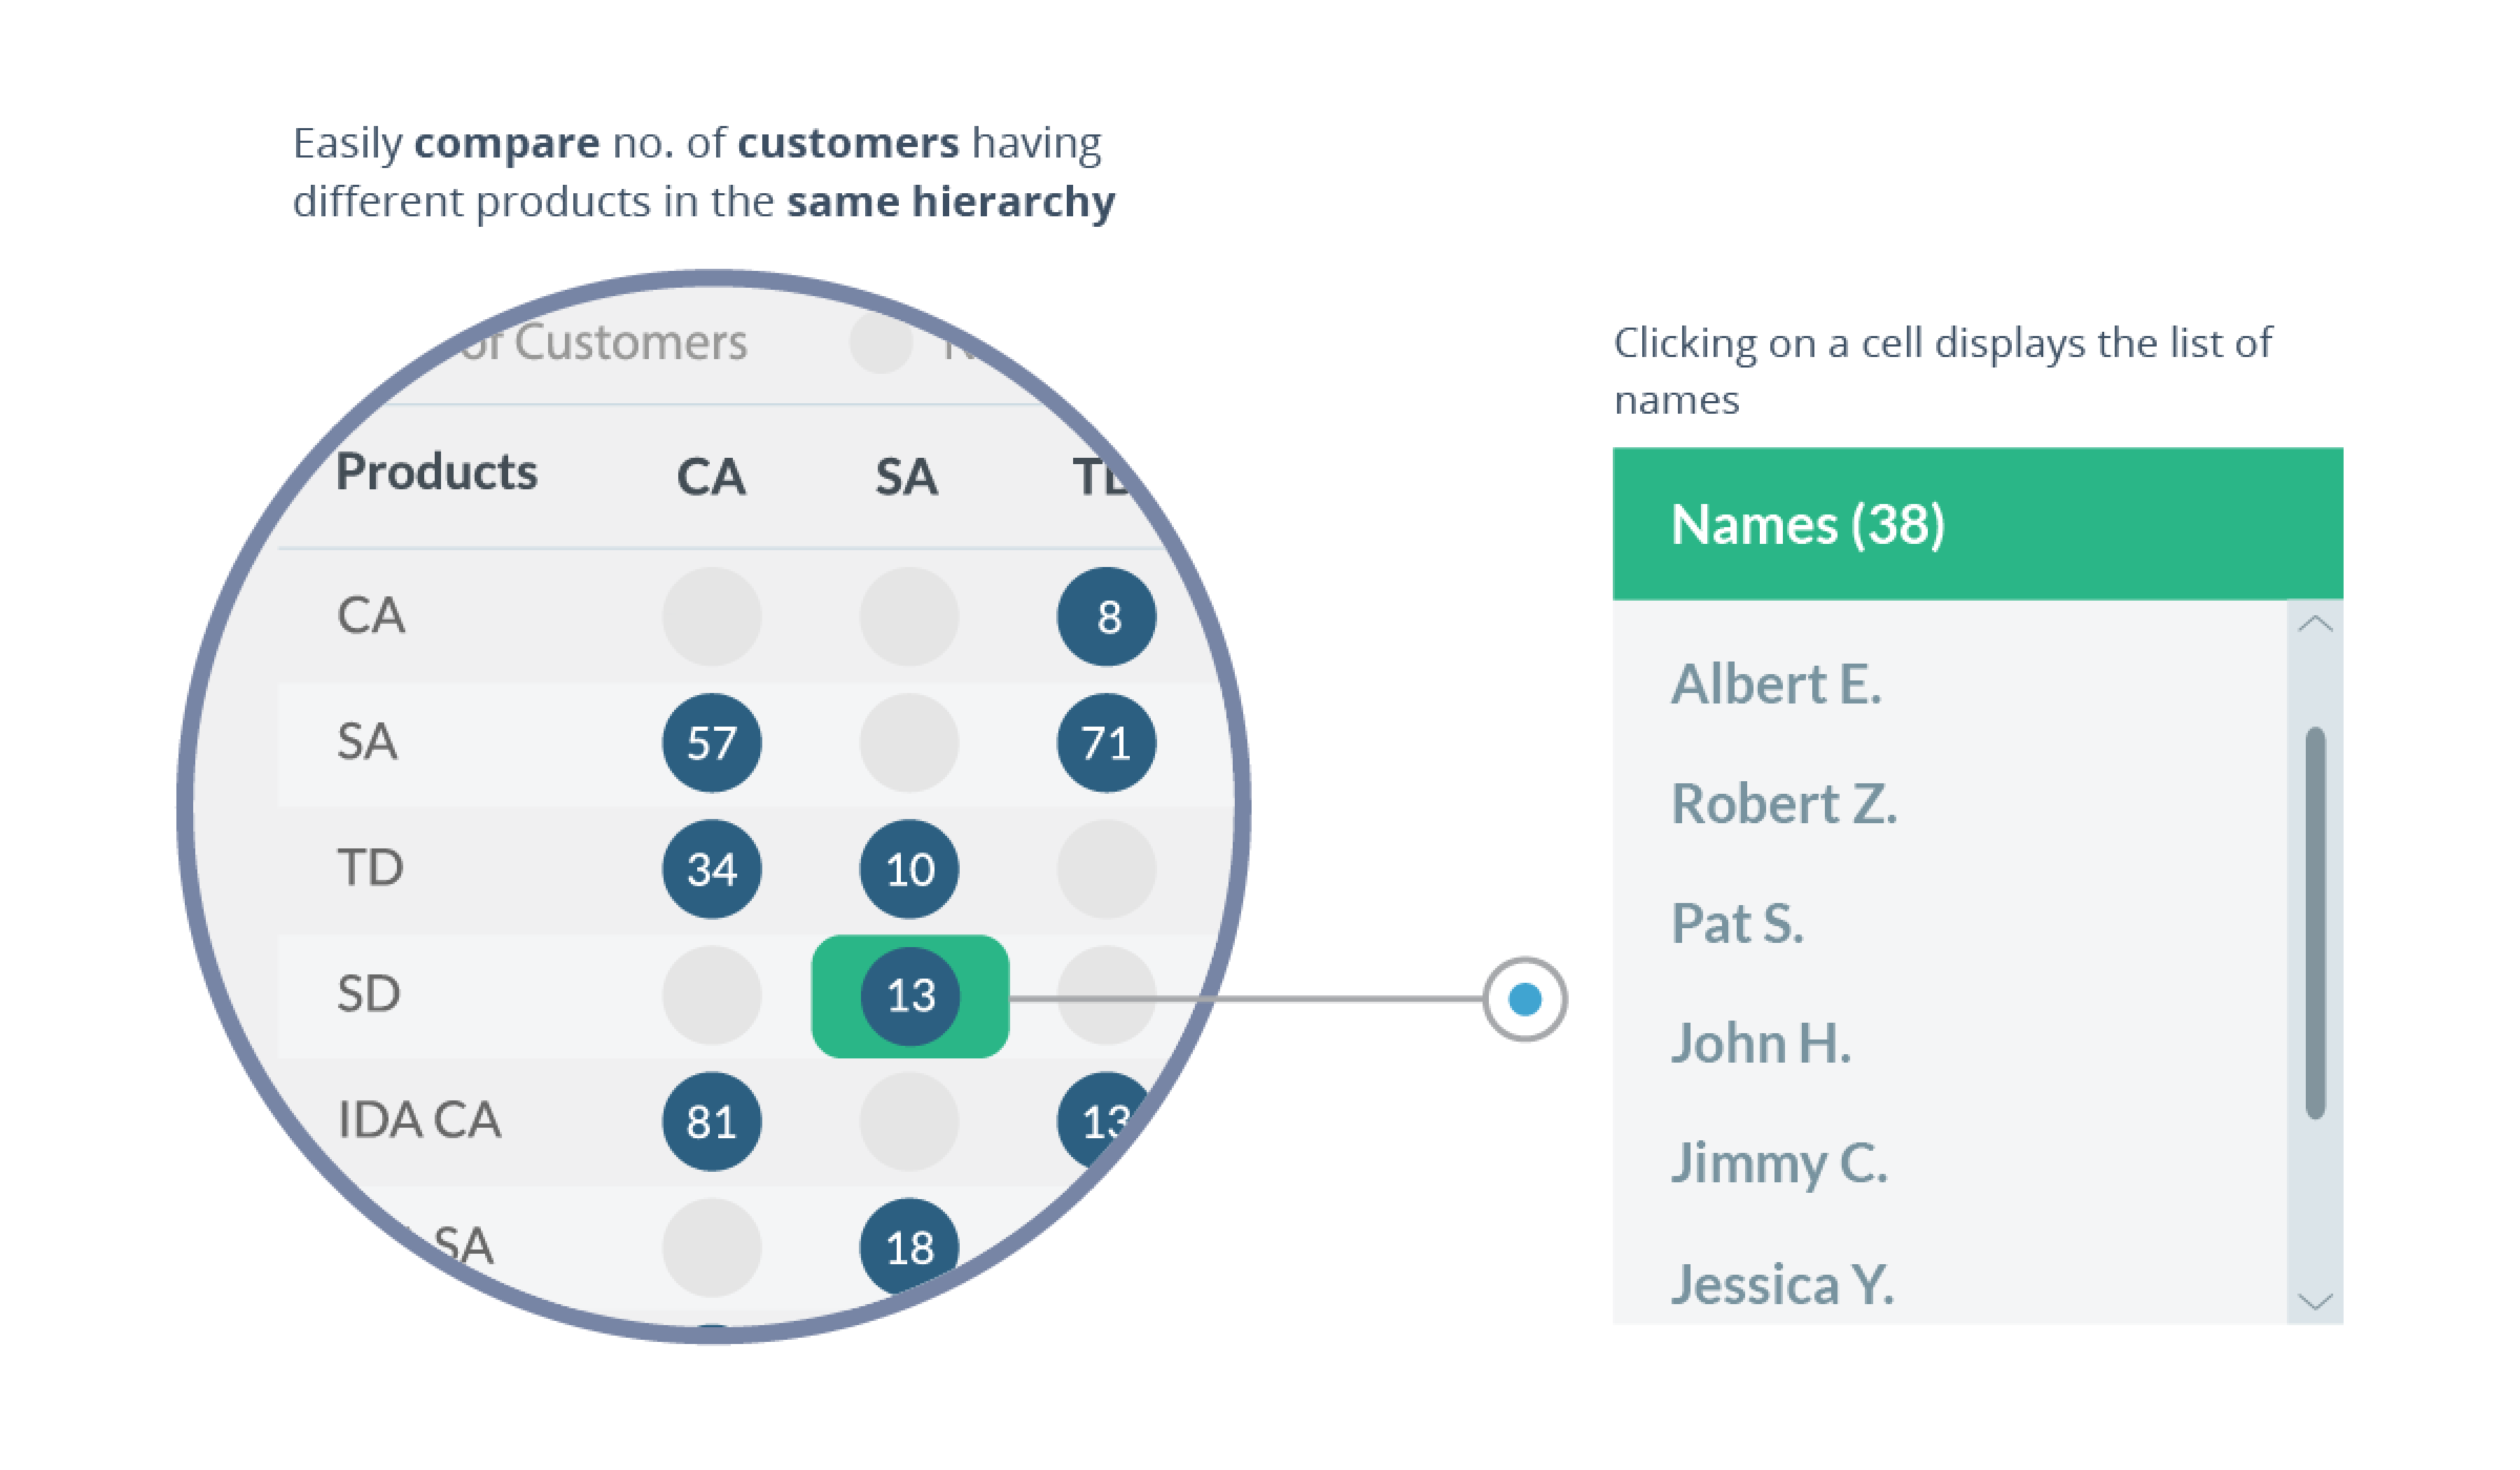
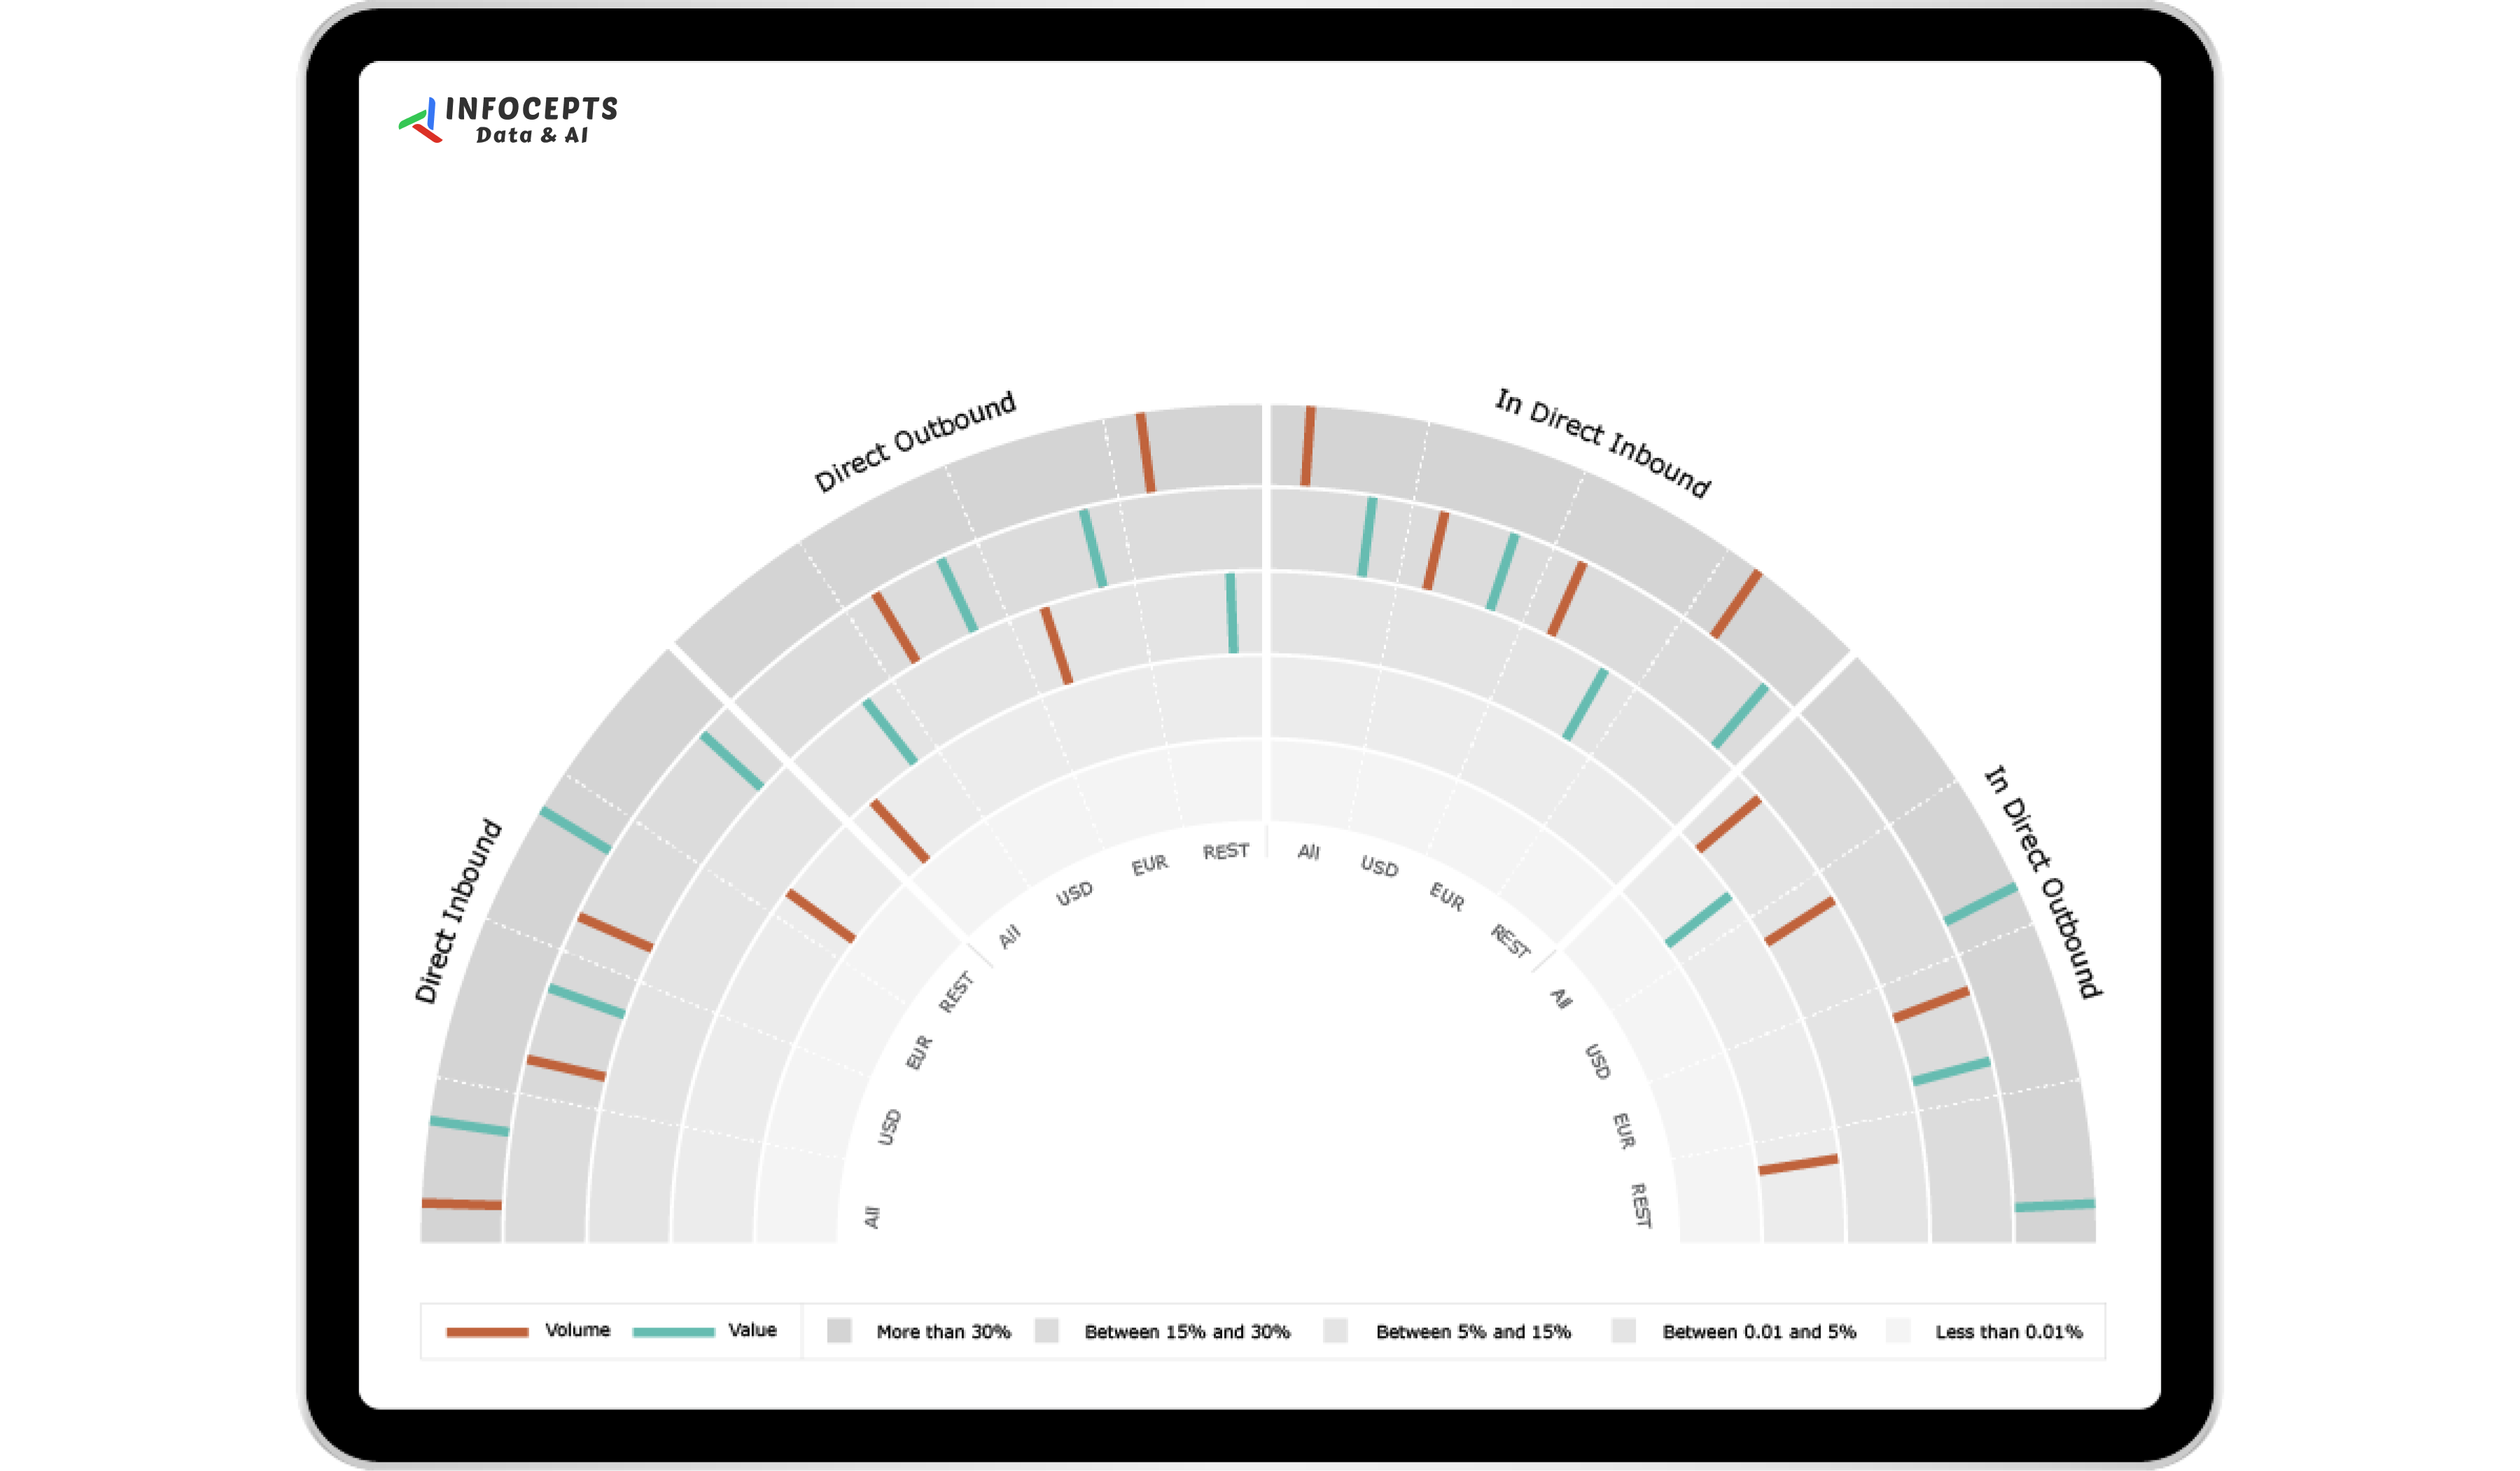
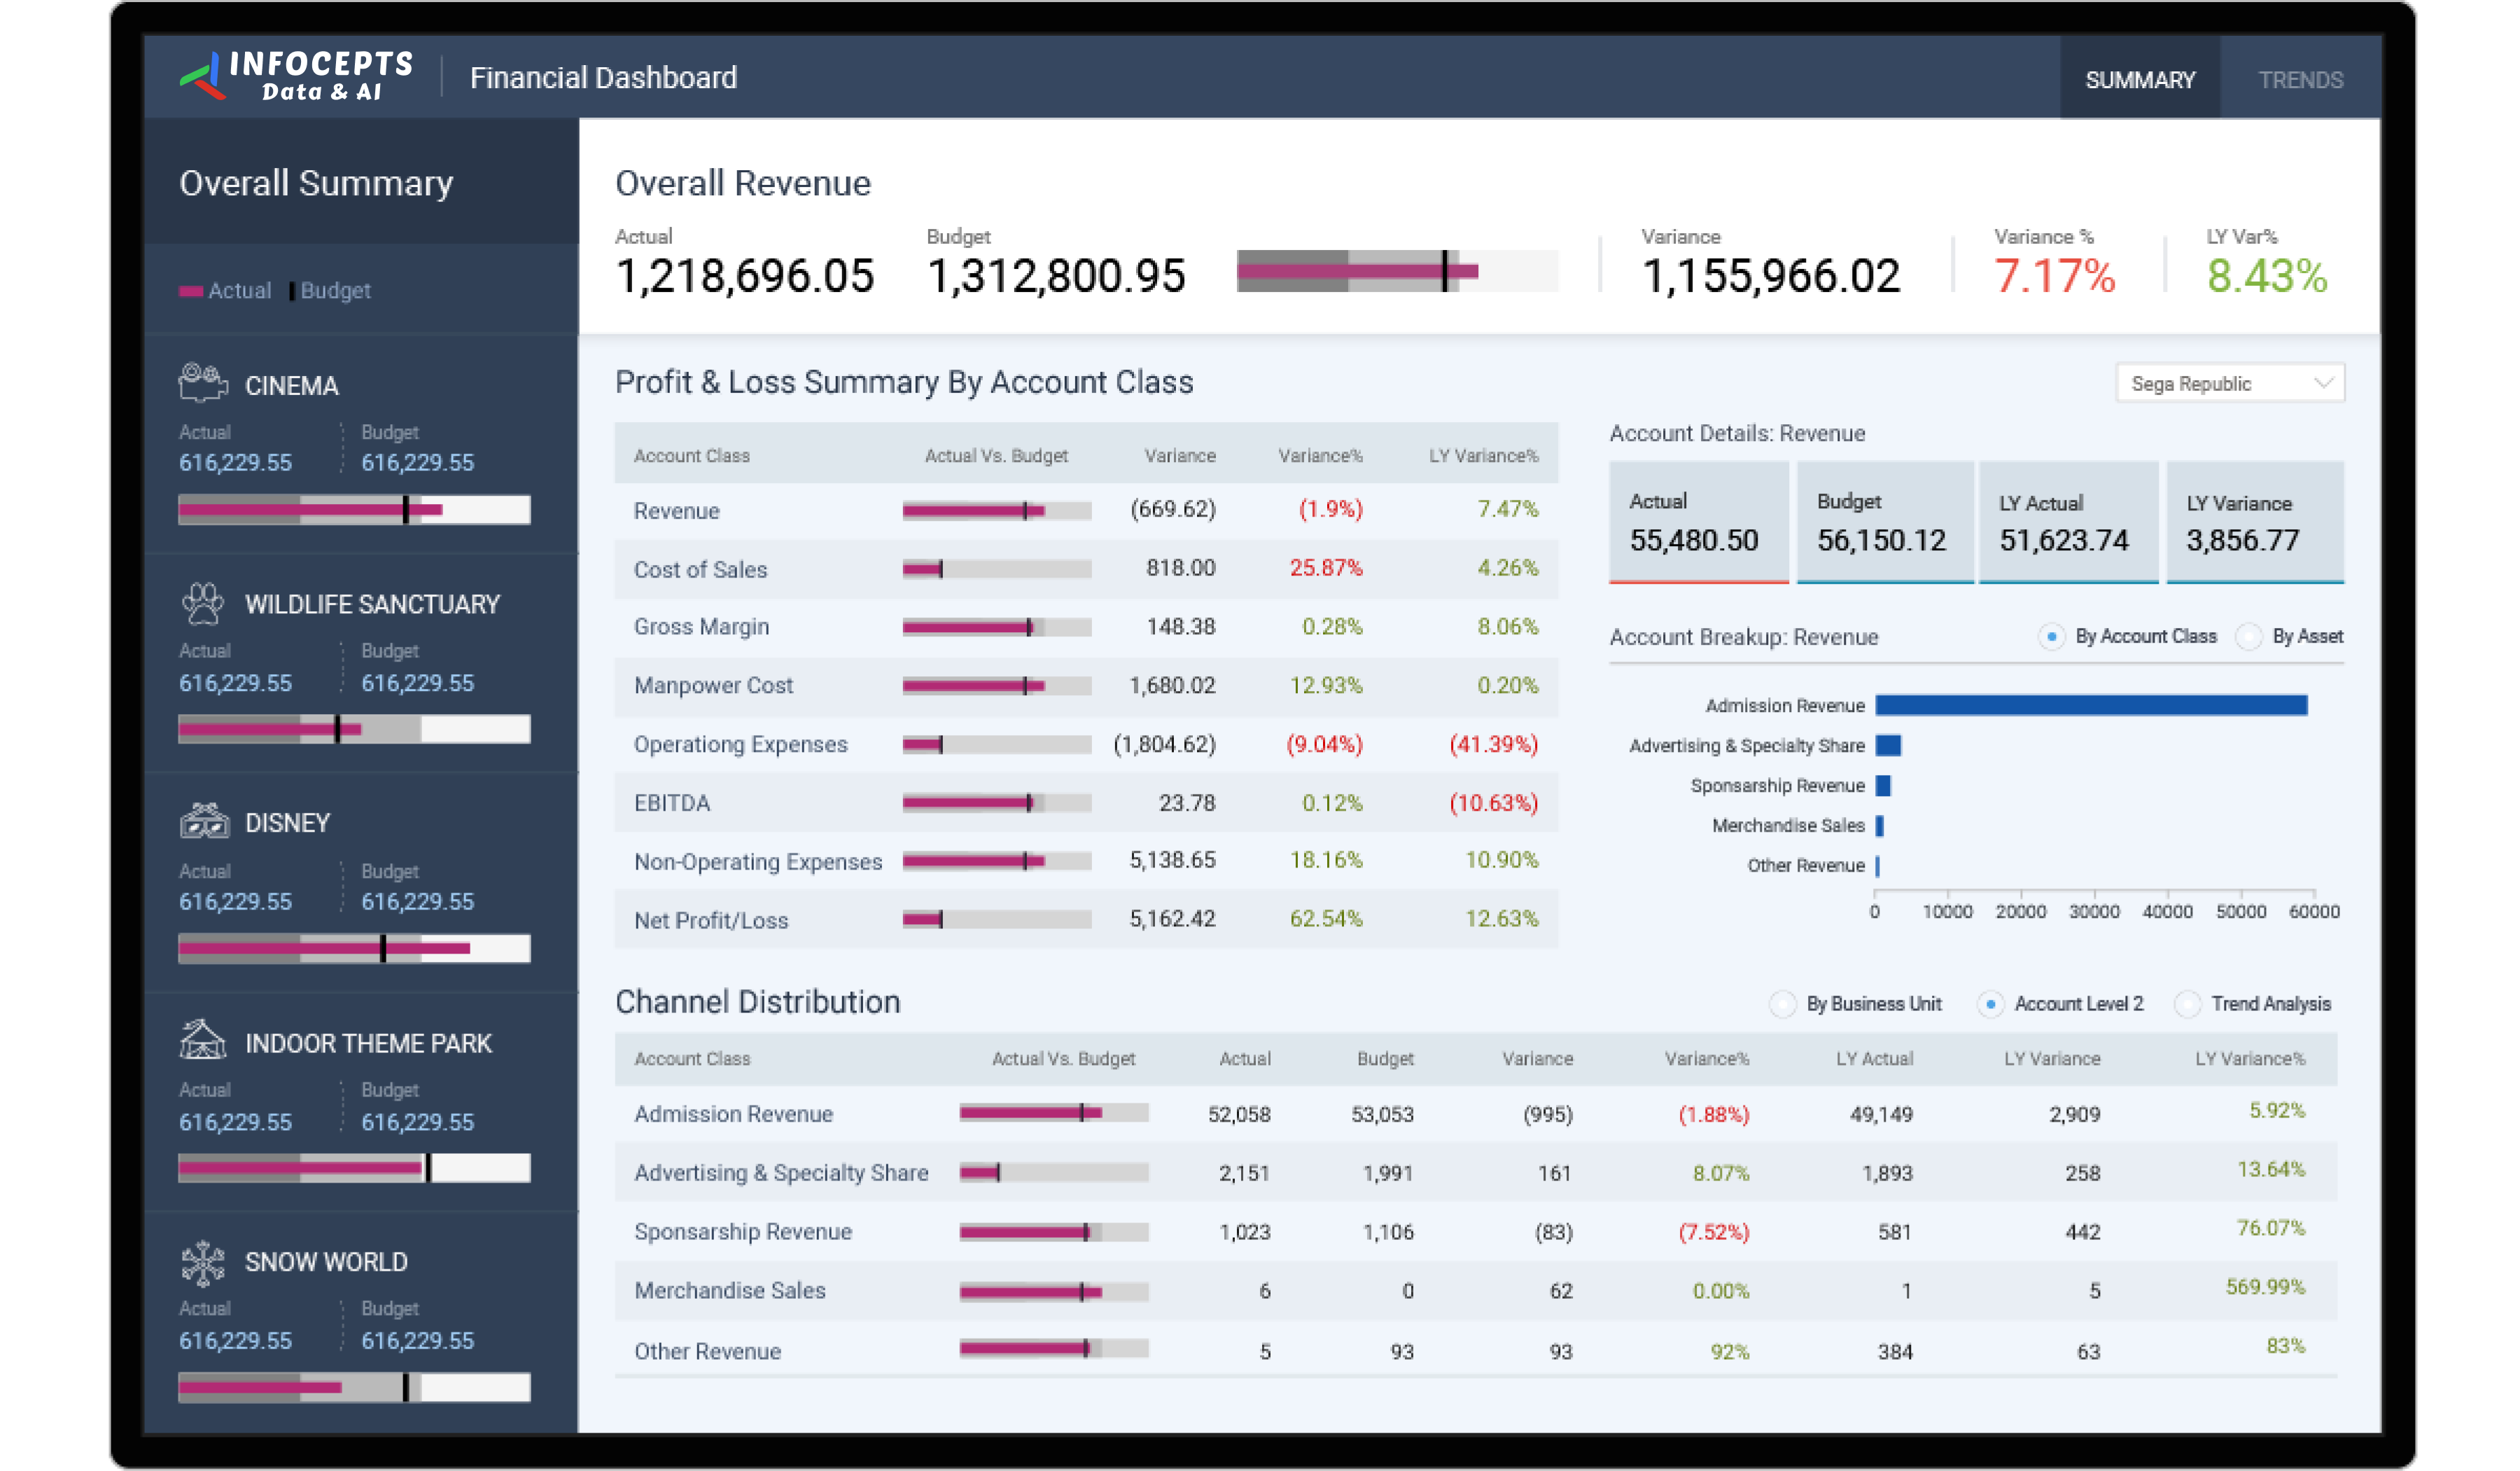
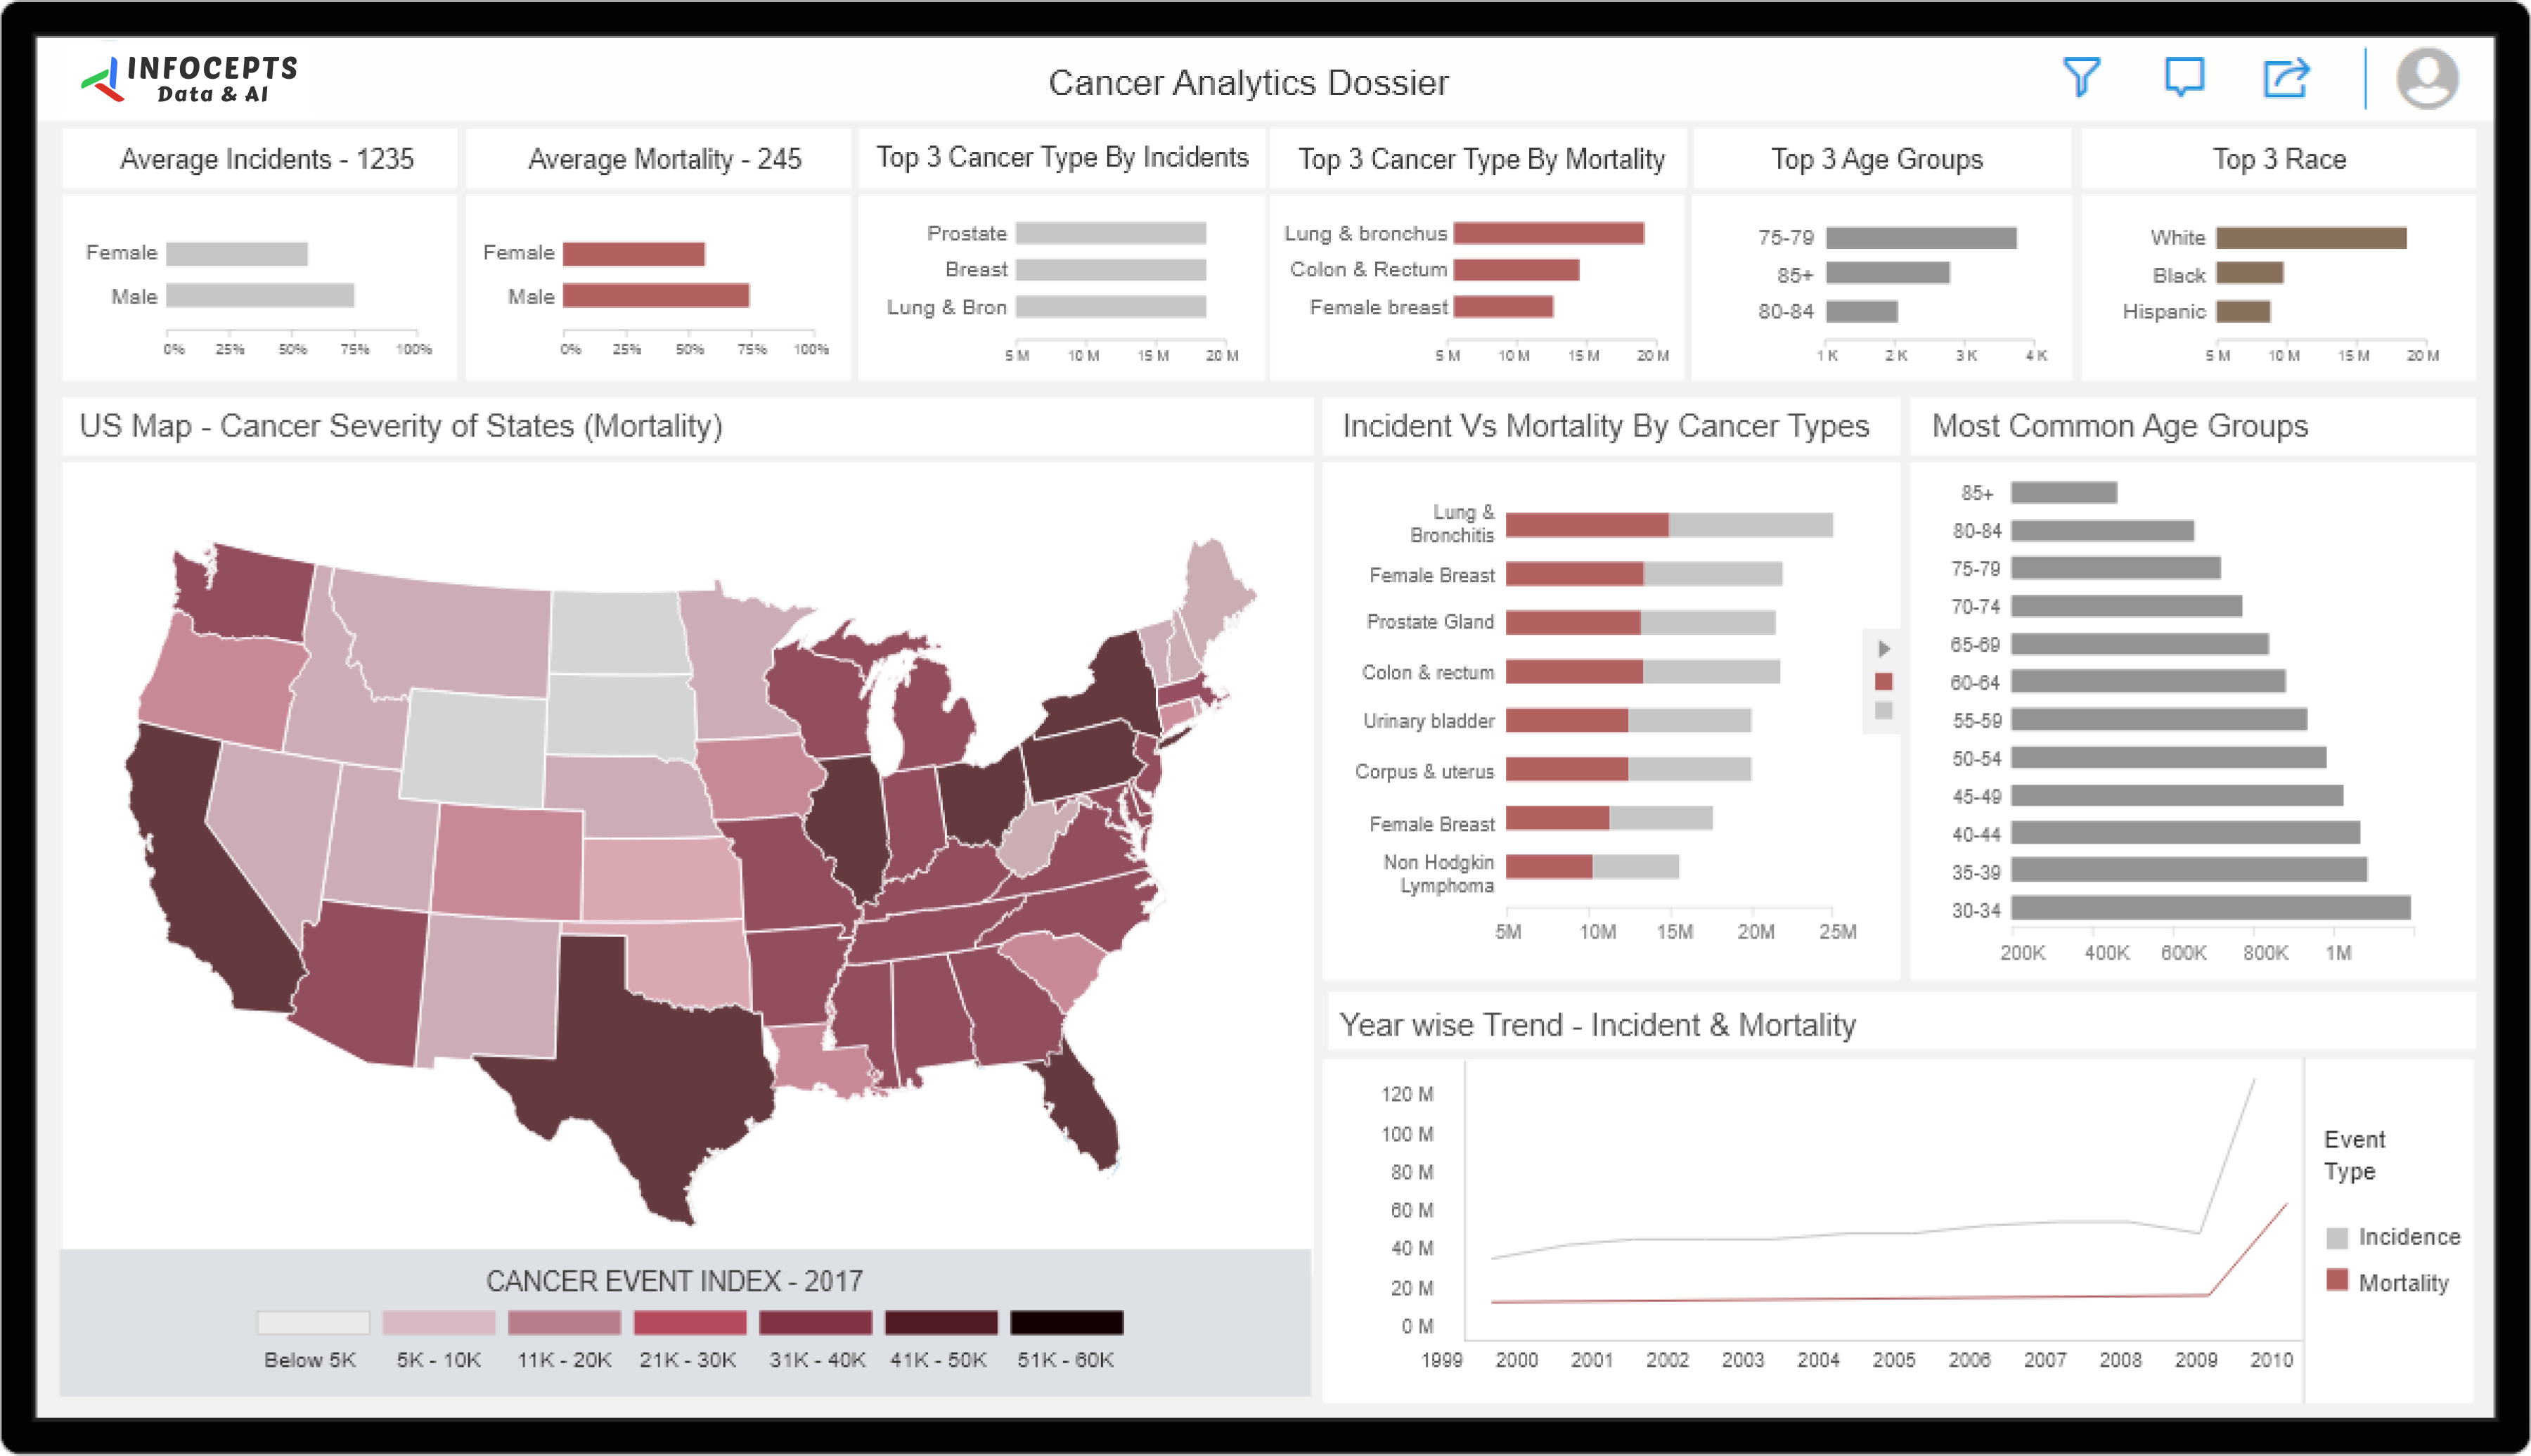
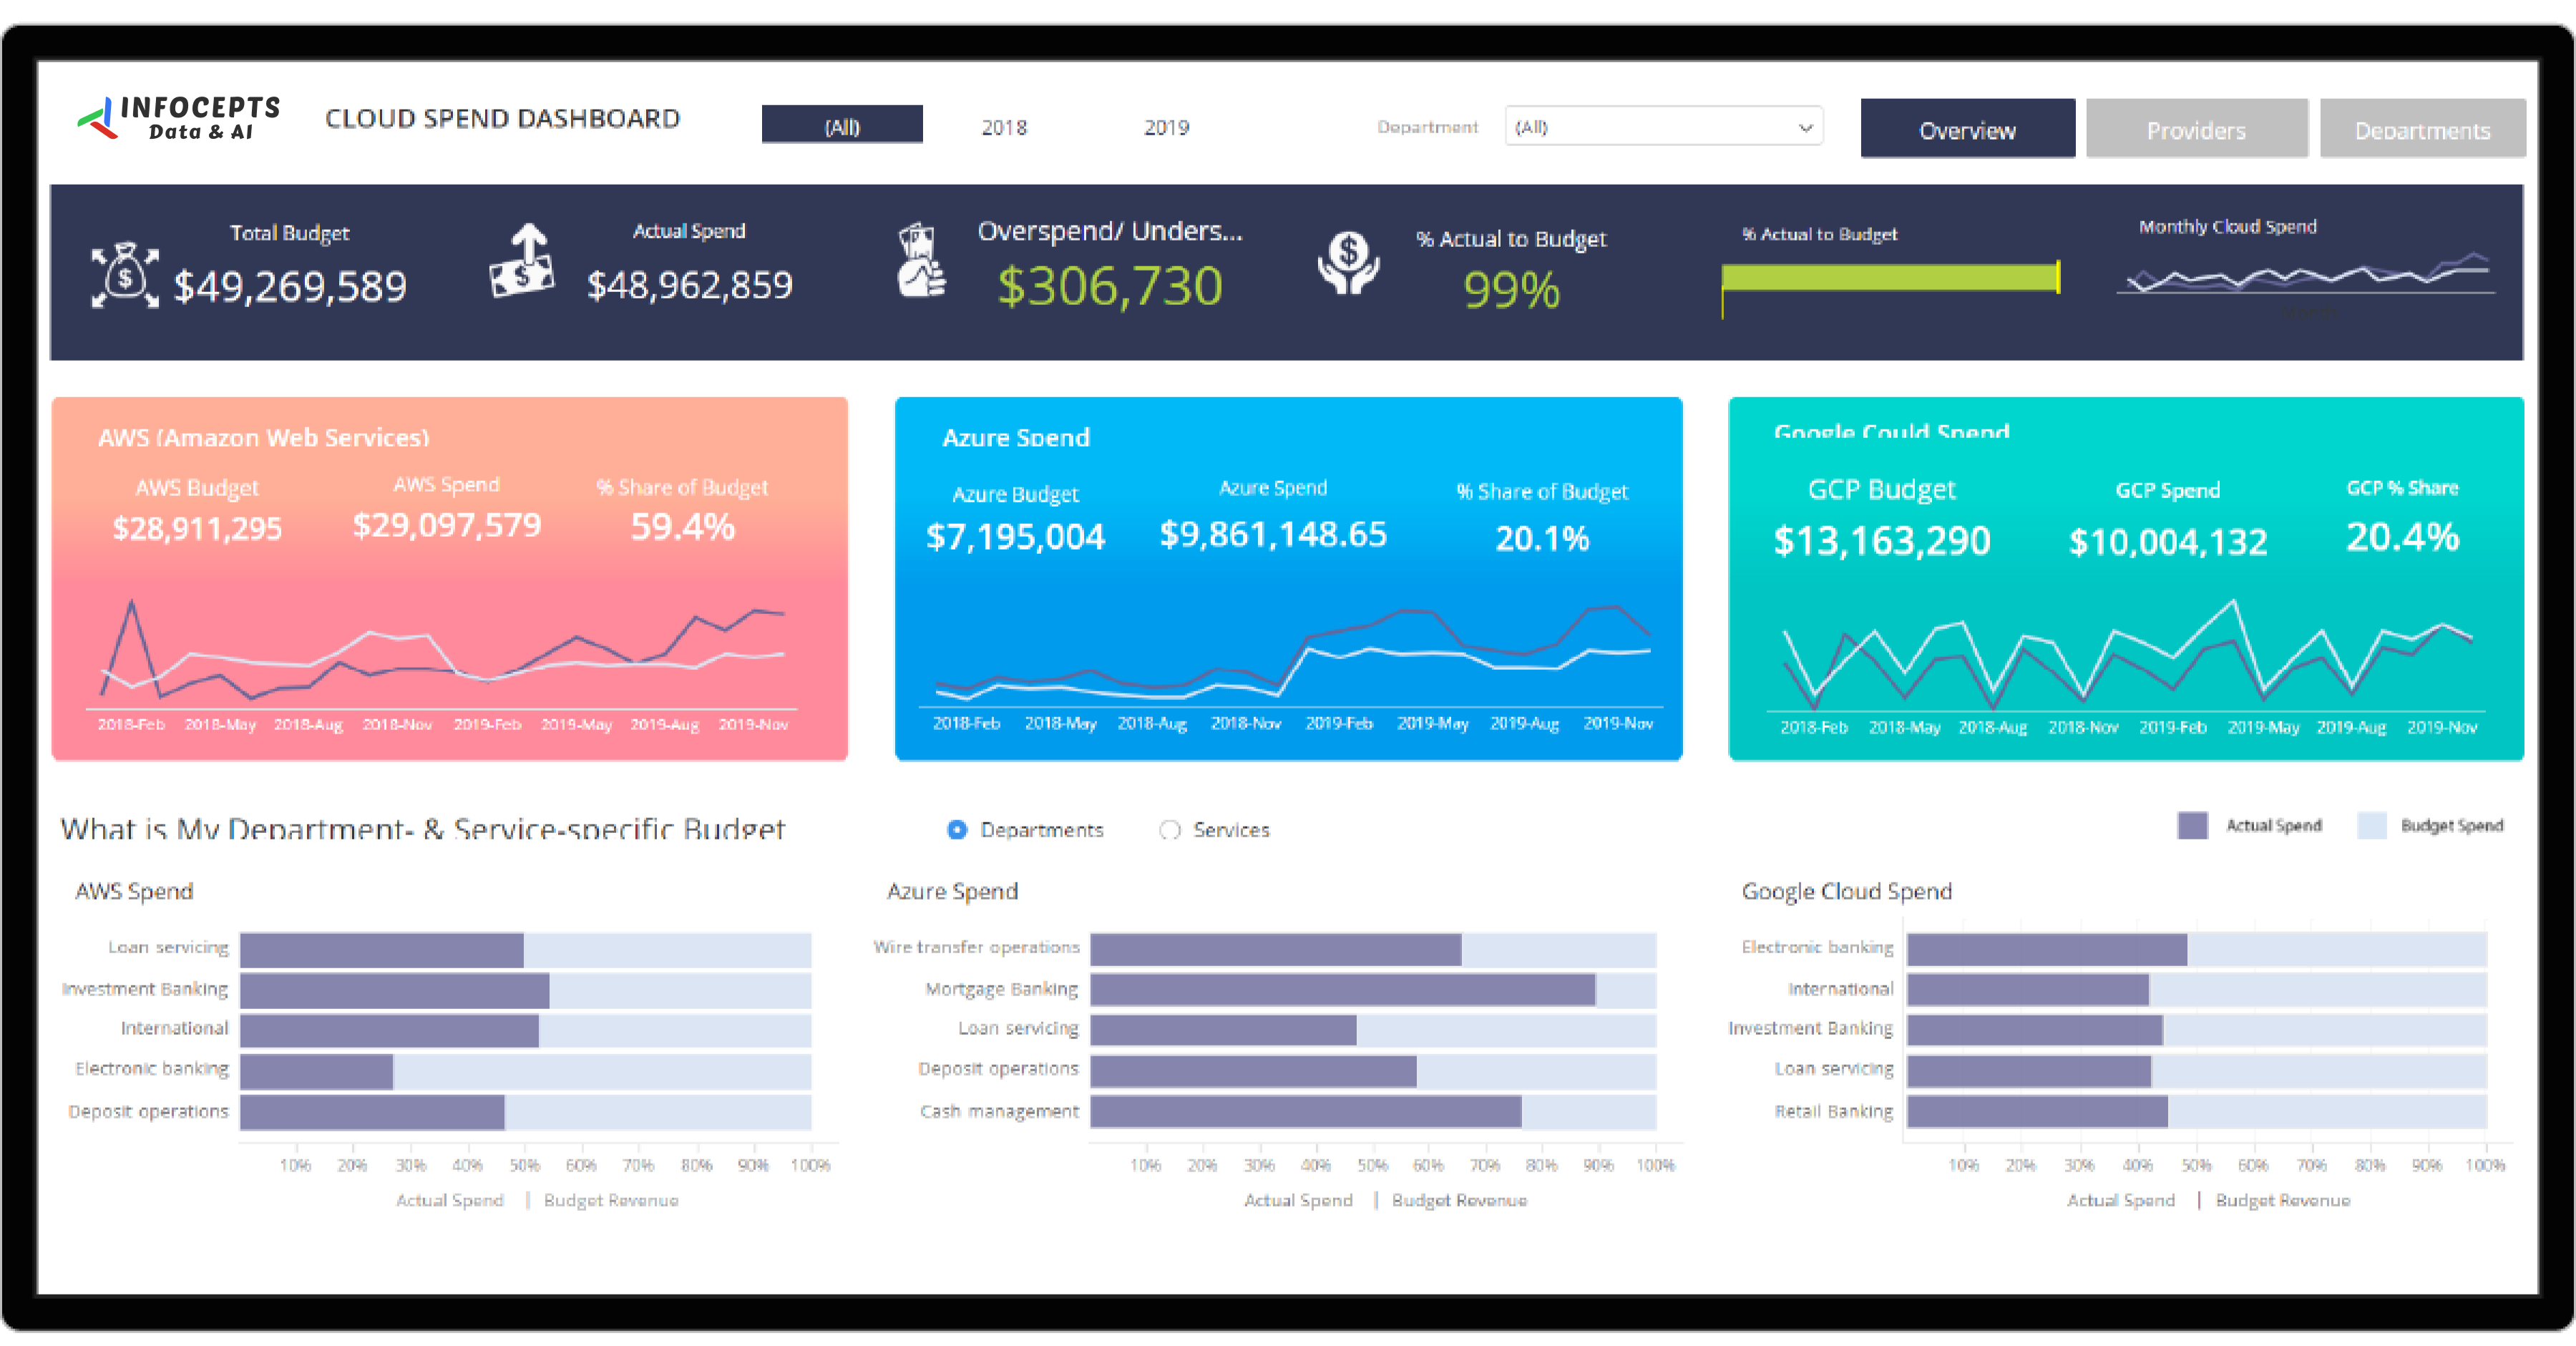
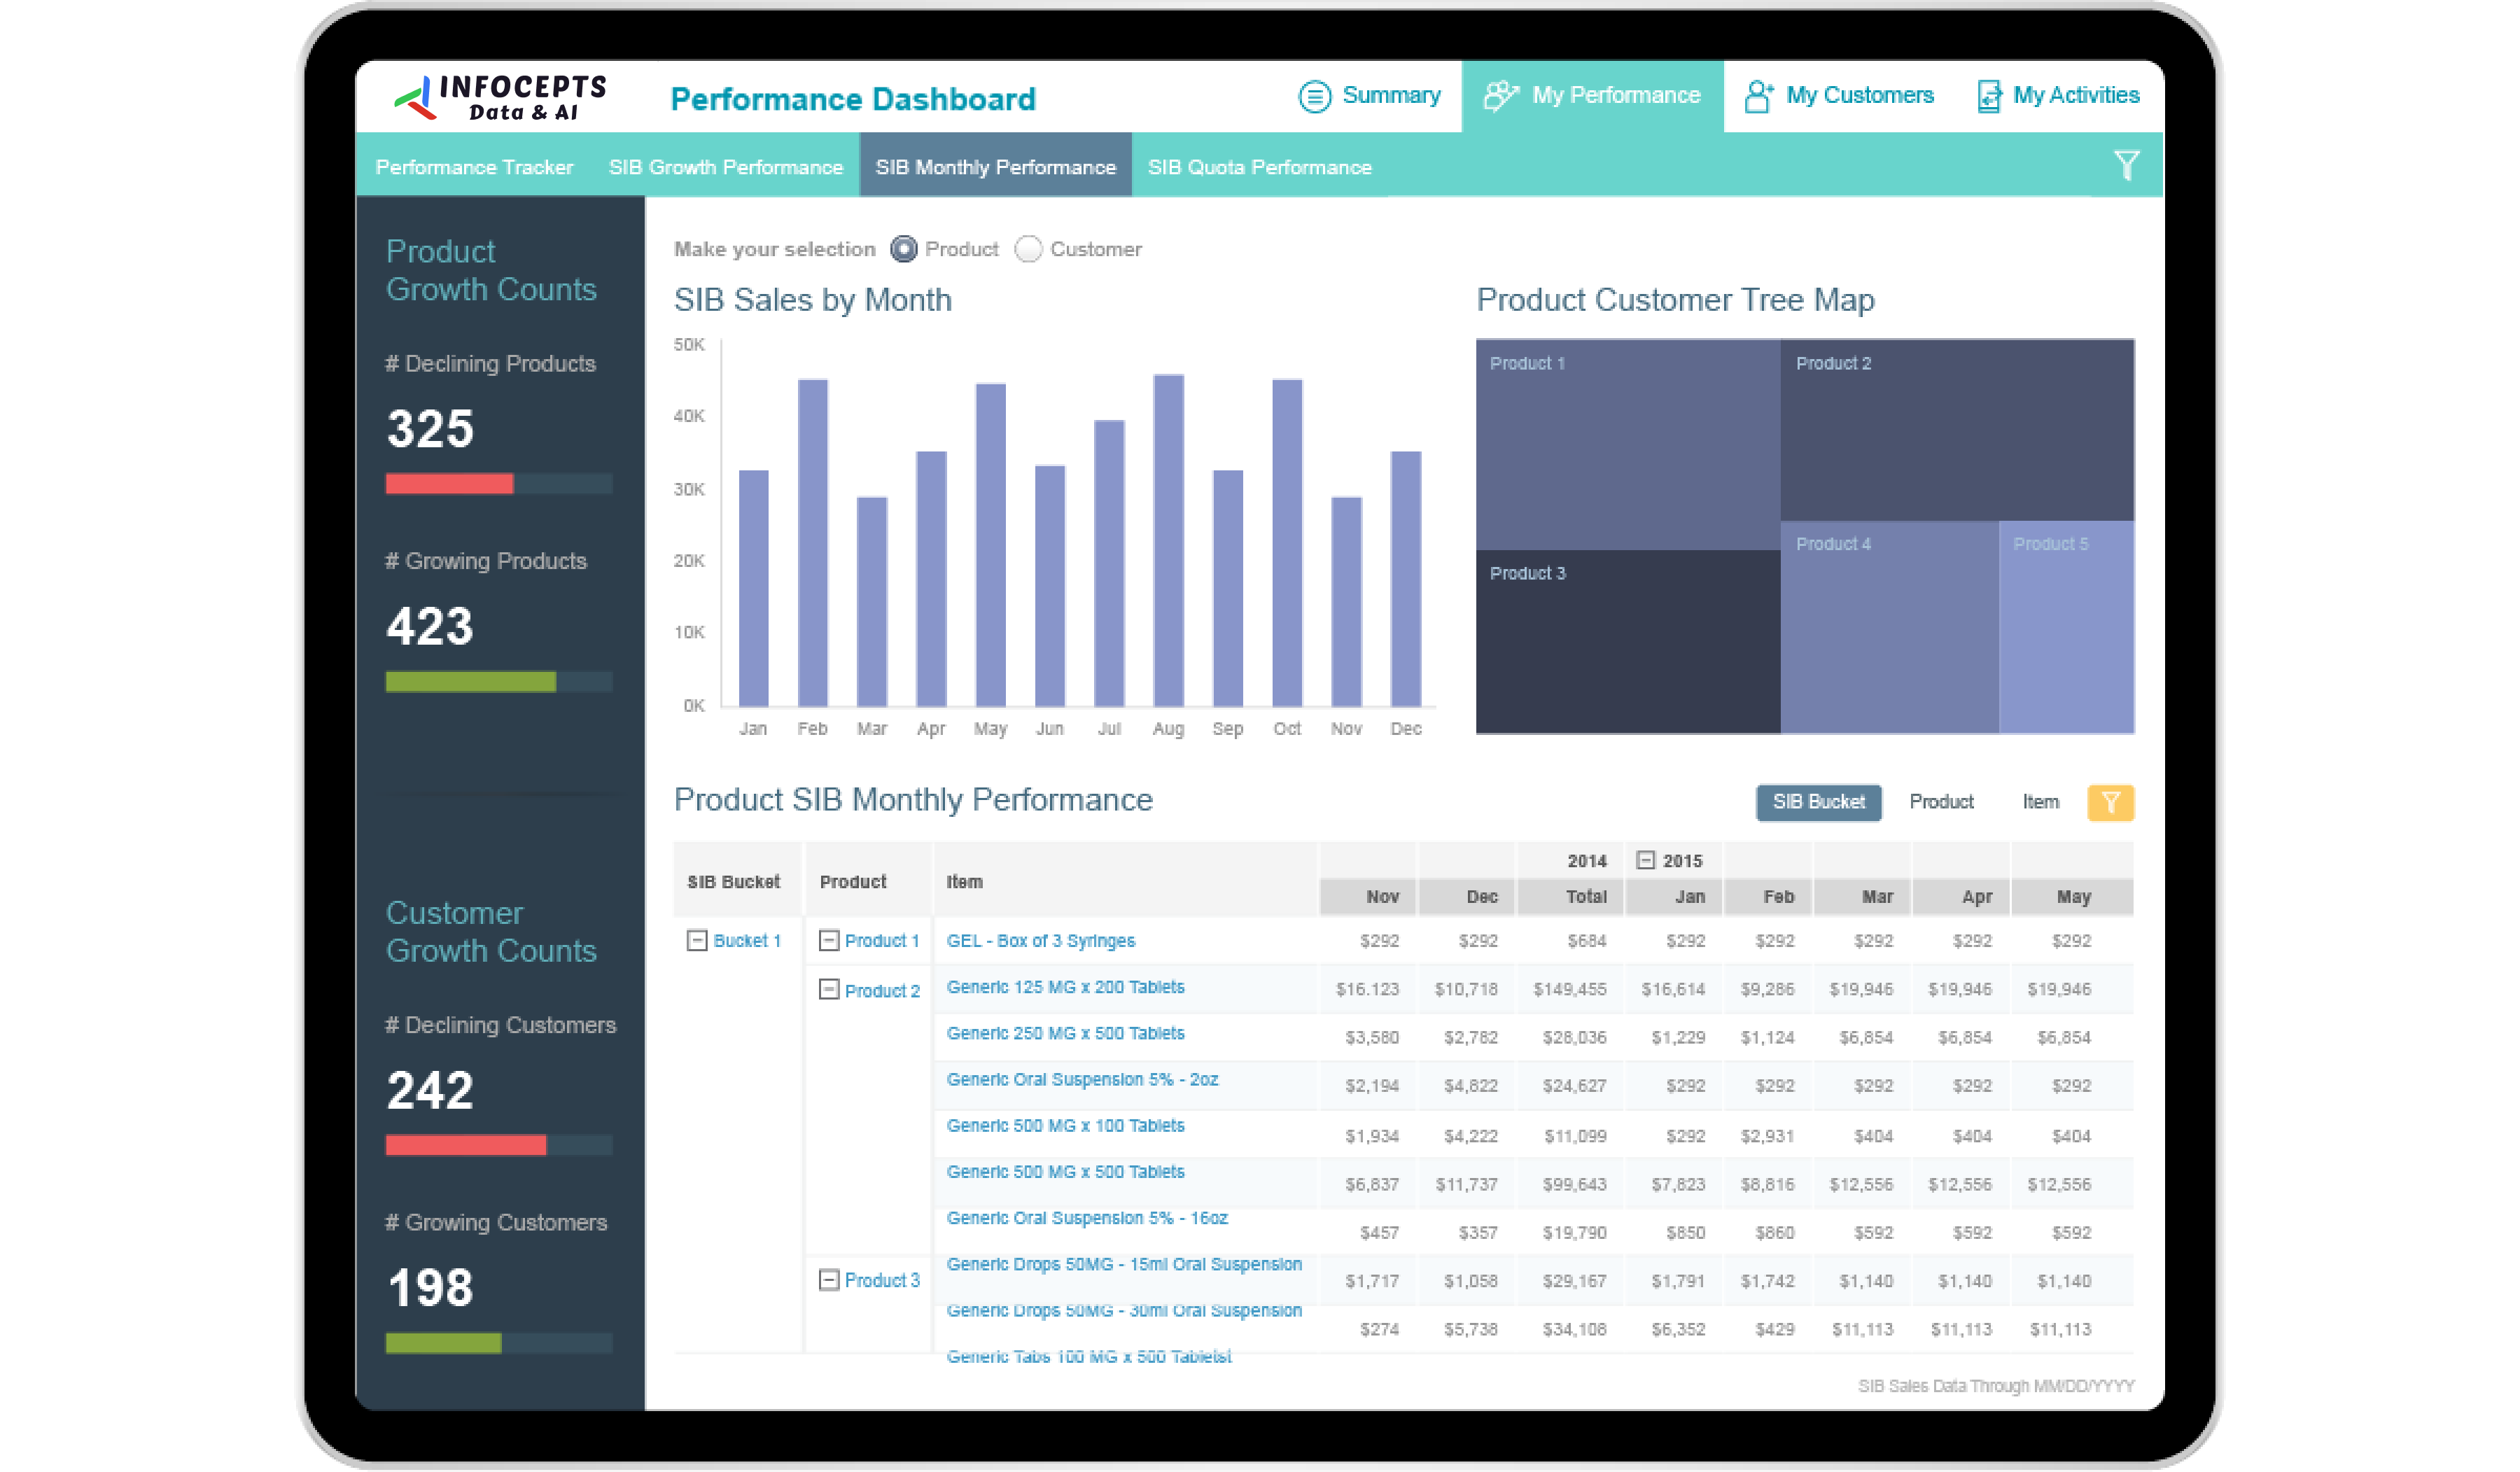
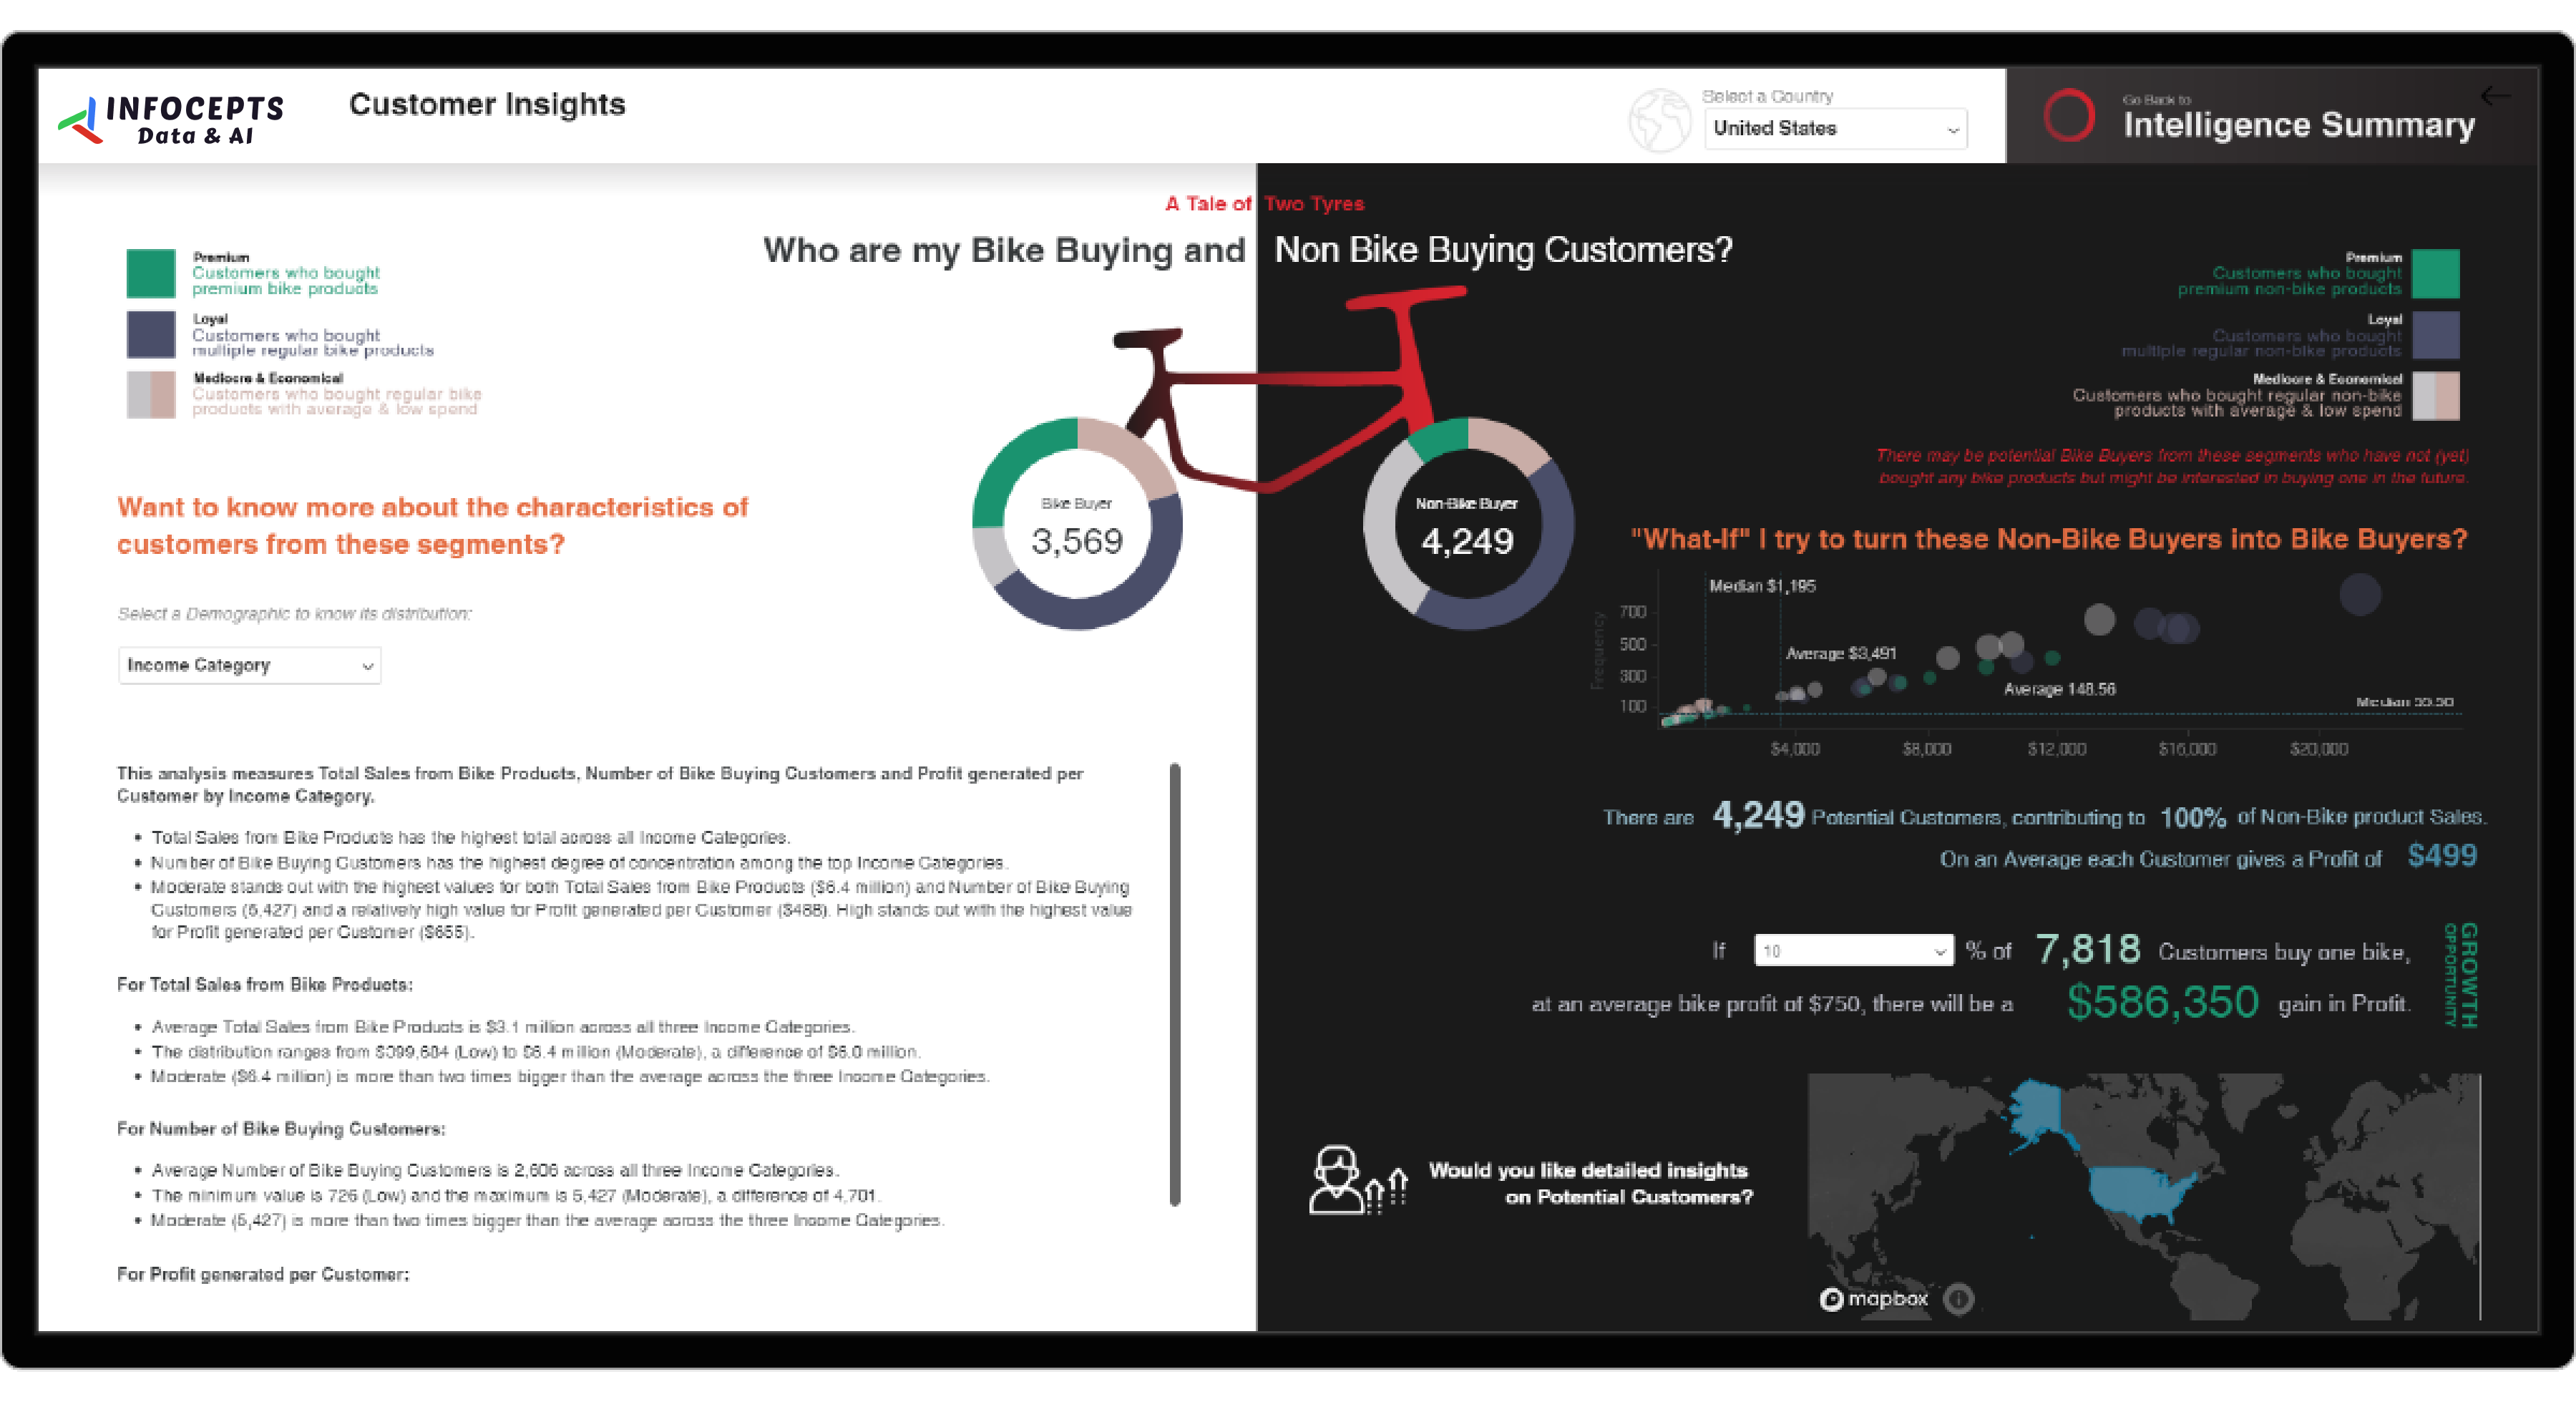
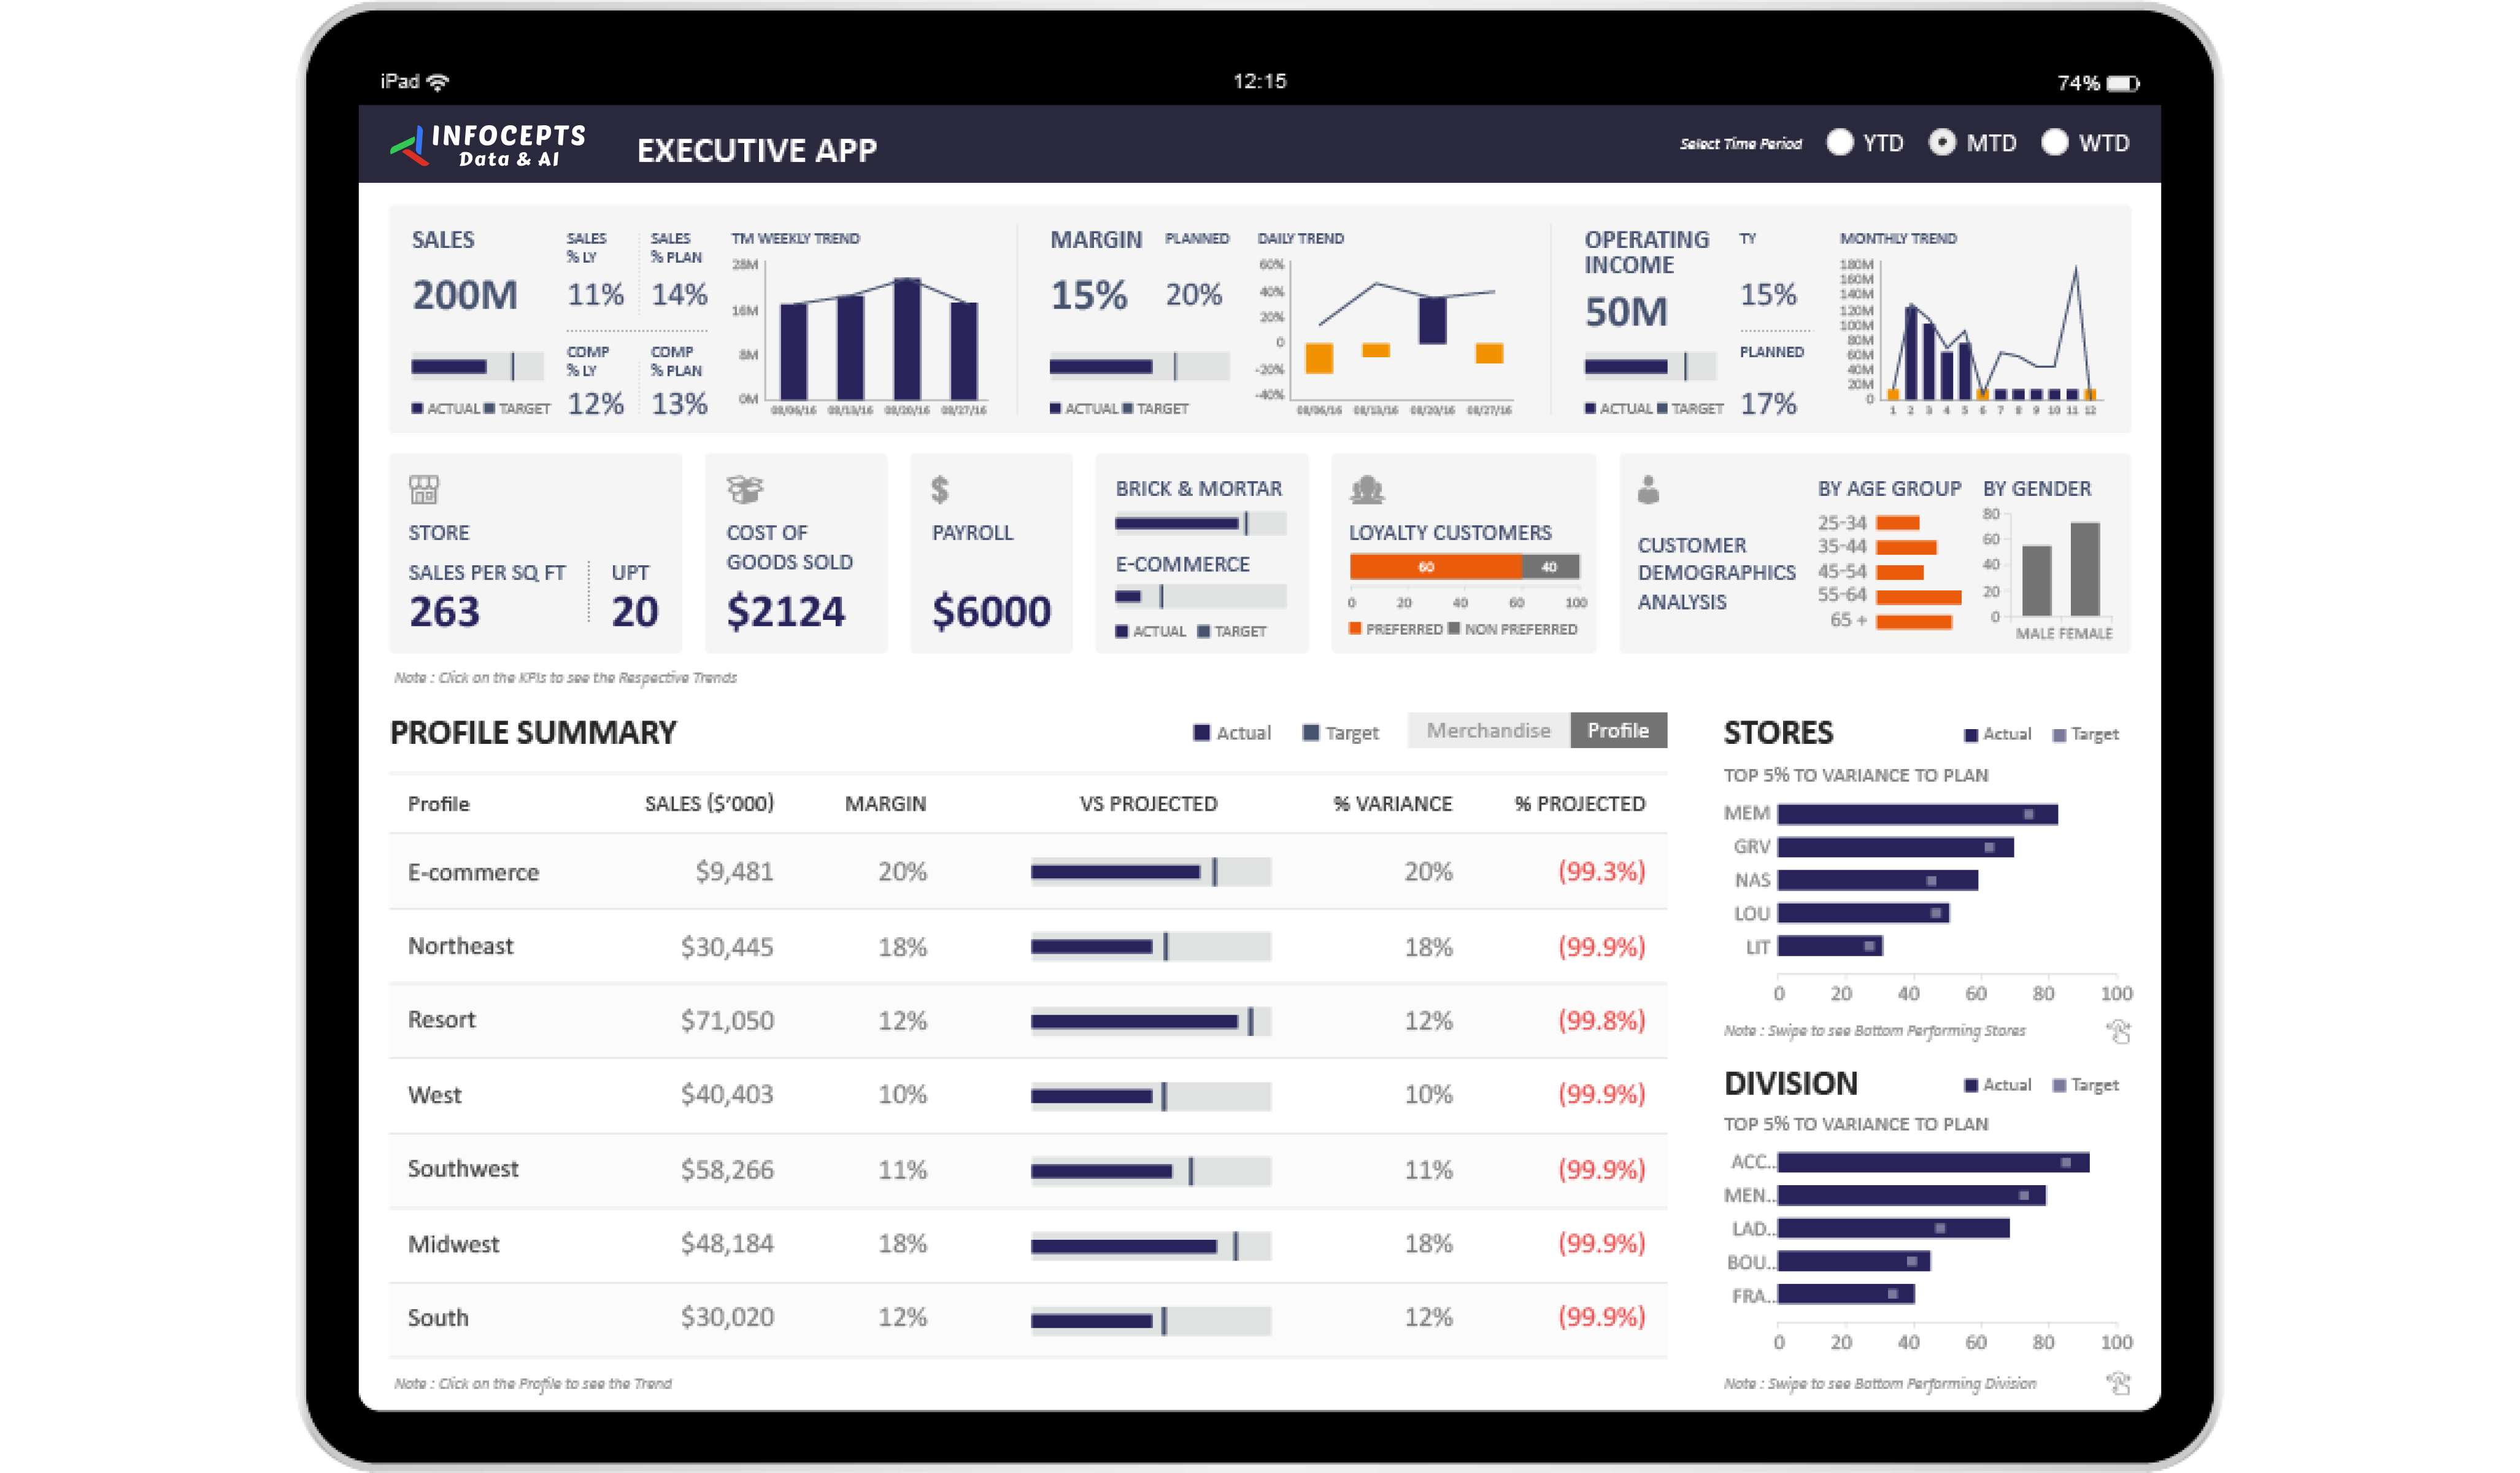
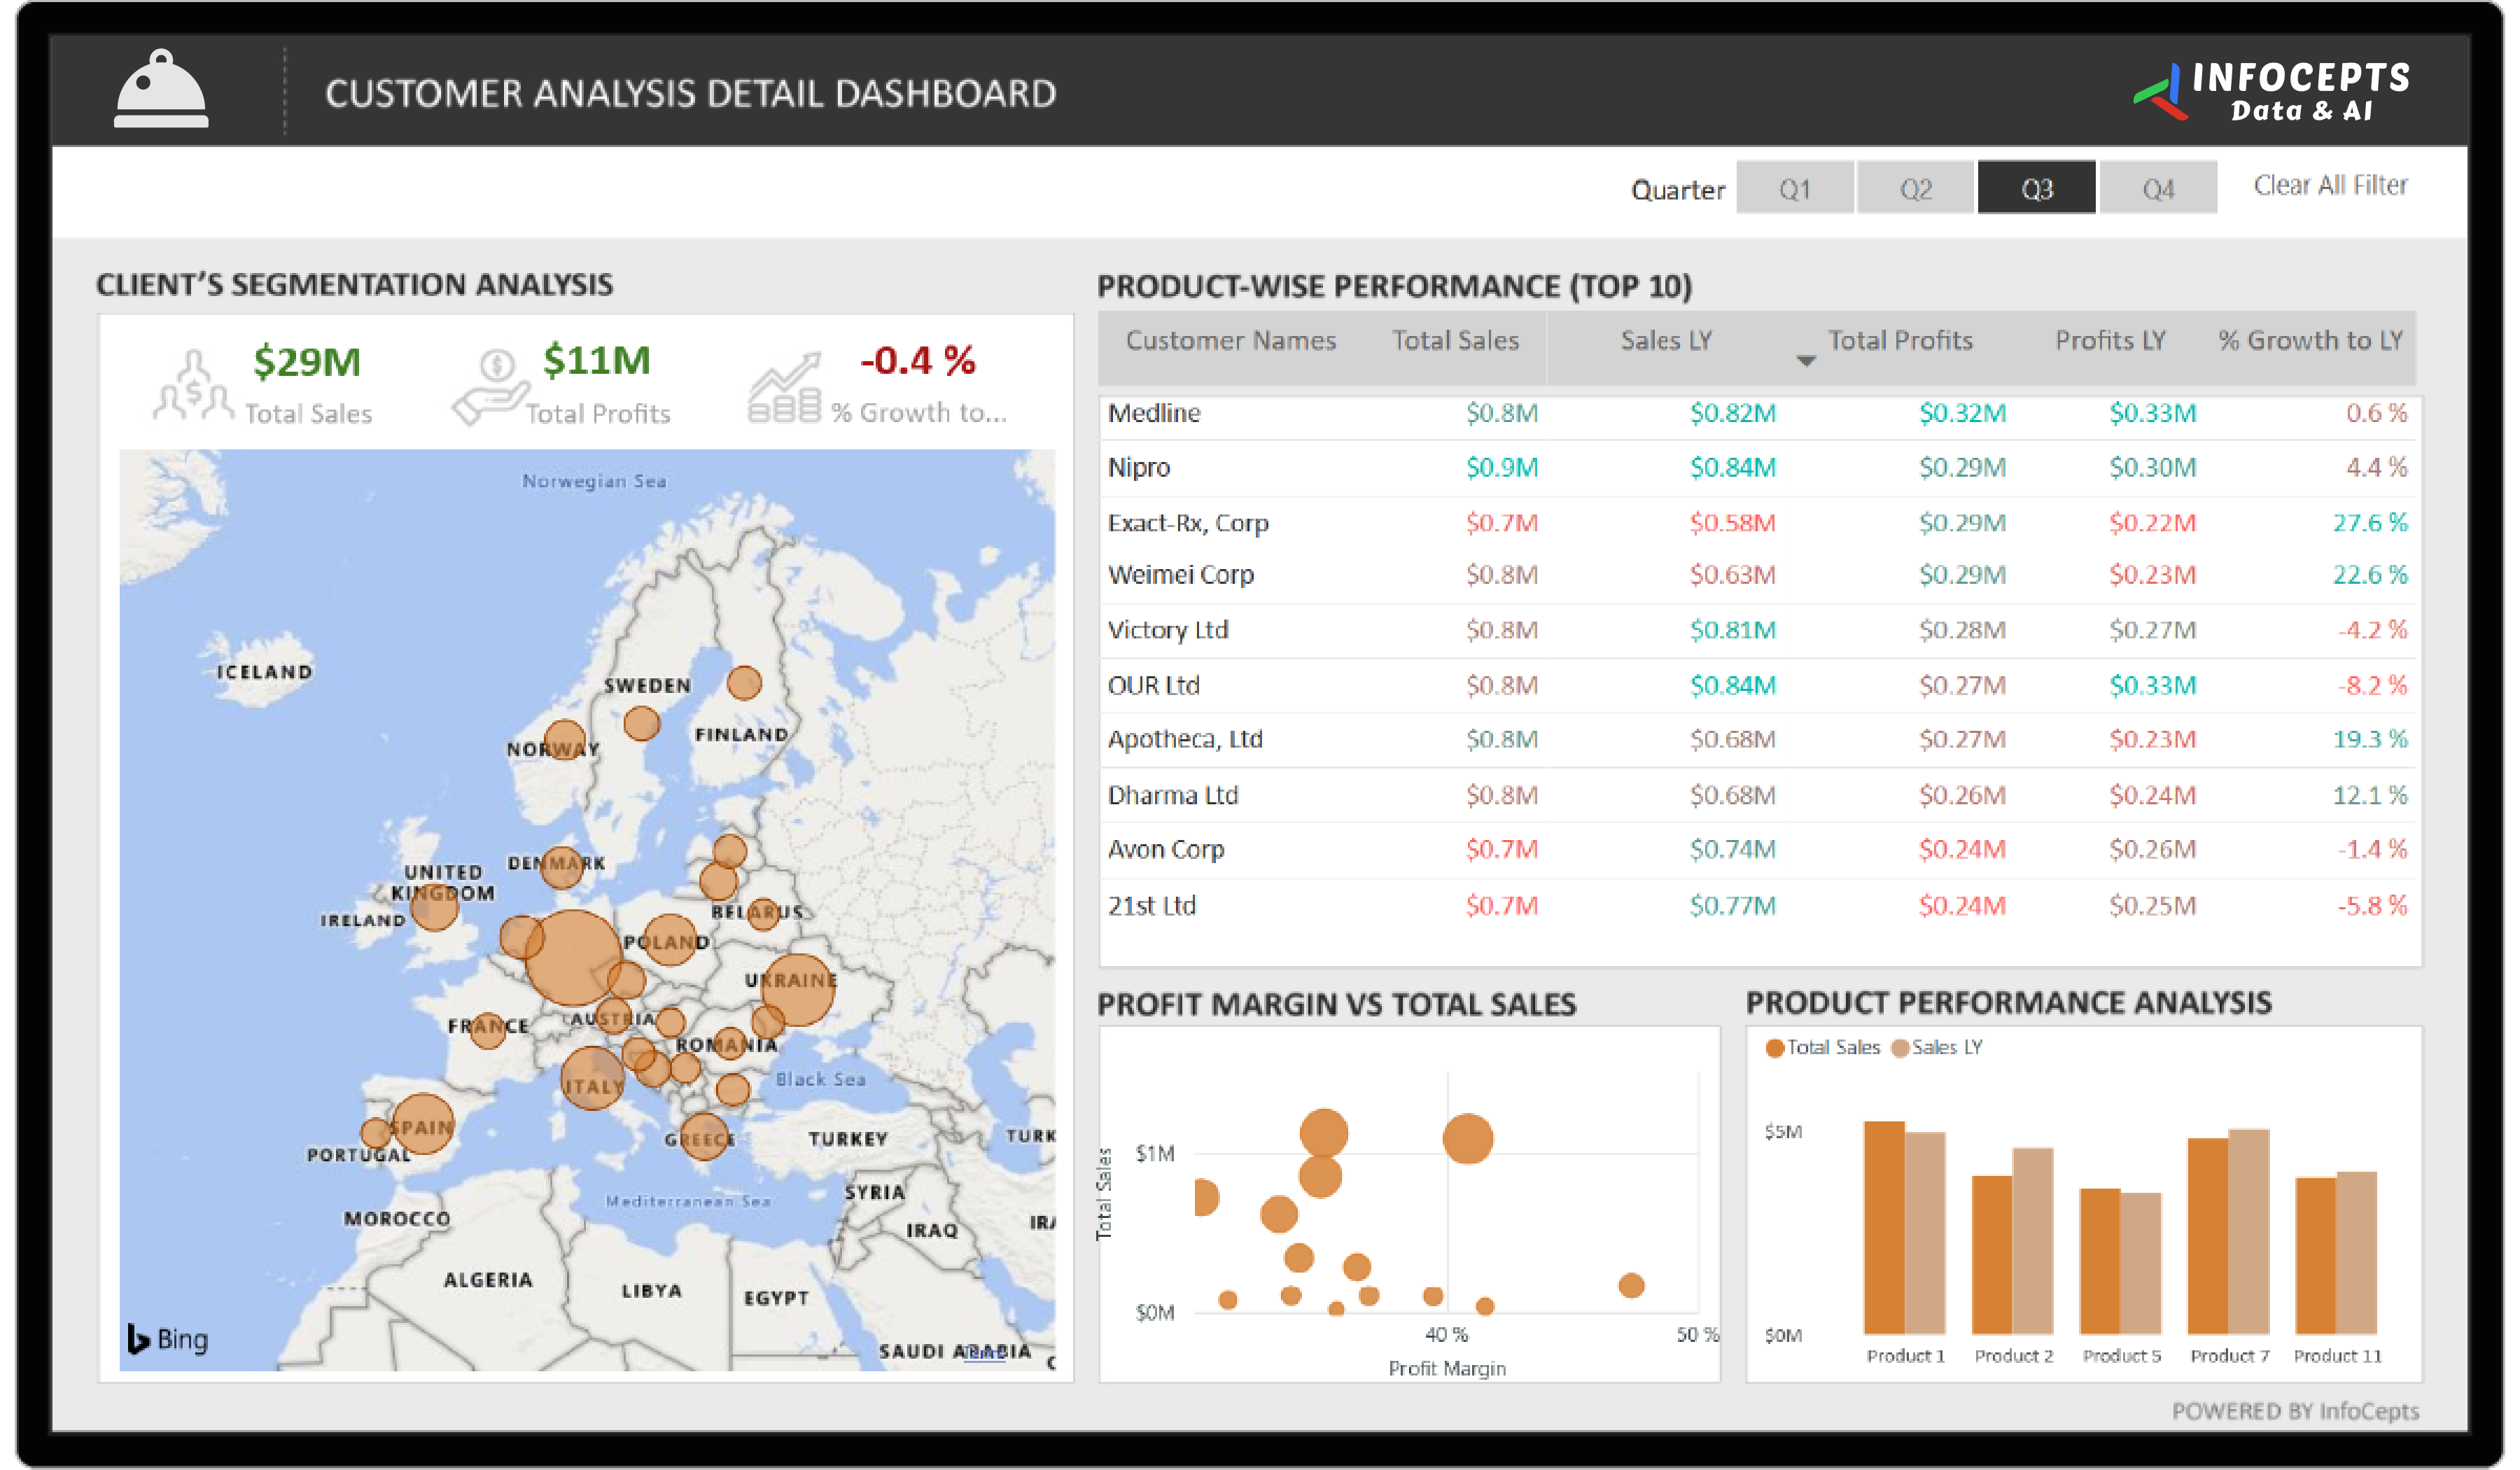
Provides businesses with valuable insights into product sales and profits across regional customer bases. Designed for analytical users, this tool helps track business growth across regions while providing a clear view of profit distribution among customers. Users can explore detailed insights through intuitive visualizations and a well-structured information hierarchy. Key highlights include region-wise financial flows and product-specific turnover by customers over time.
Frequently asked questions
It tracks product sales and profit distribution across regional customer bases in one view, so analytical teams see where profit is actually concentrated instead of only total revenue.
The same product can be profitable with one customer and marginal with another depending on pricing and volume; customer-level distribution surfaces that difference.
Visibility into which regions are actually driving growth versus which are flat, so investment and attention can follow where growth is happening.
Analytical and finance teams responsible for understanding where product profitability is concentrated across customers and regions.
Trend data shows whether a customer or region’s contribution is growing or shrinking, which a single snapshot number cannot tell you.
By connecting sales and financial data into a BI platform through Business Analytics services, for Retail & CPG organizations.

 Pranali Lanjewar