




23%
Improvement in Cash Flow Analysis
62%
Capture of Revenue vs. Expenses Trends
39%
Reduction in Financial Risk
35%
Increase in Debt-to-Equity Ratio
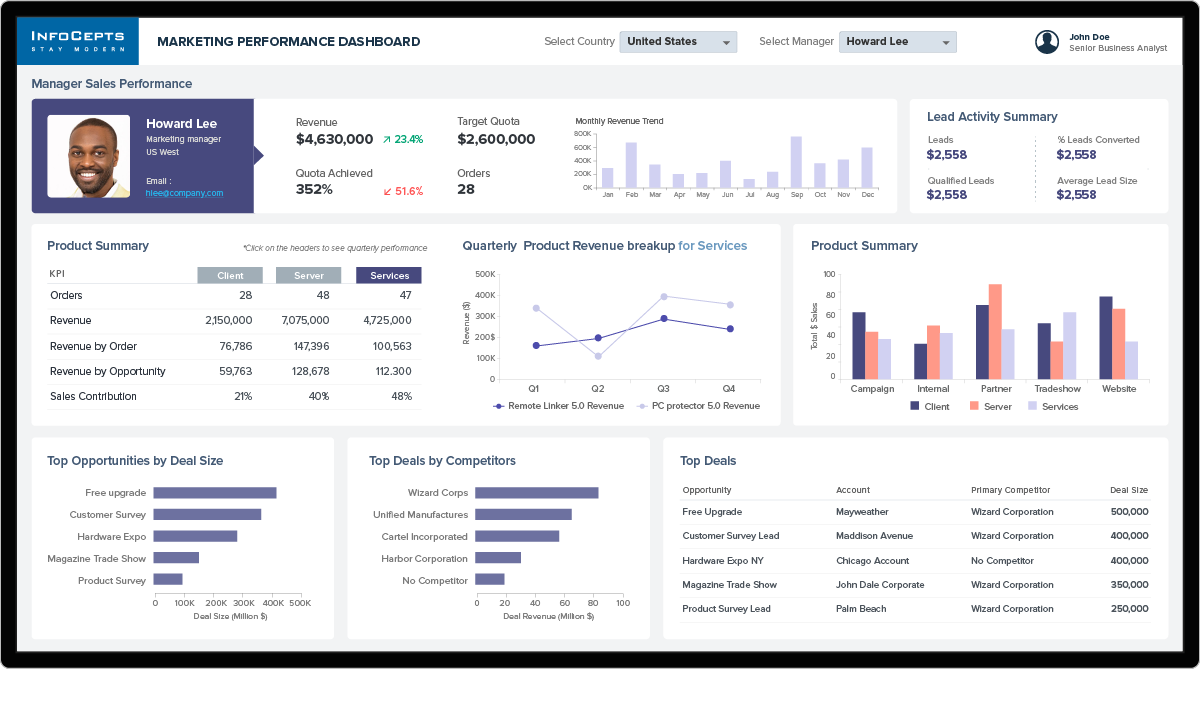
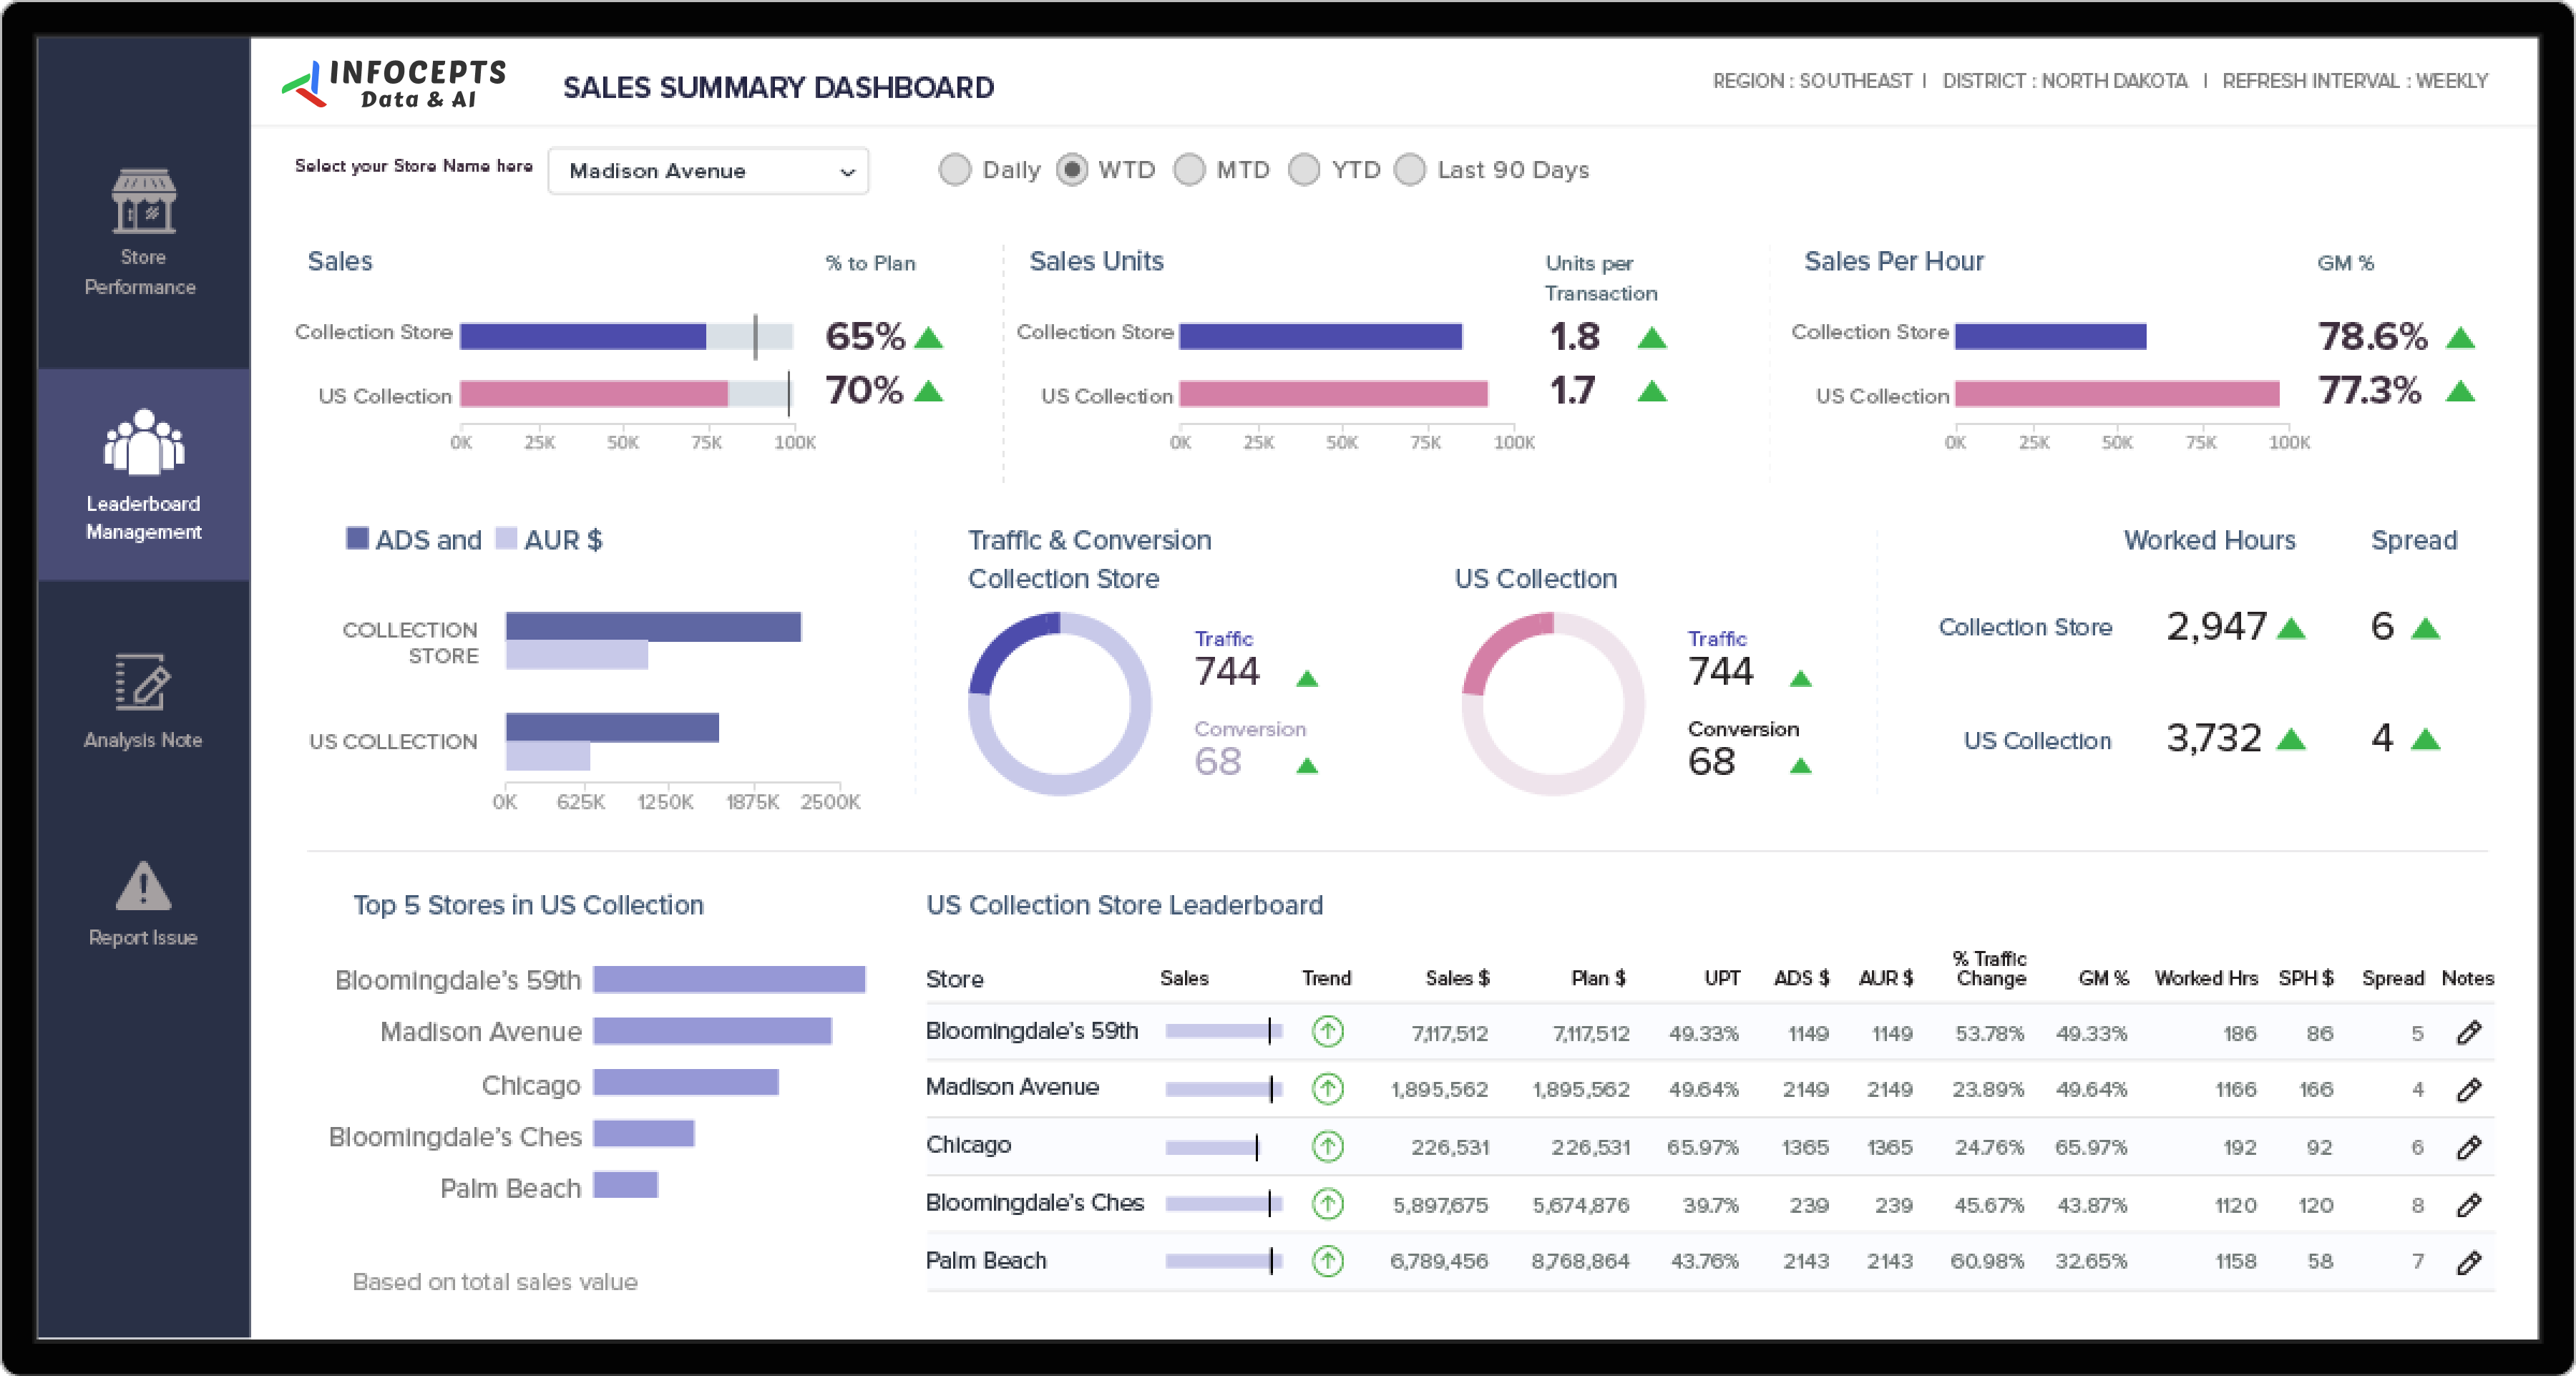
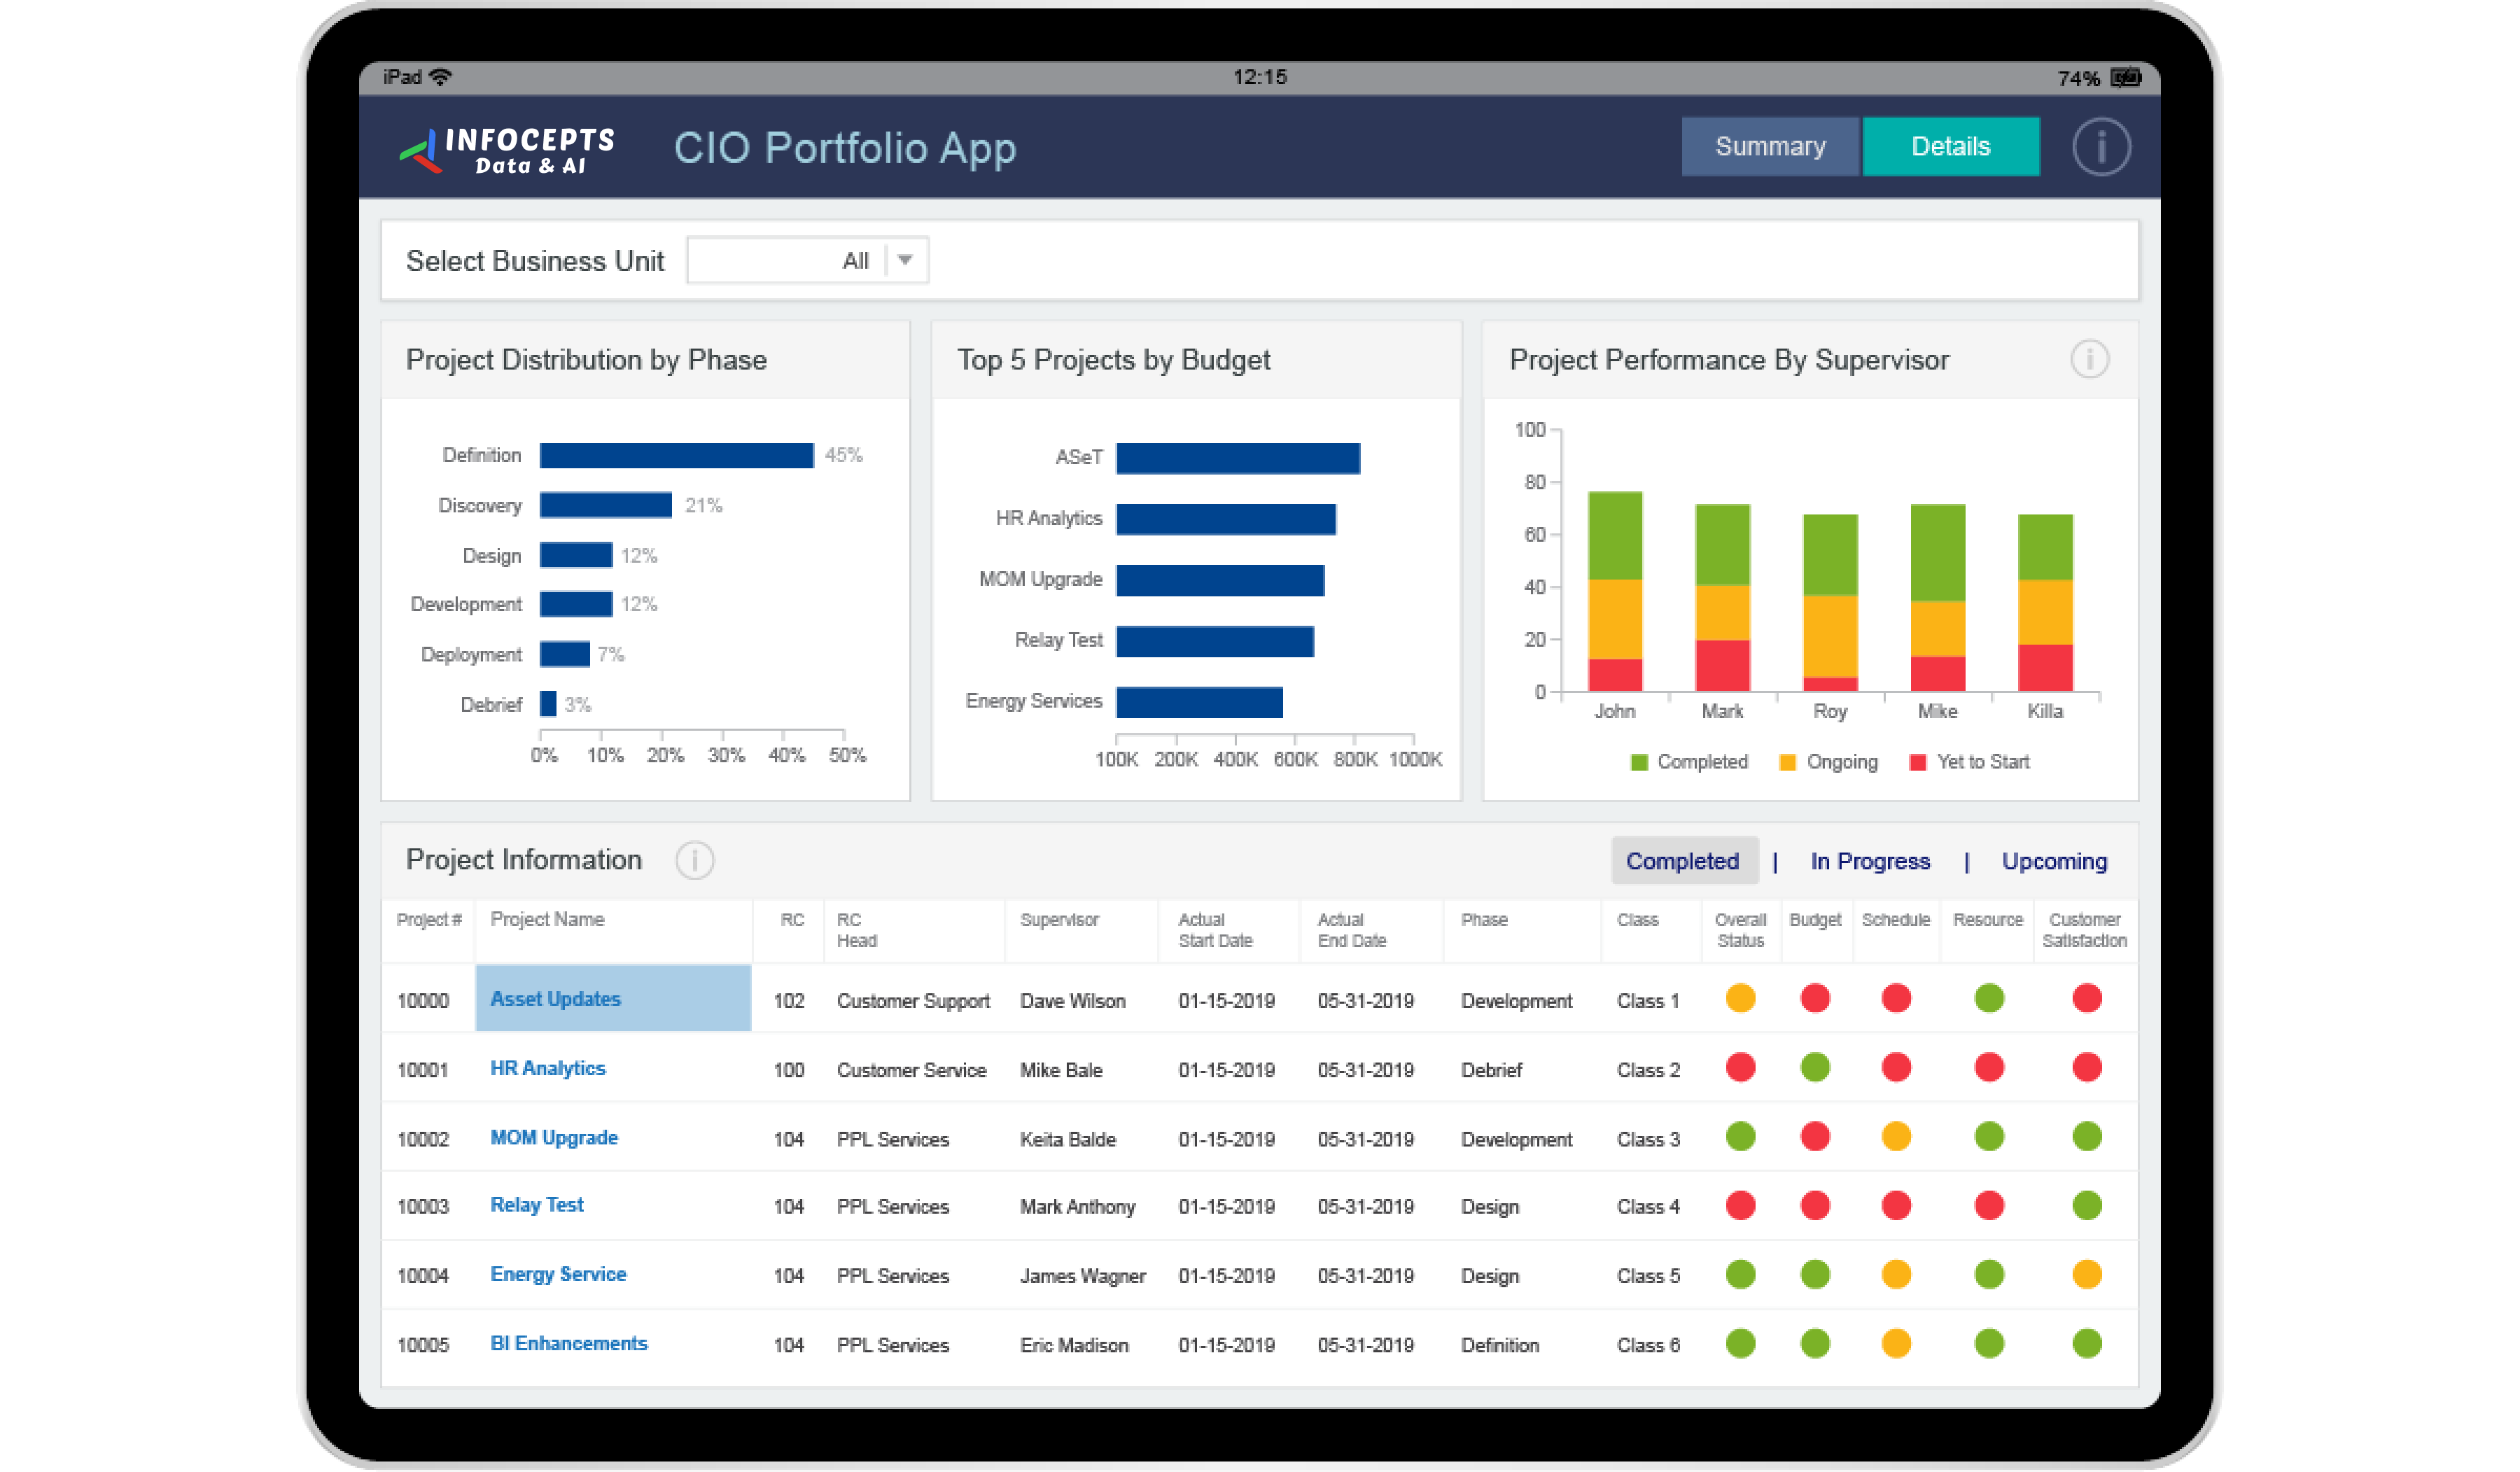
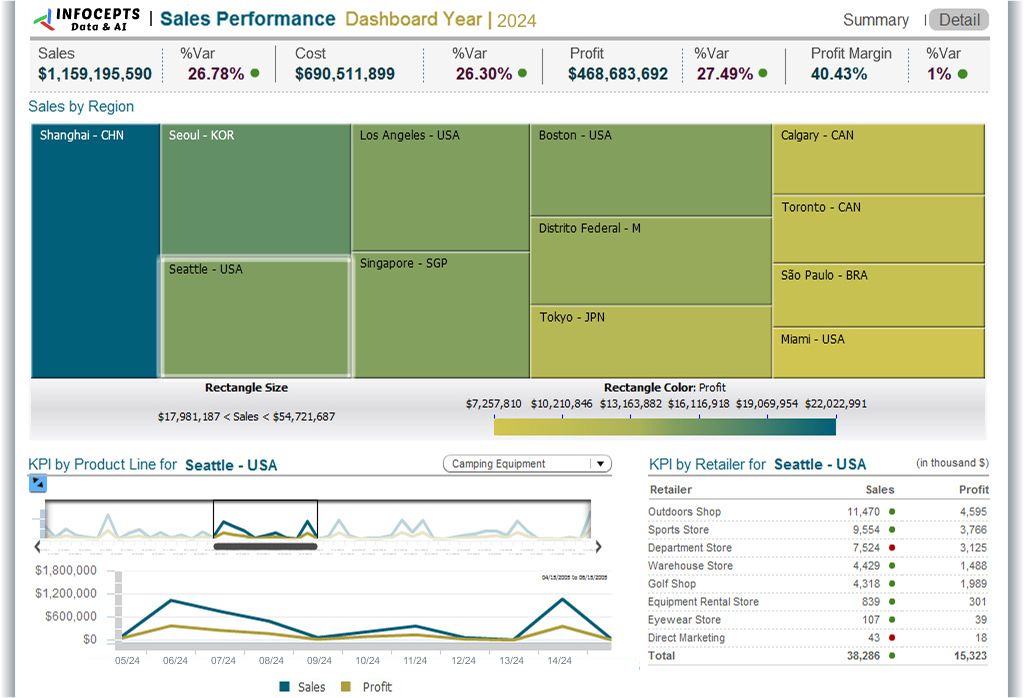
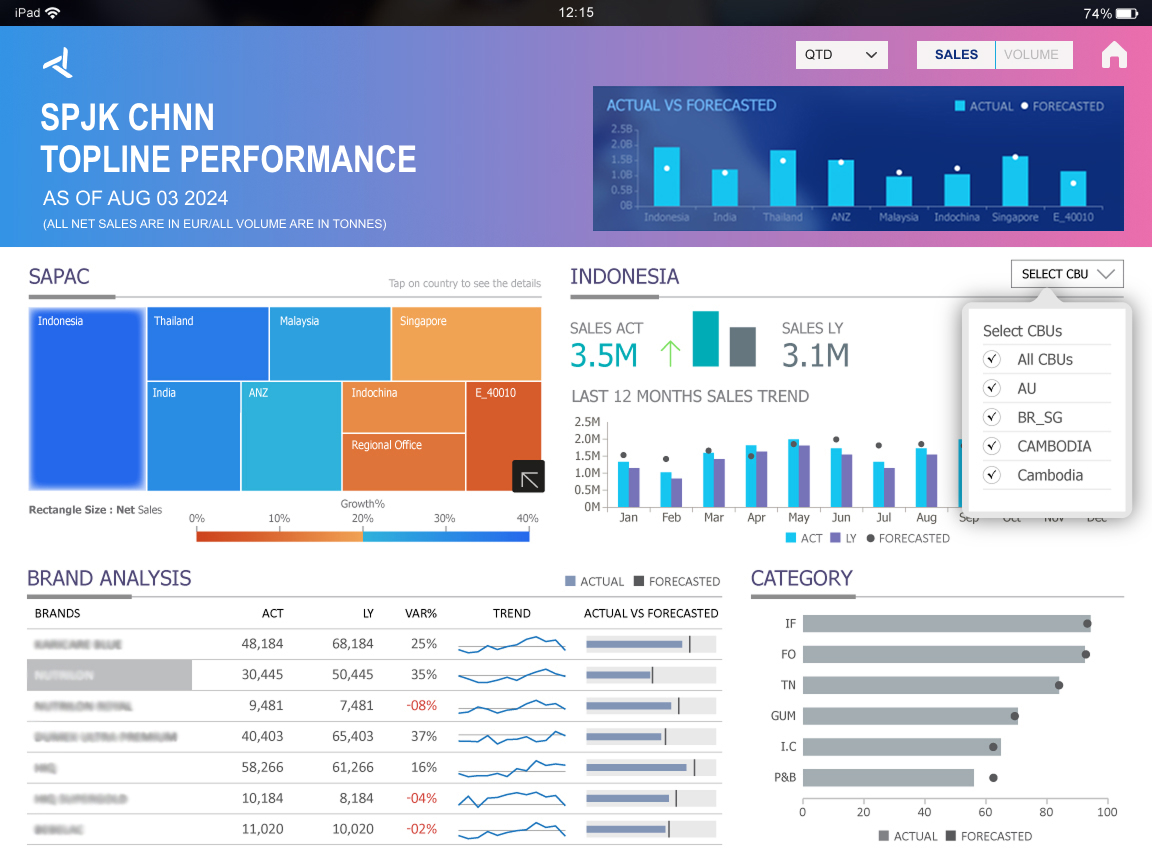
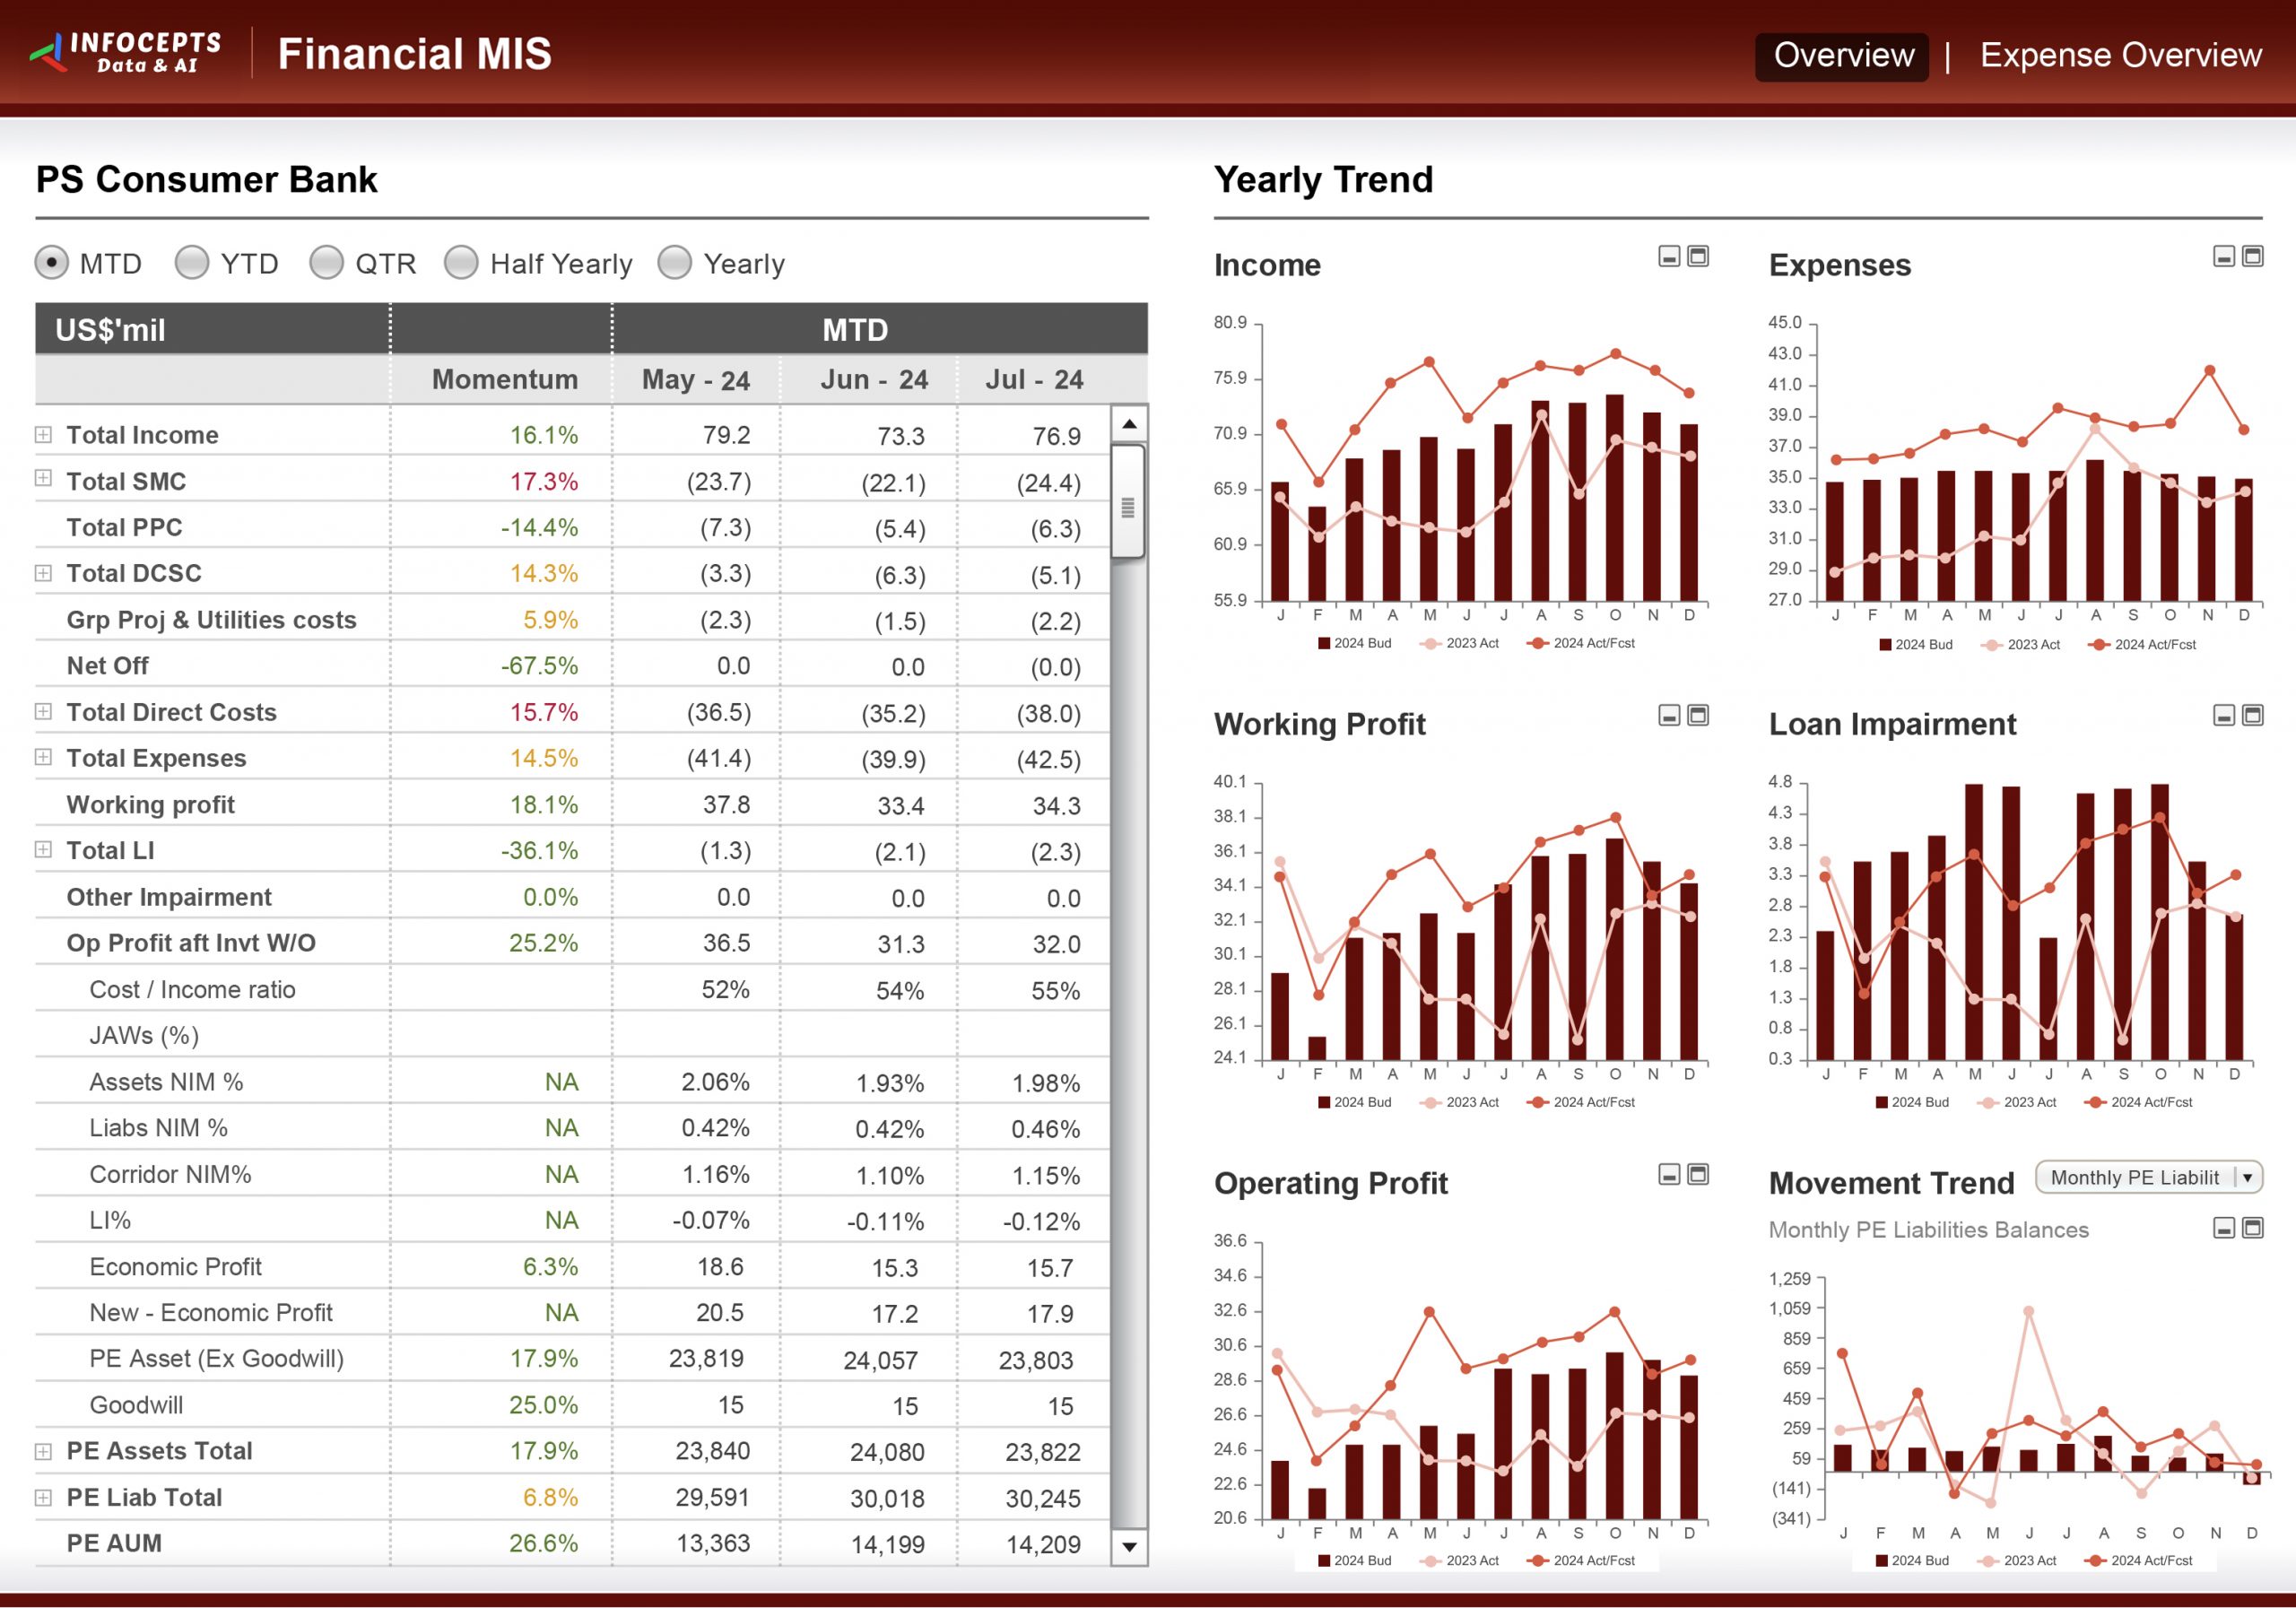
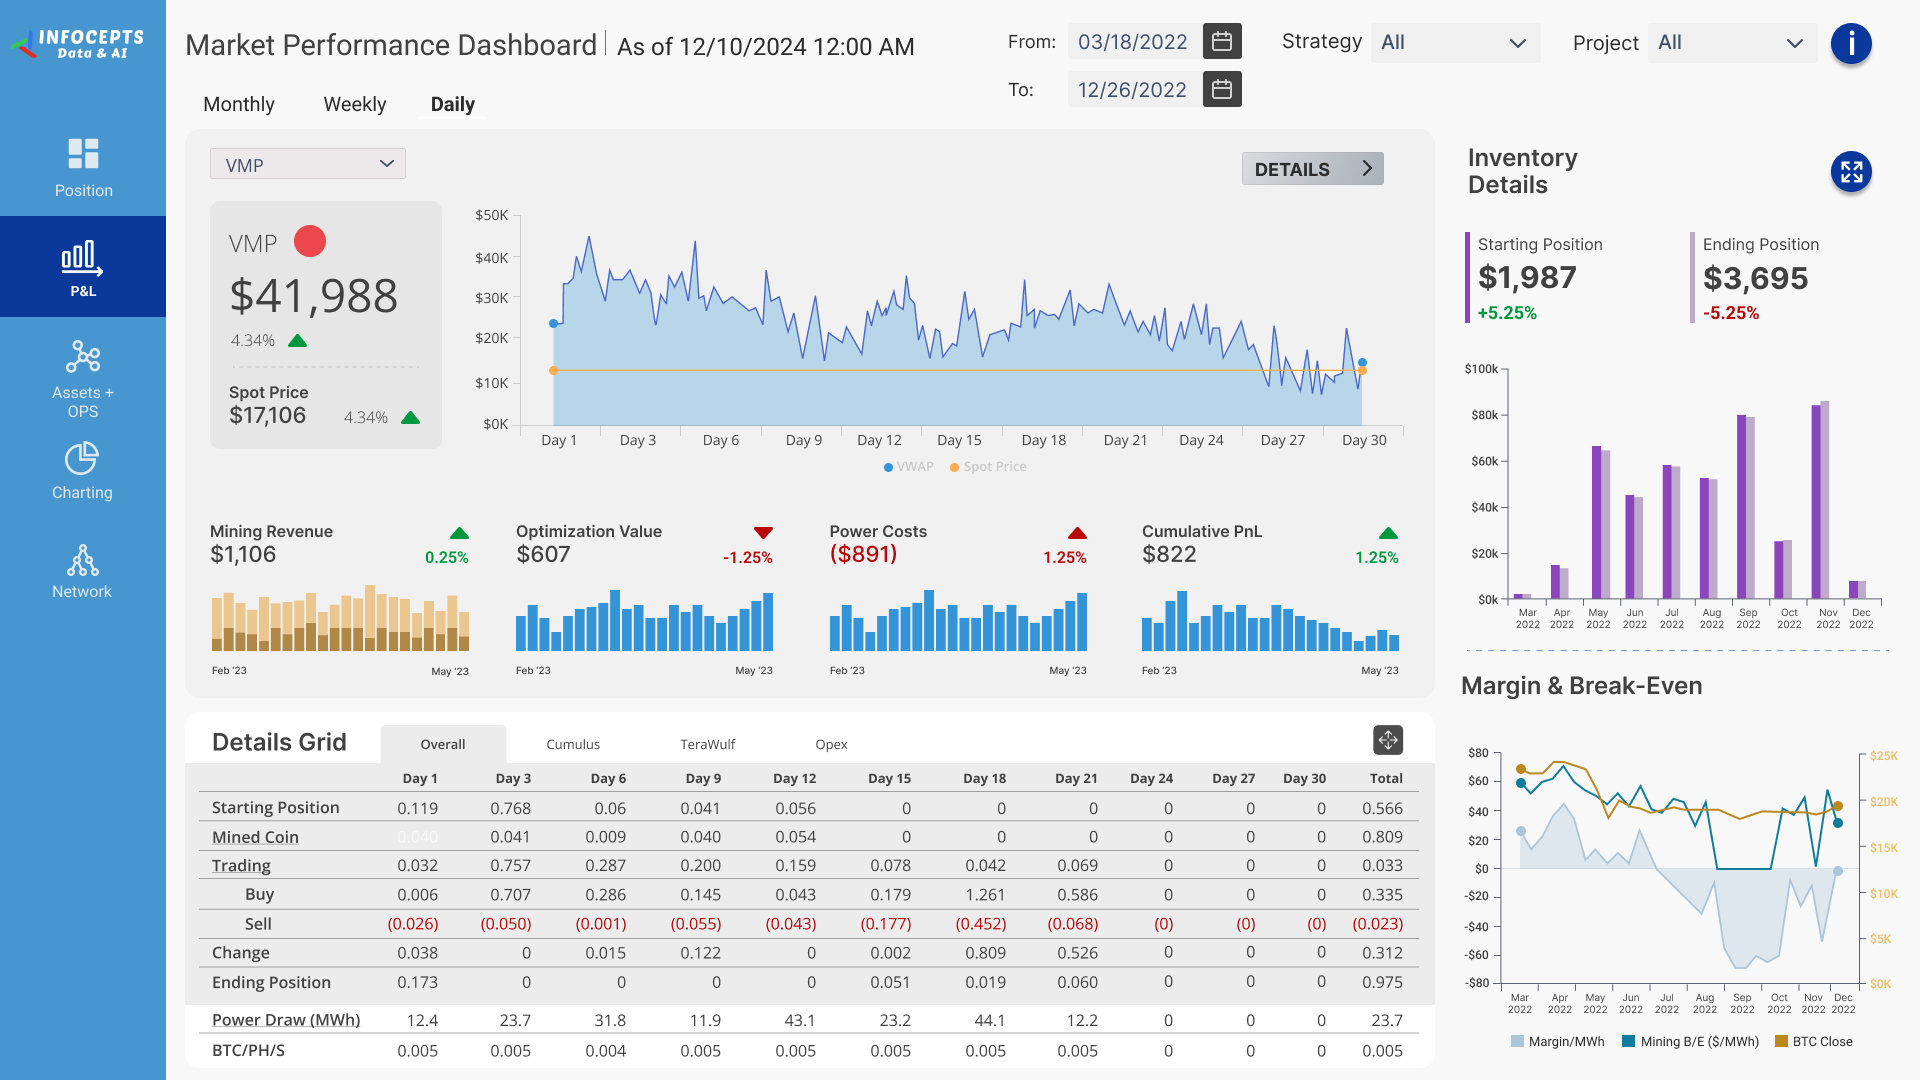
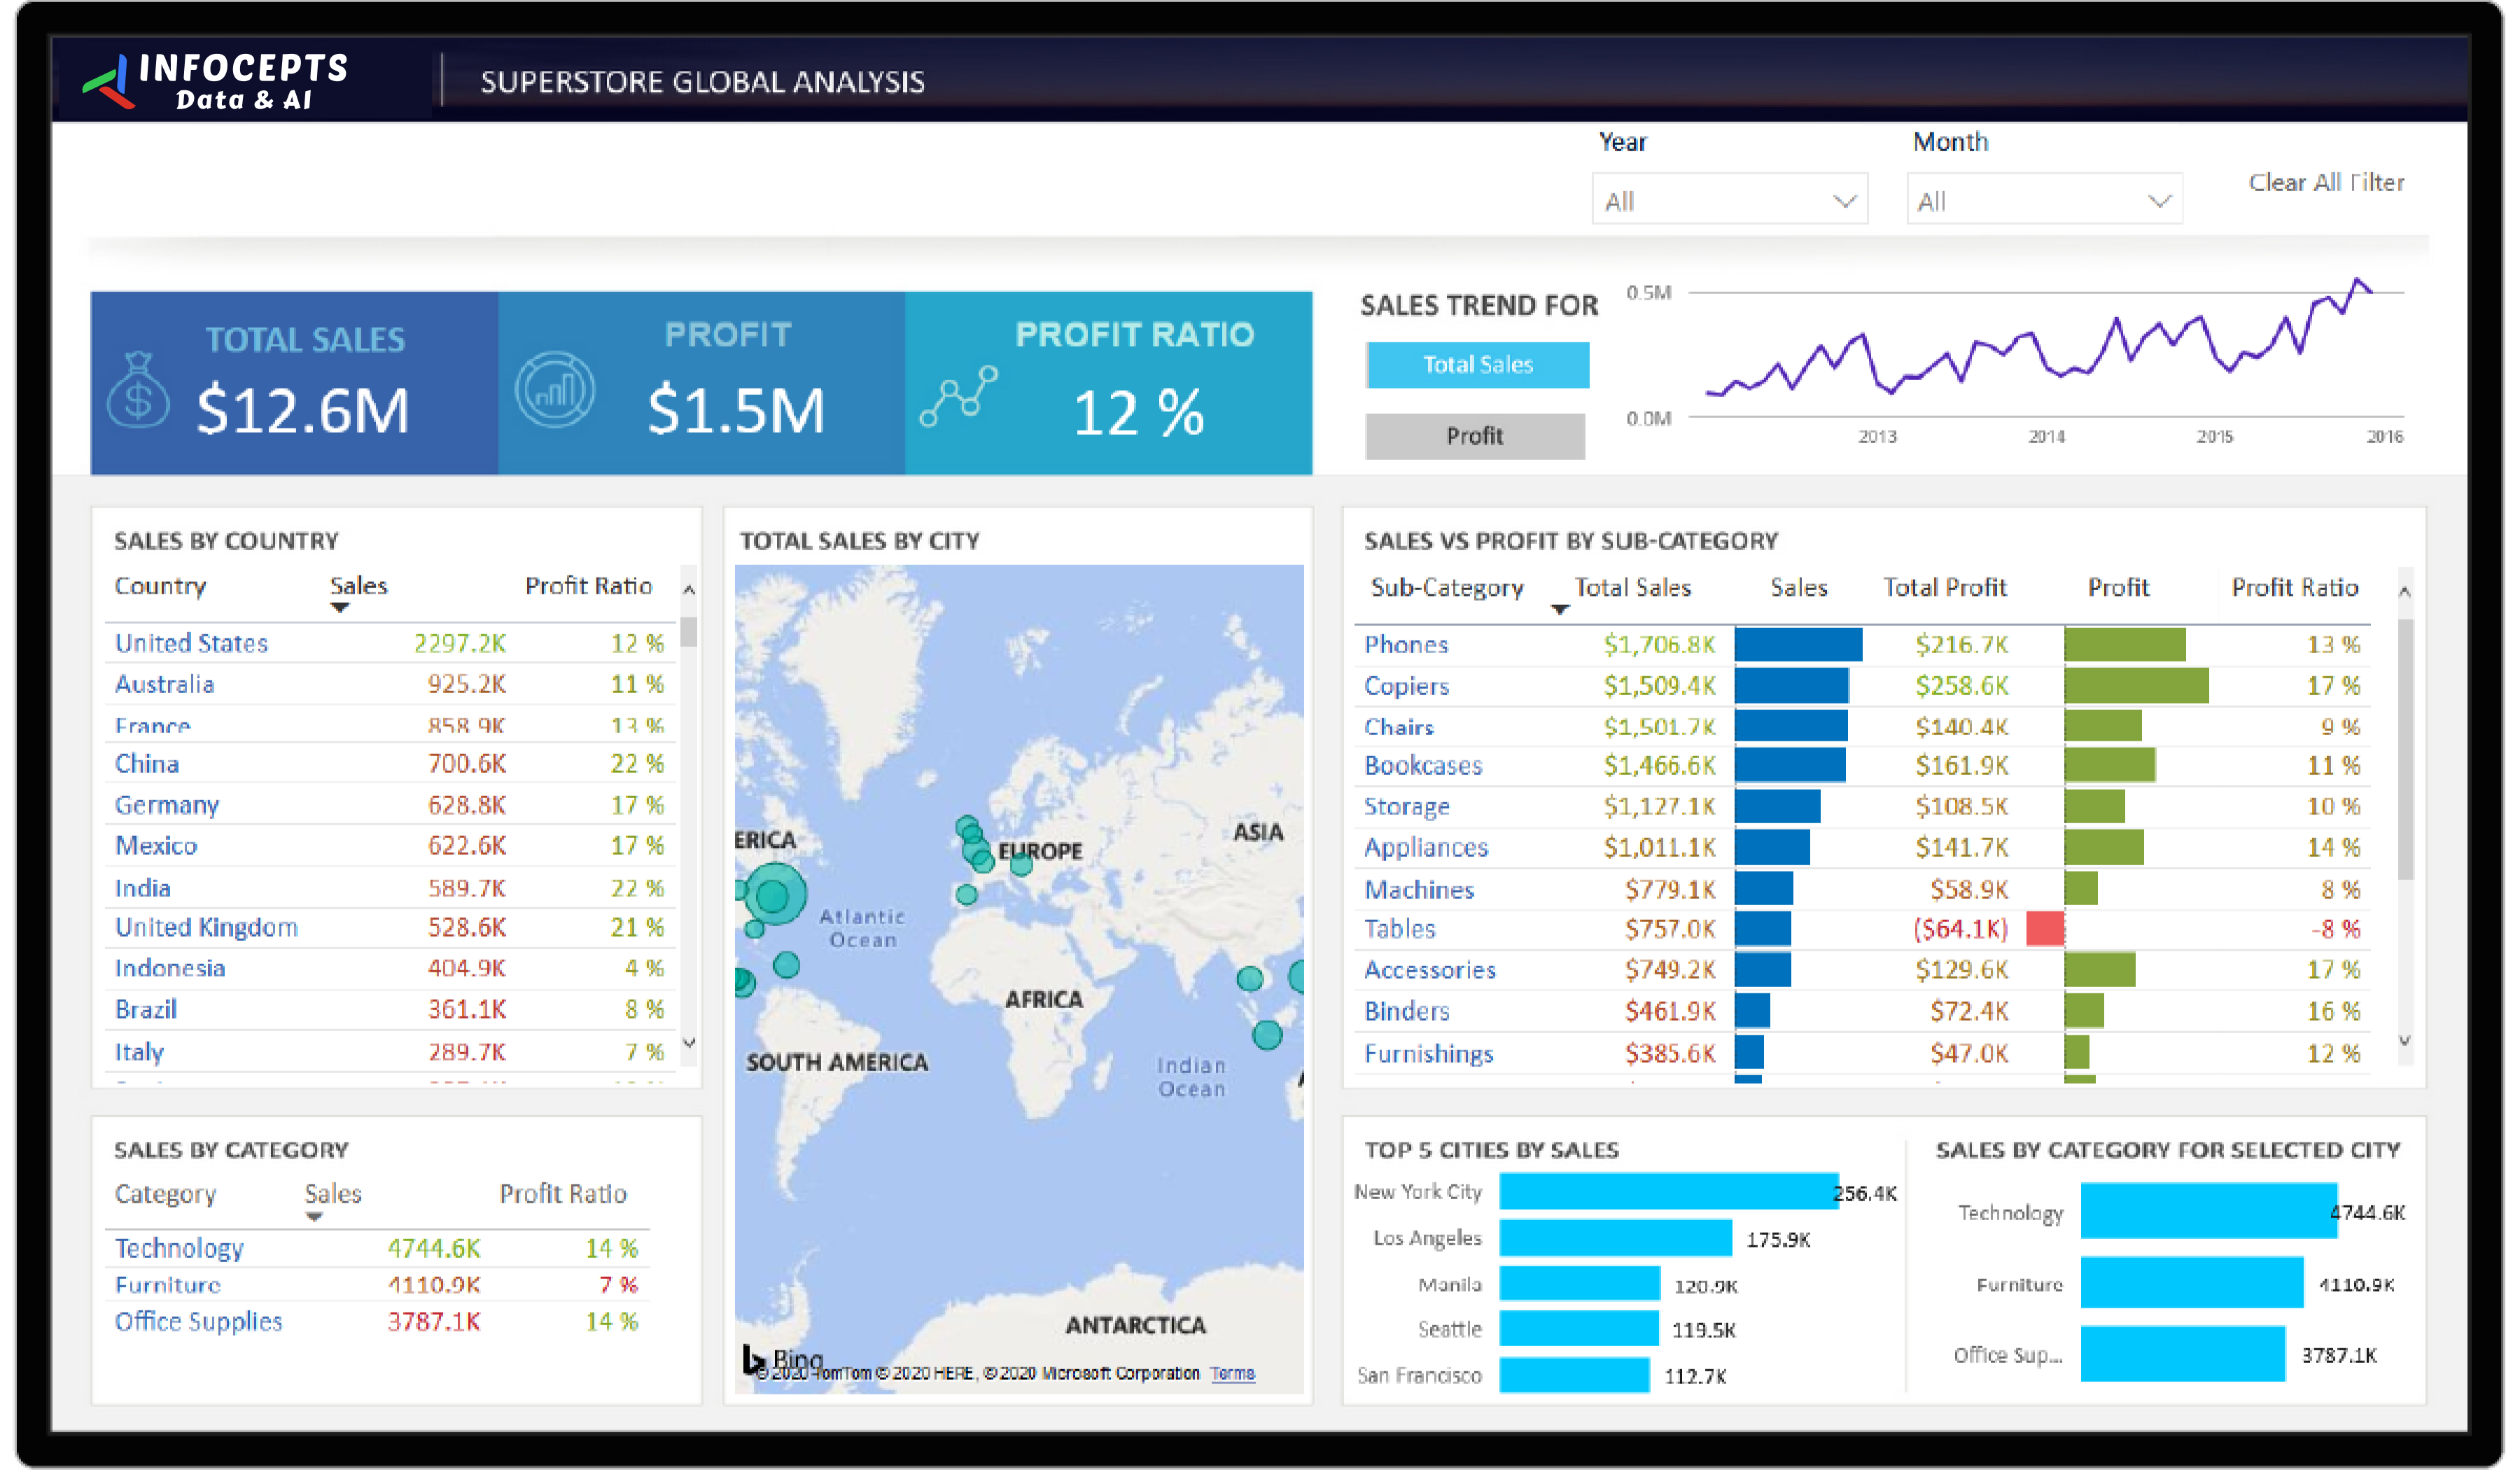
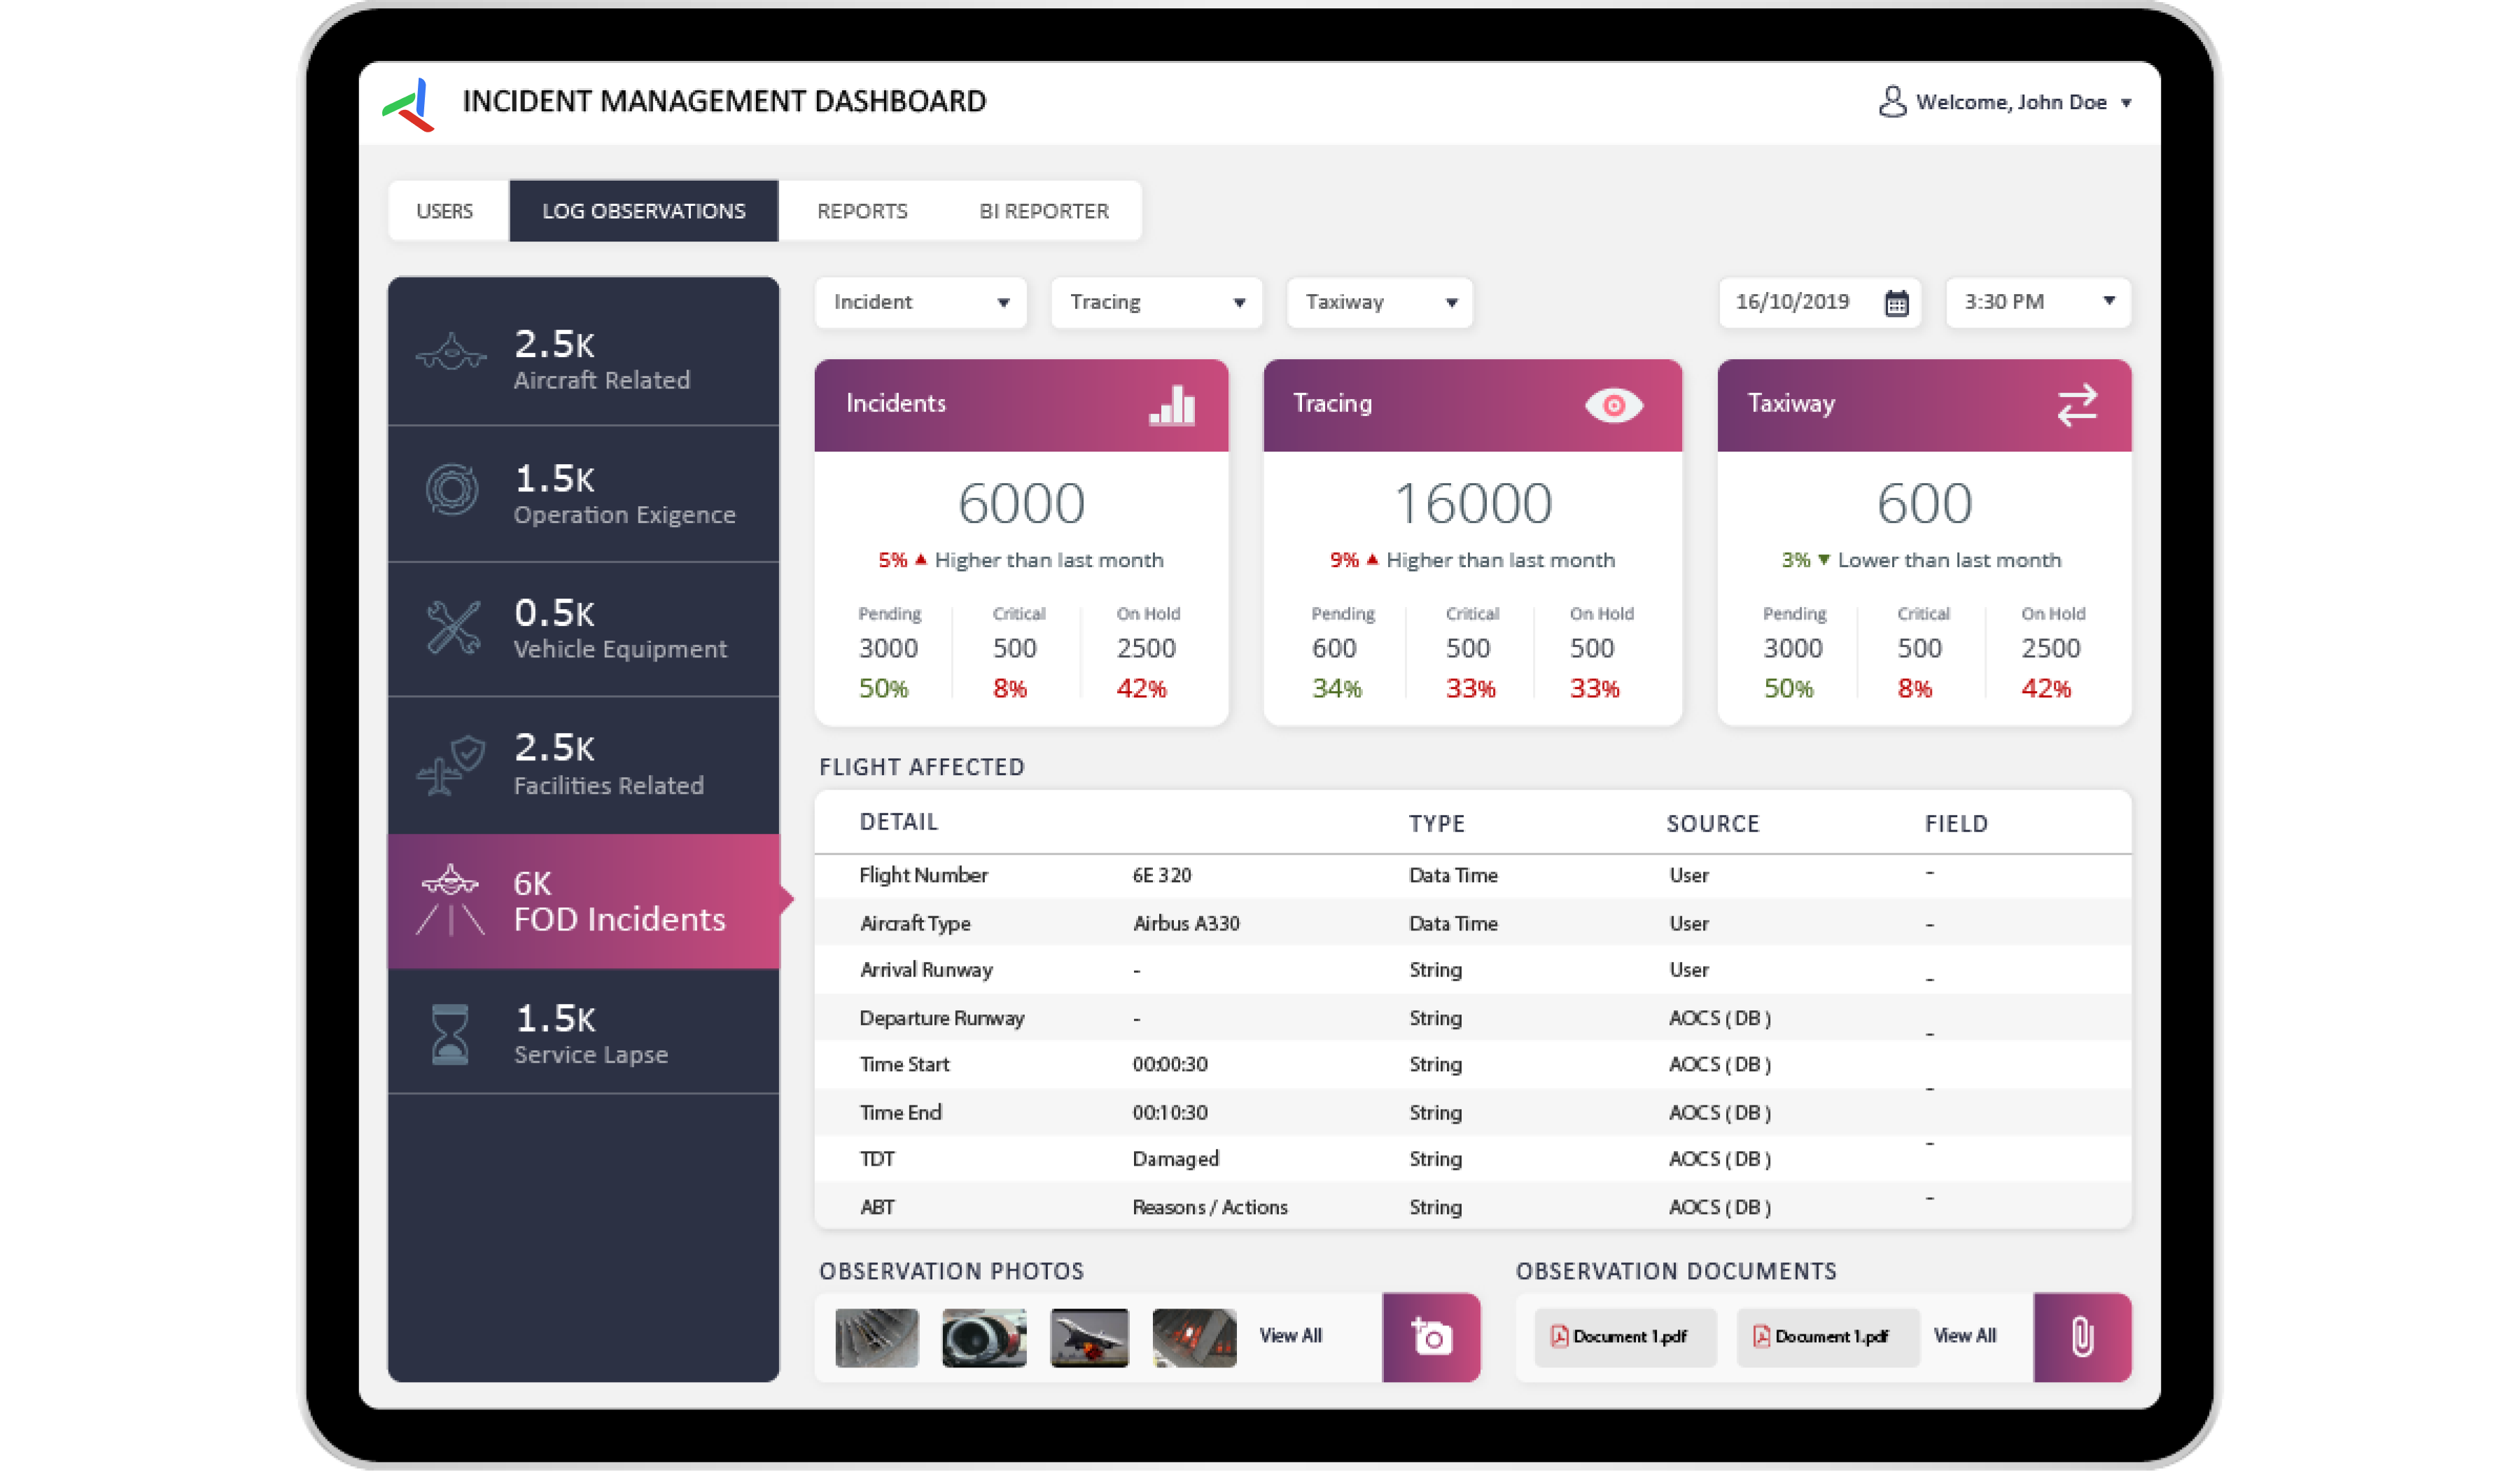
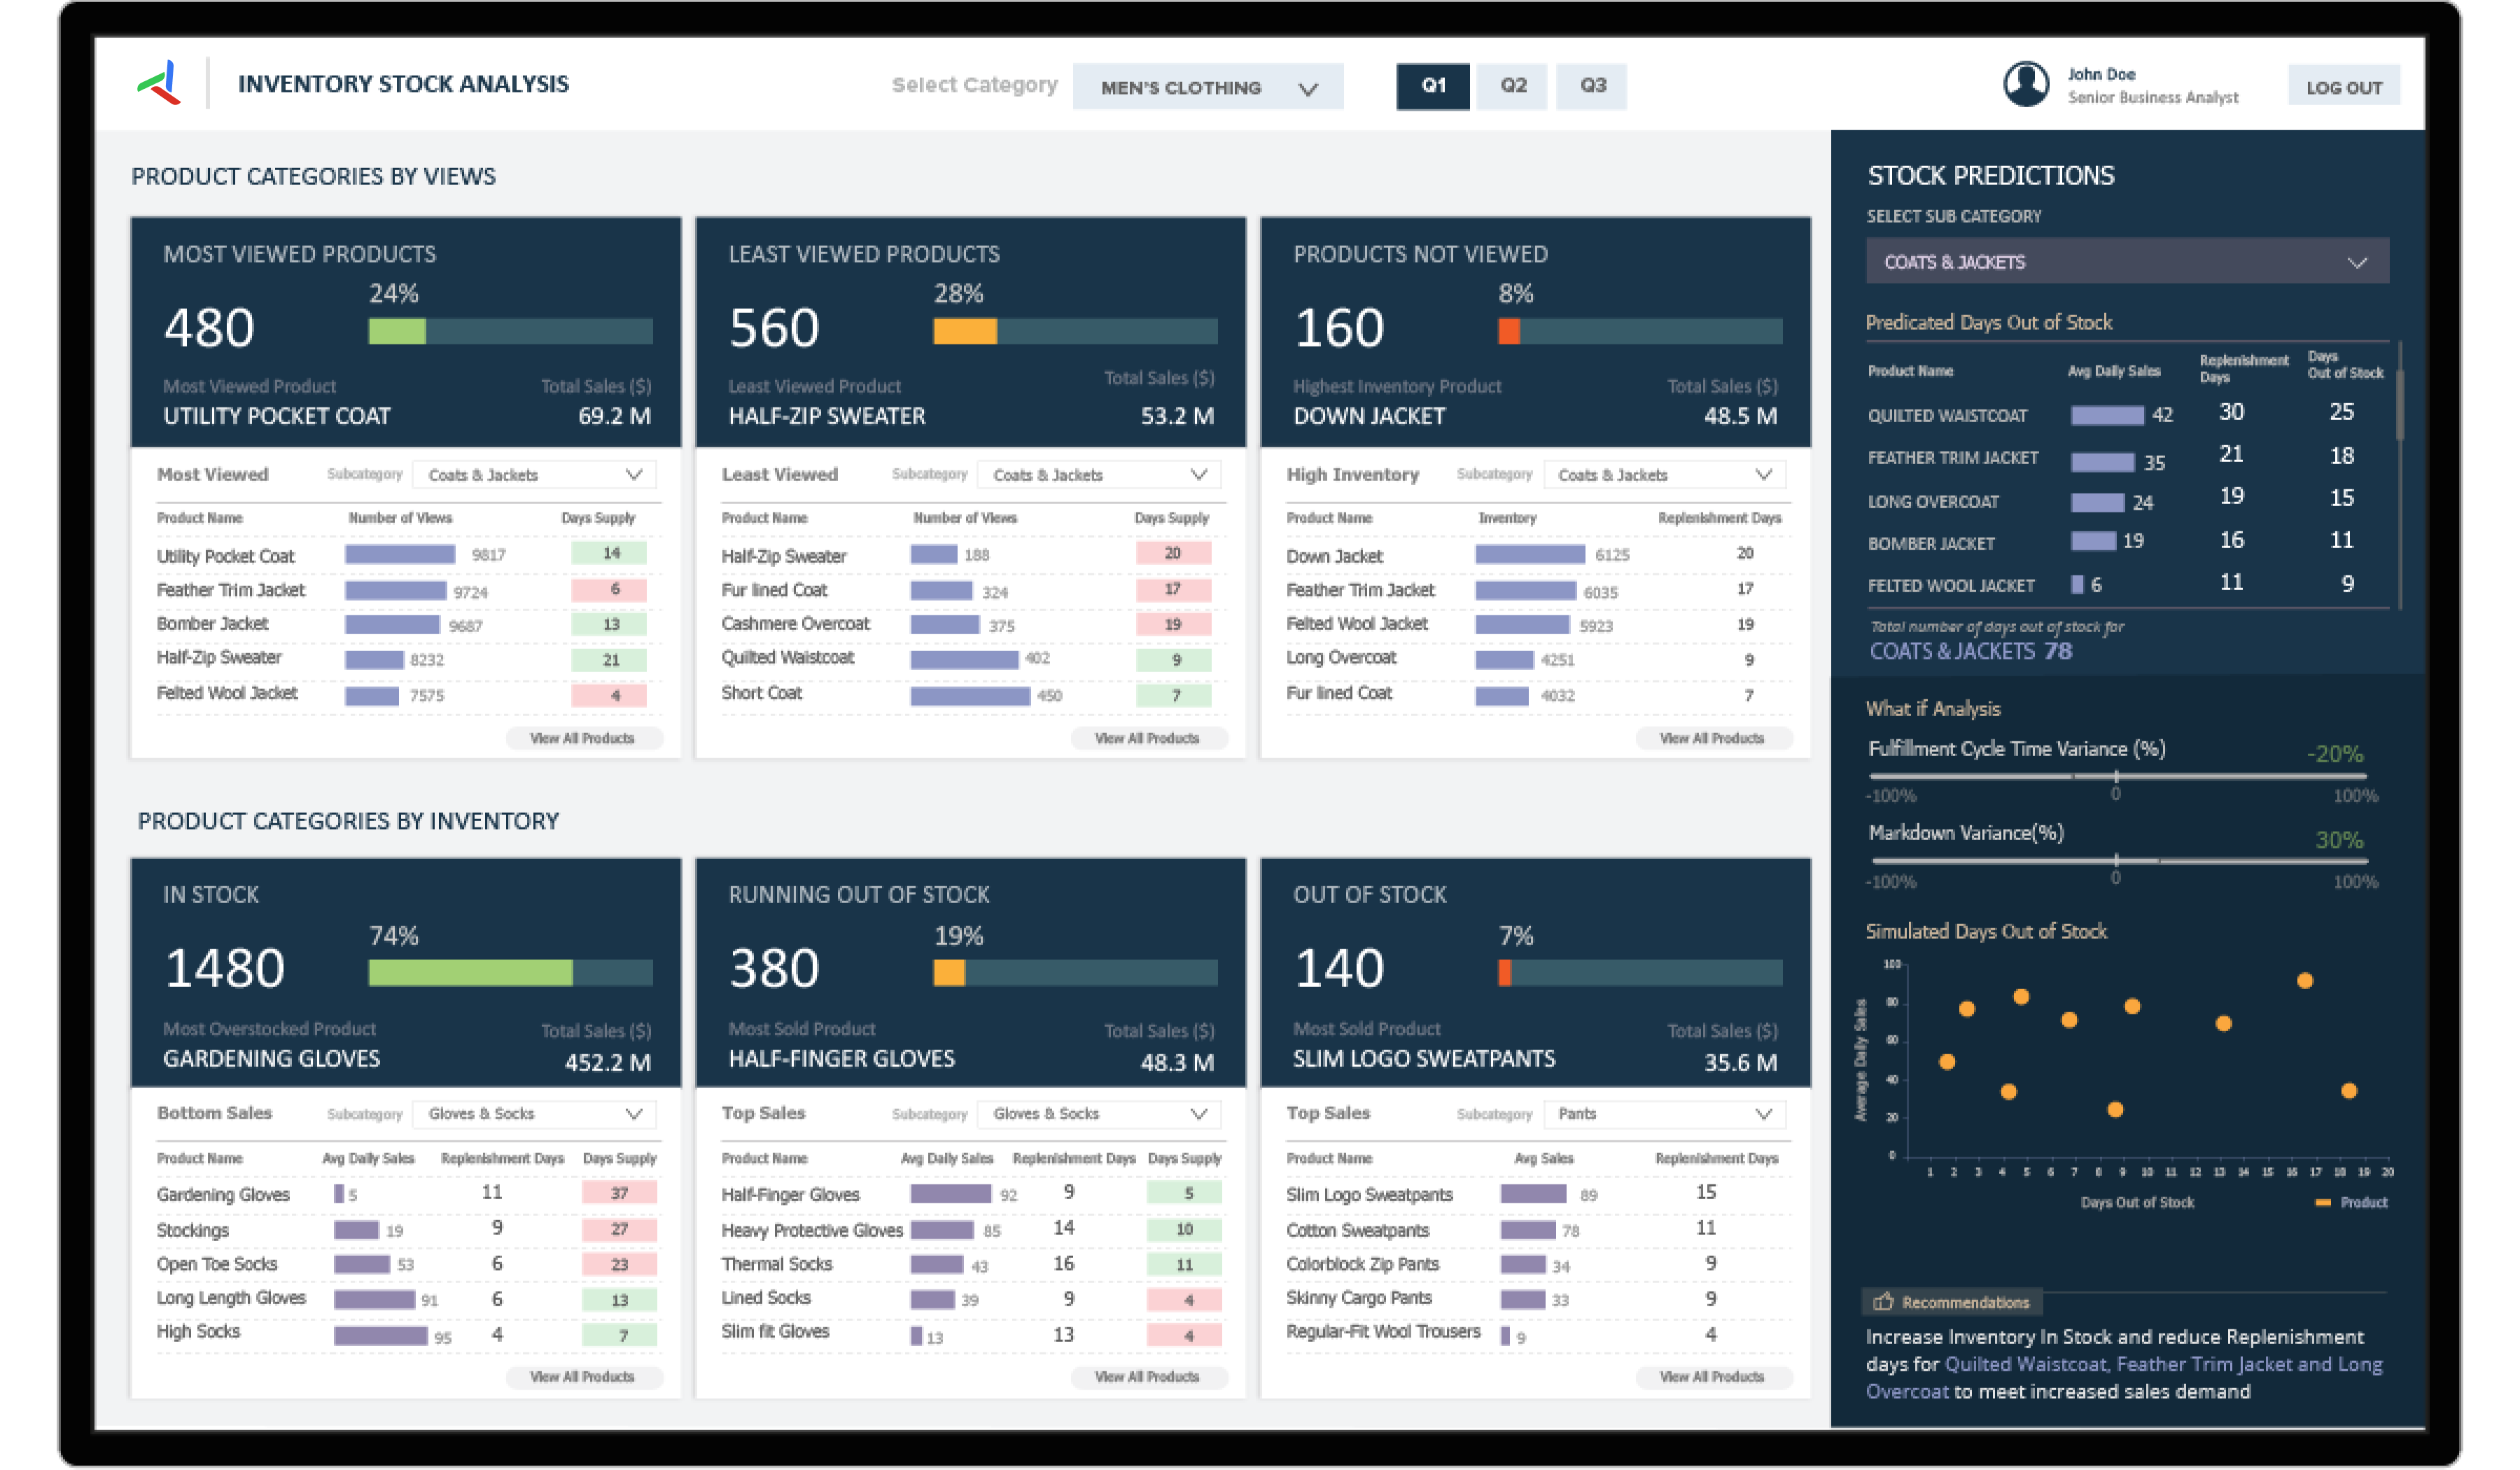
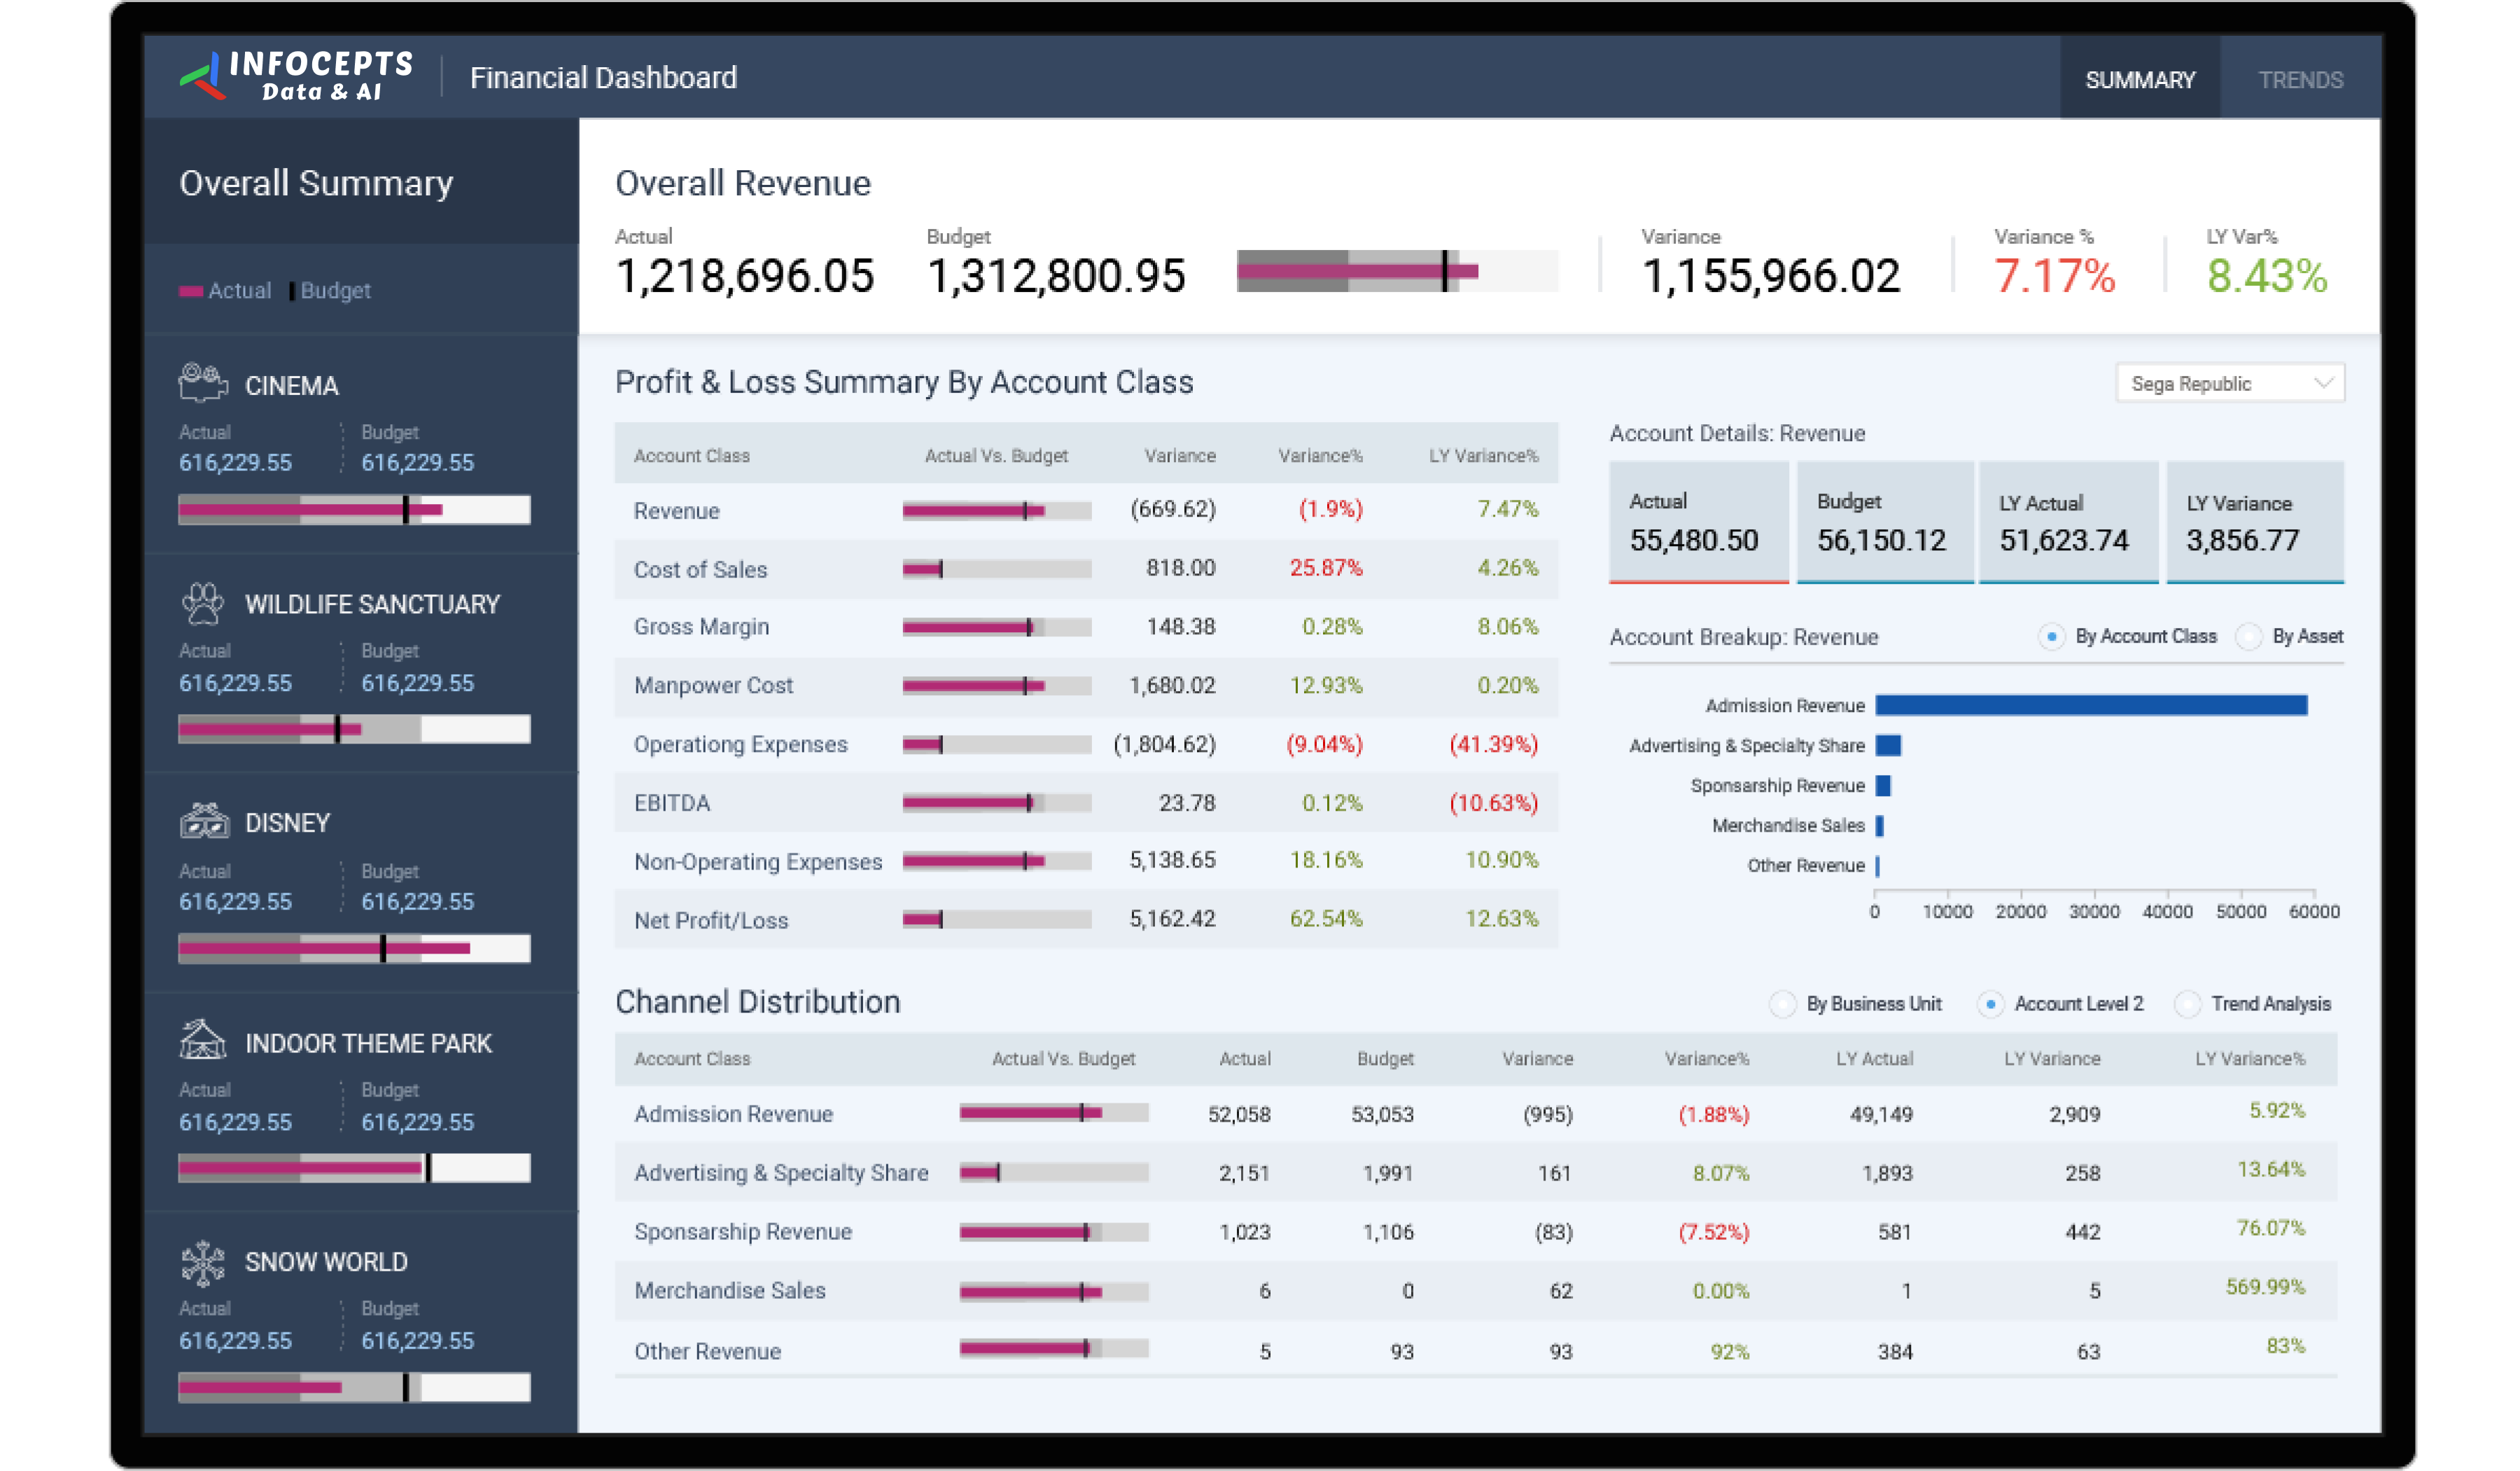
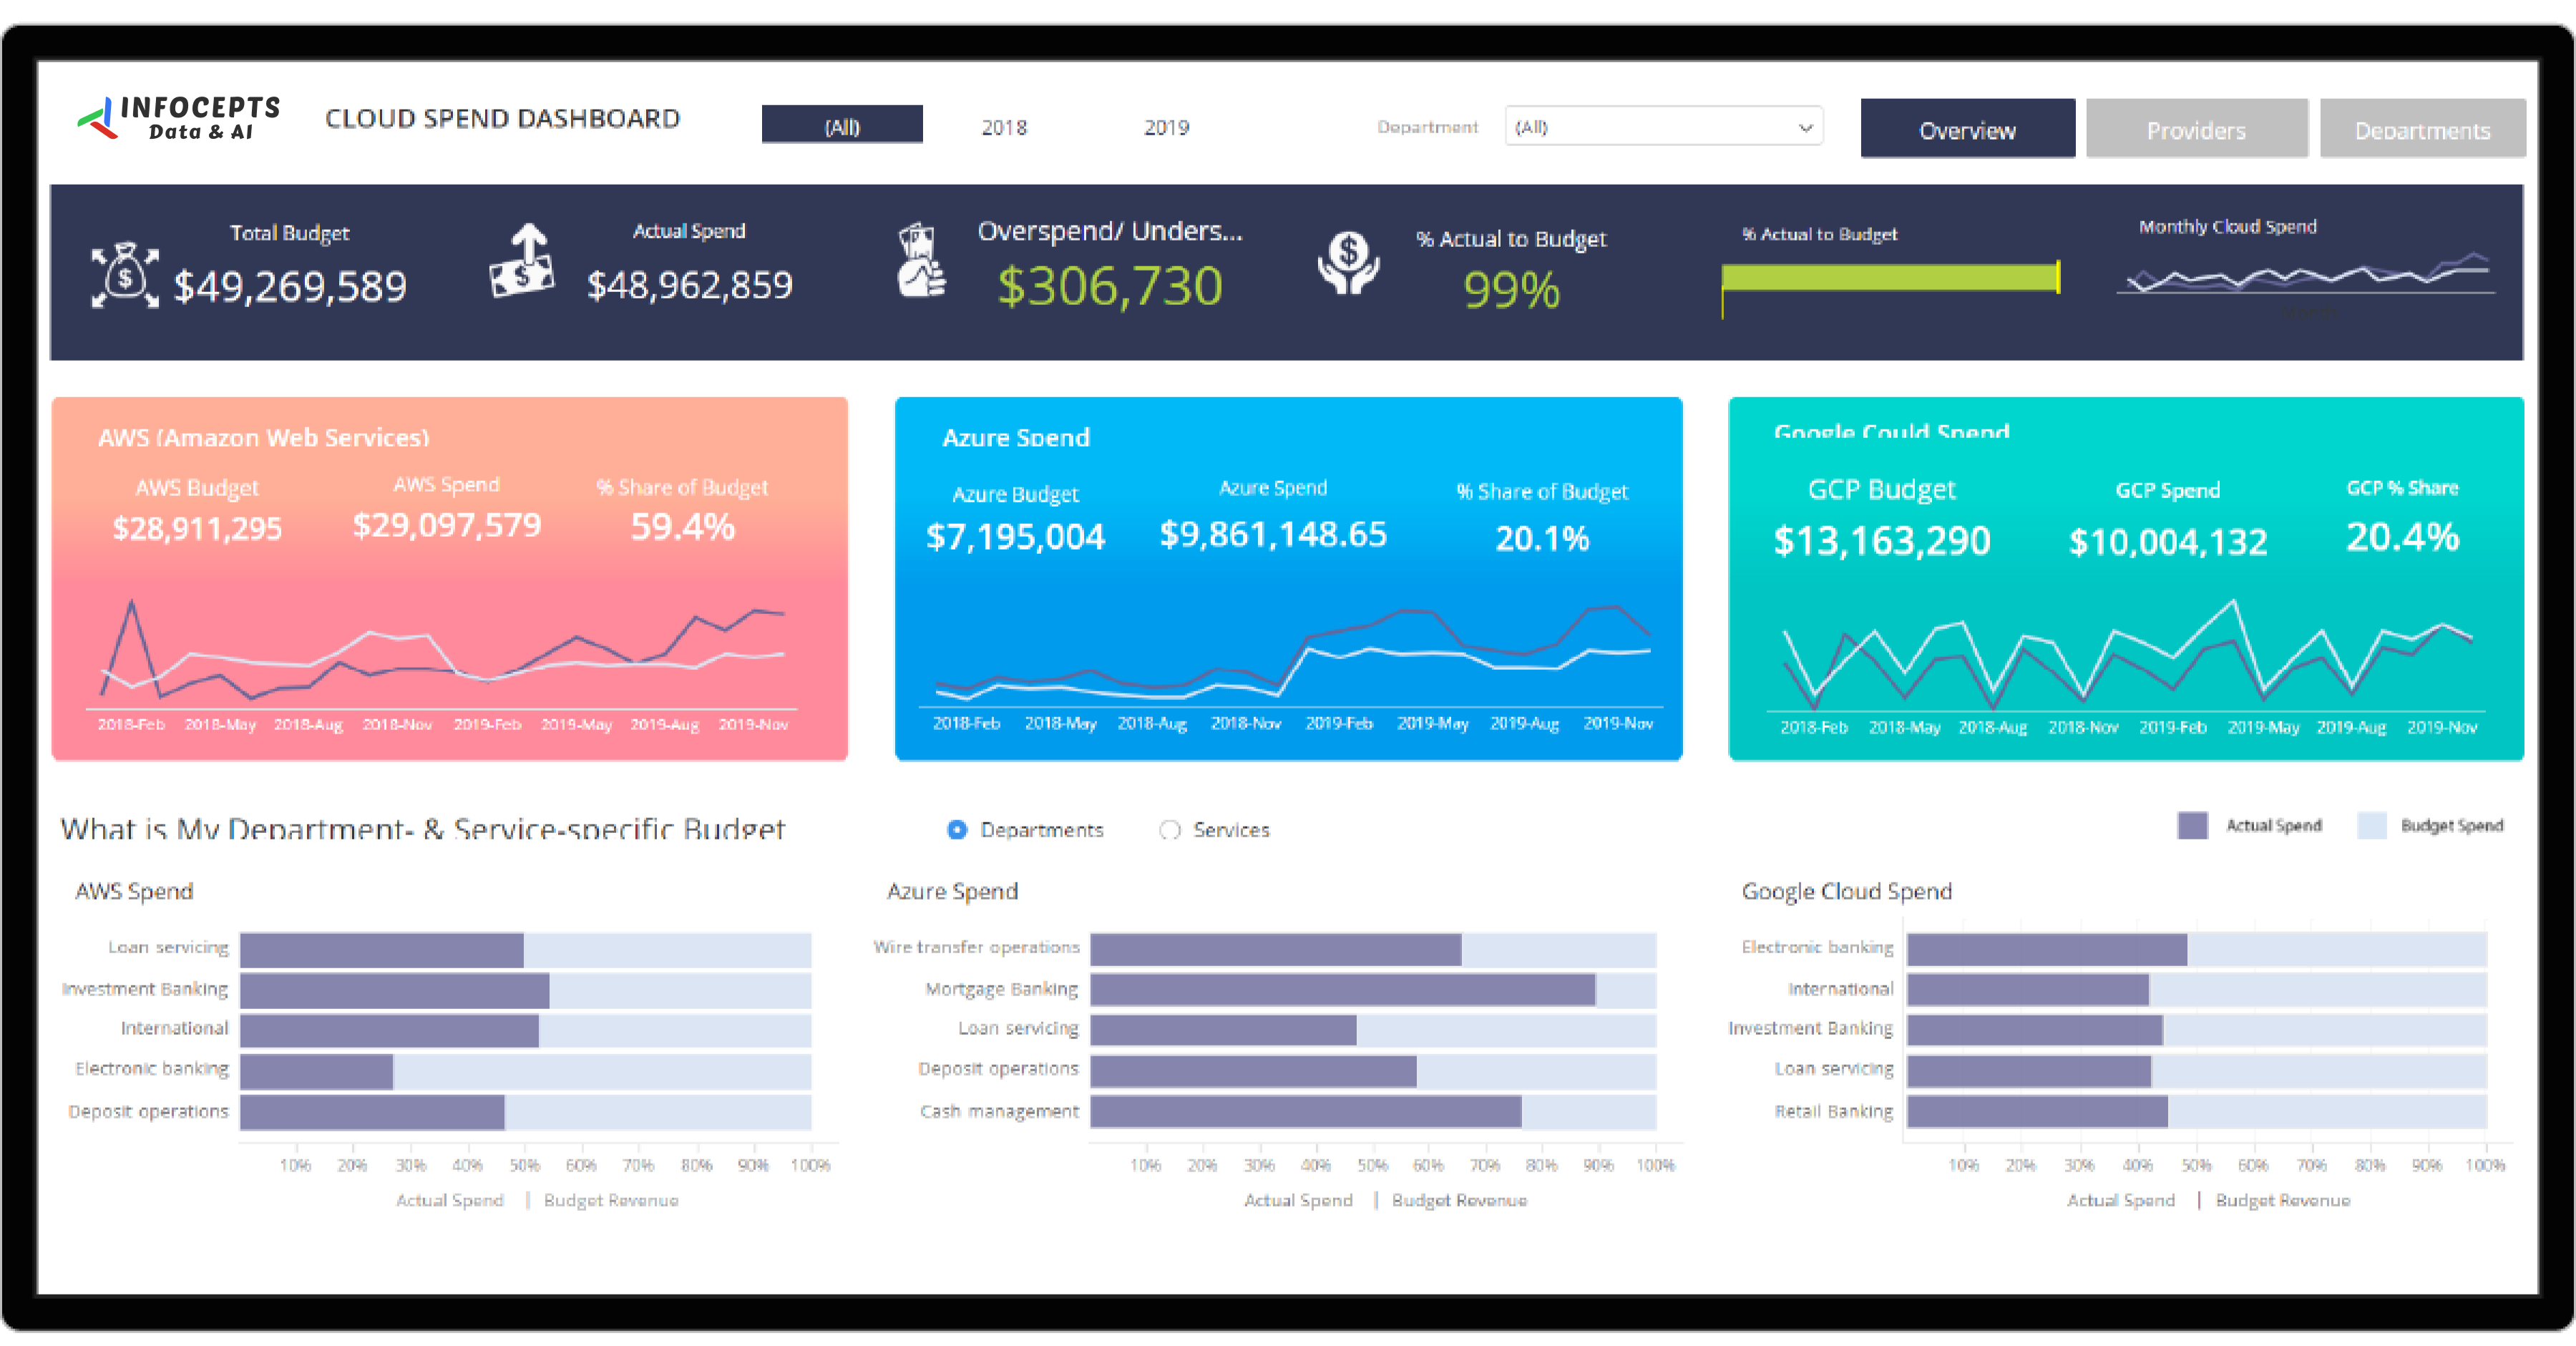
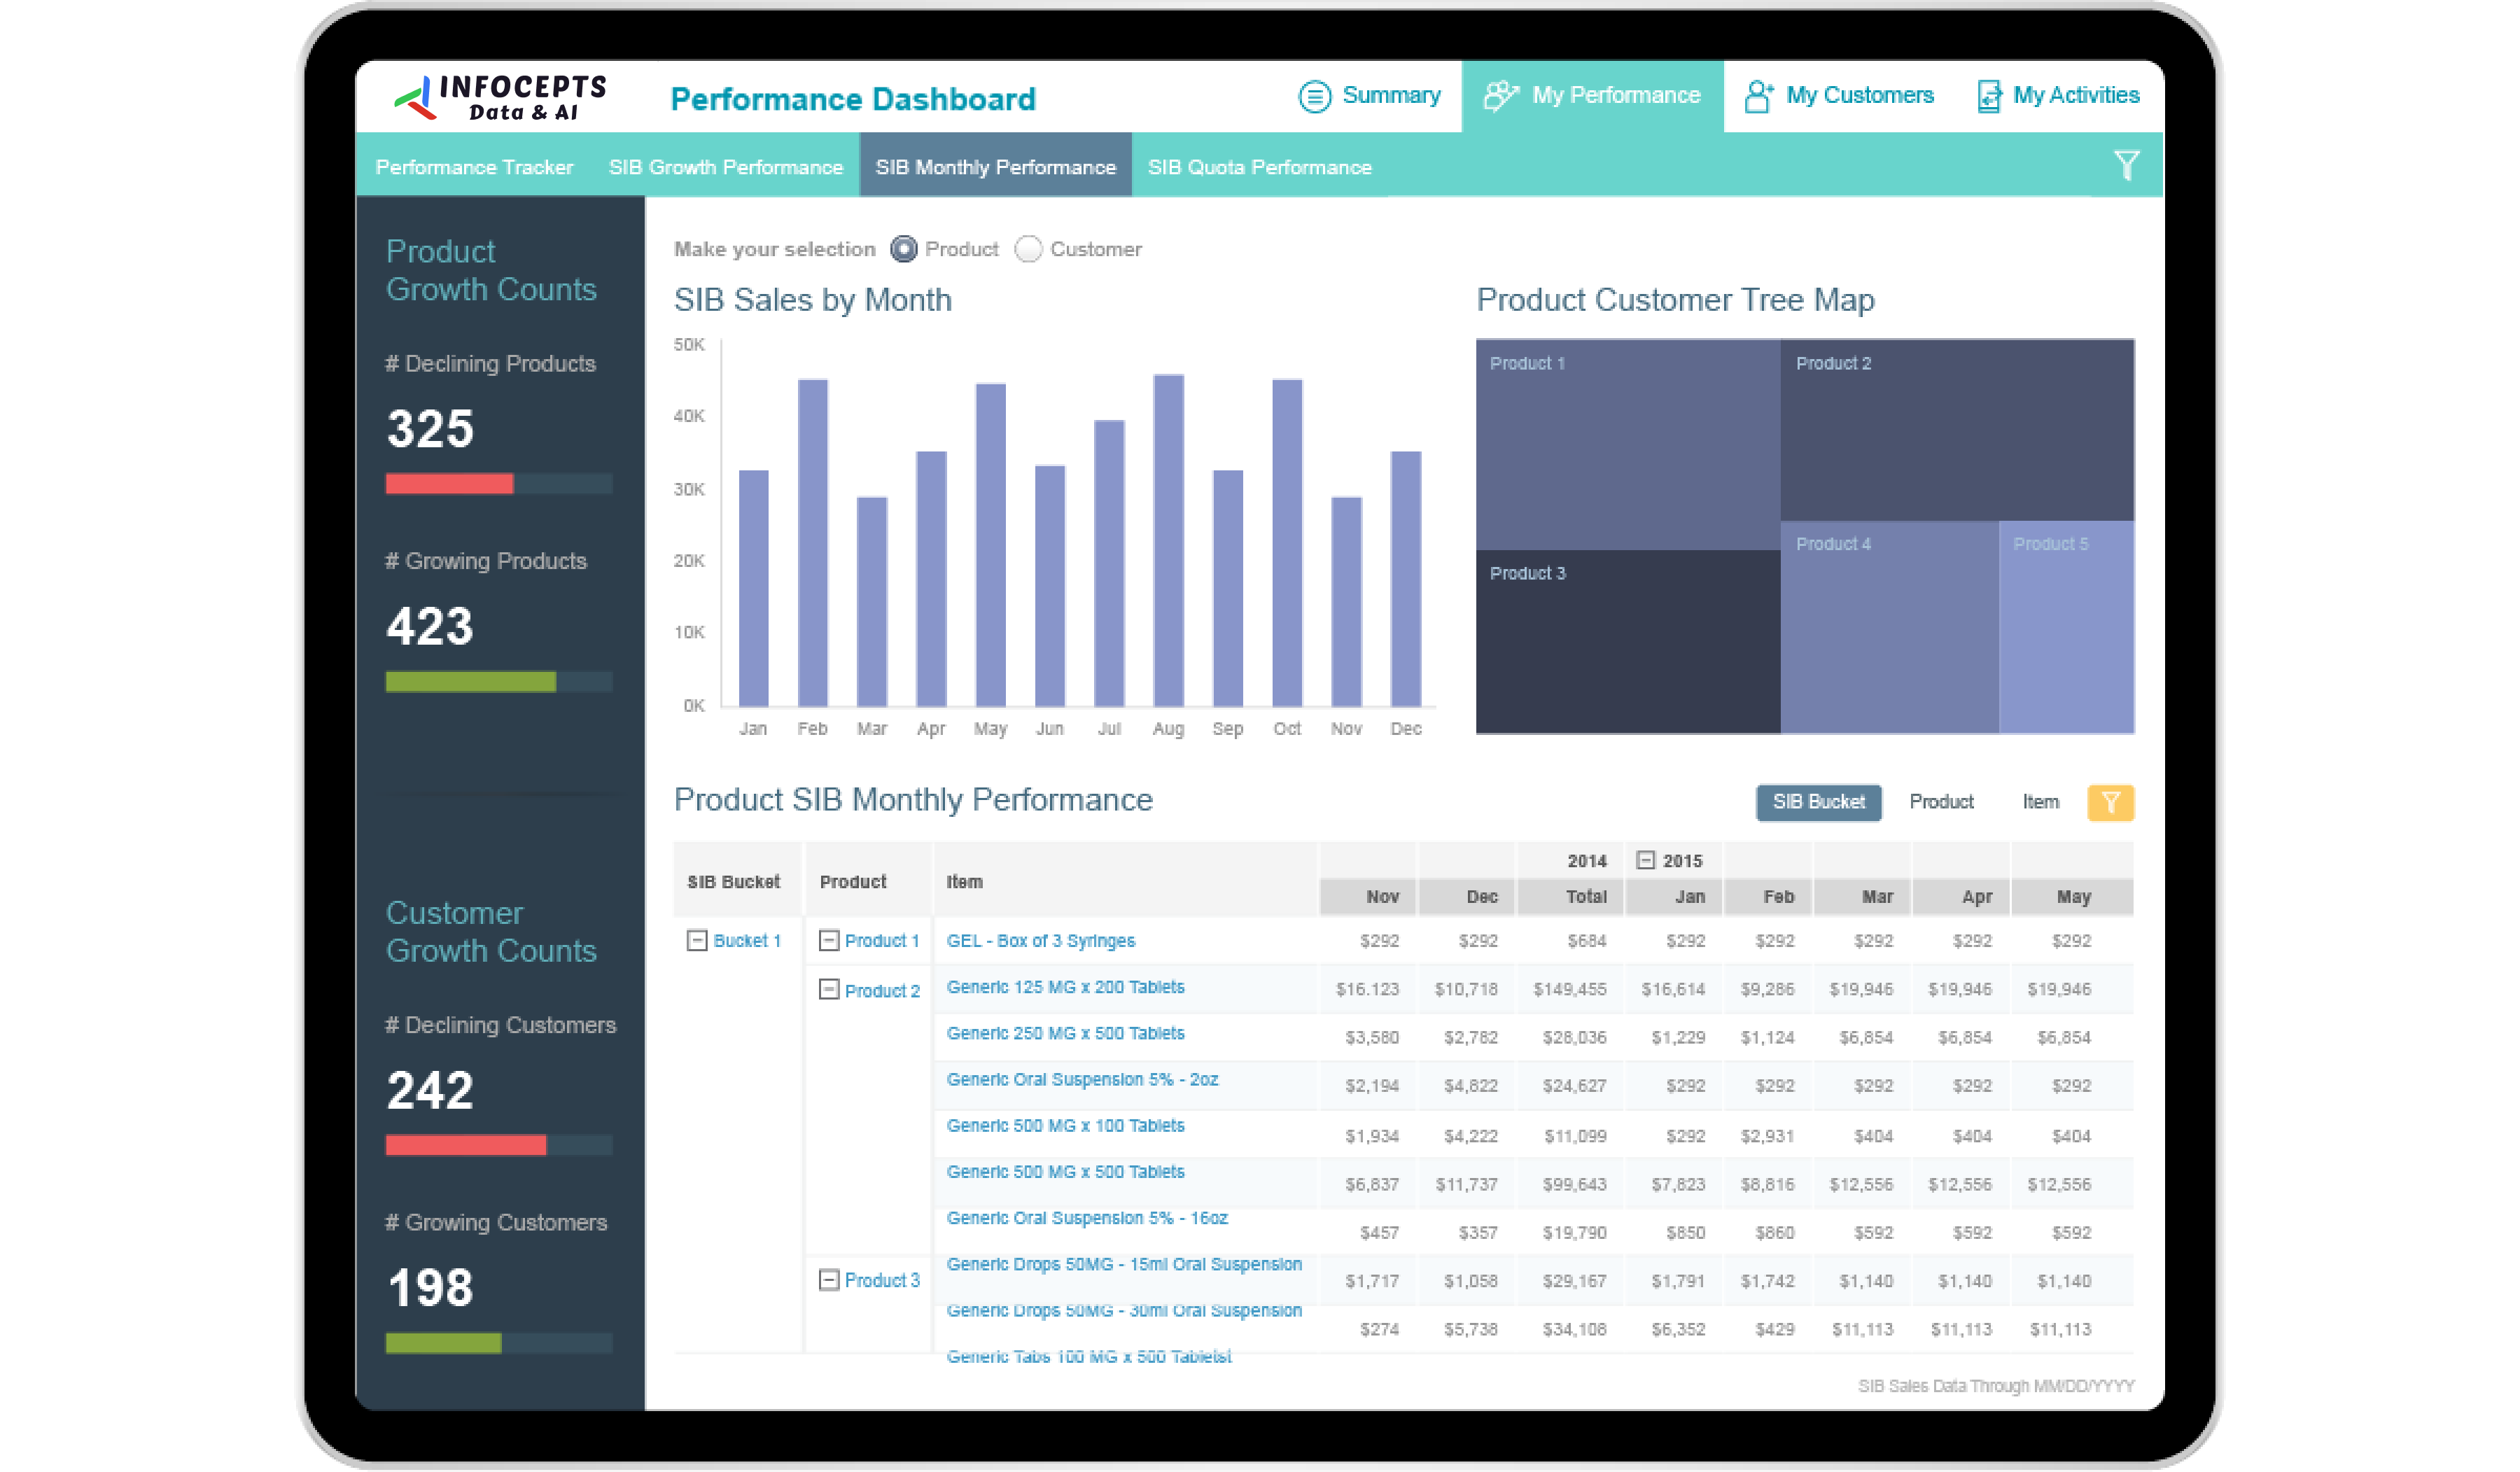
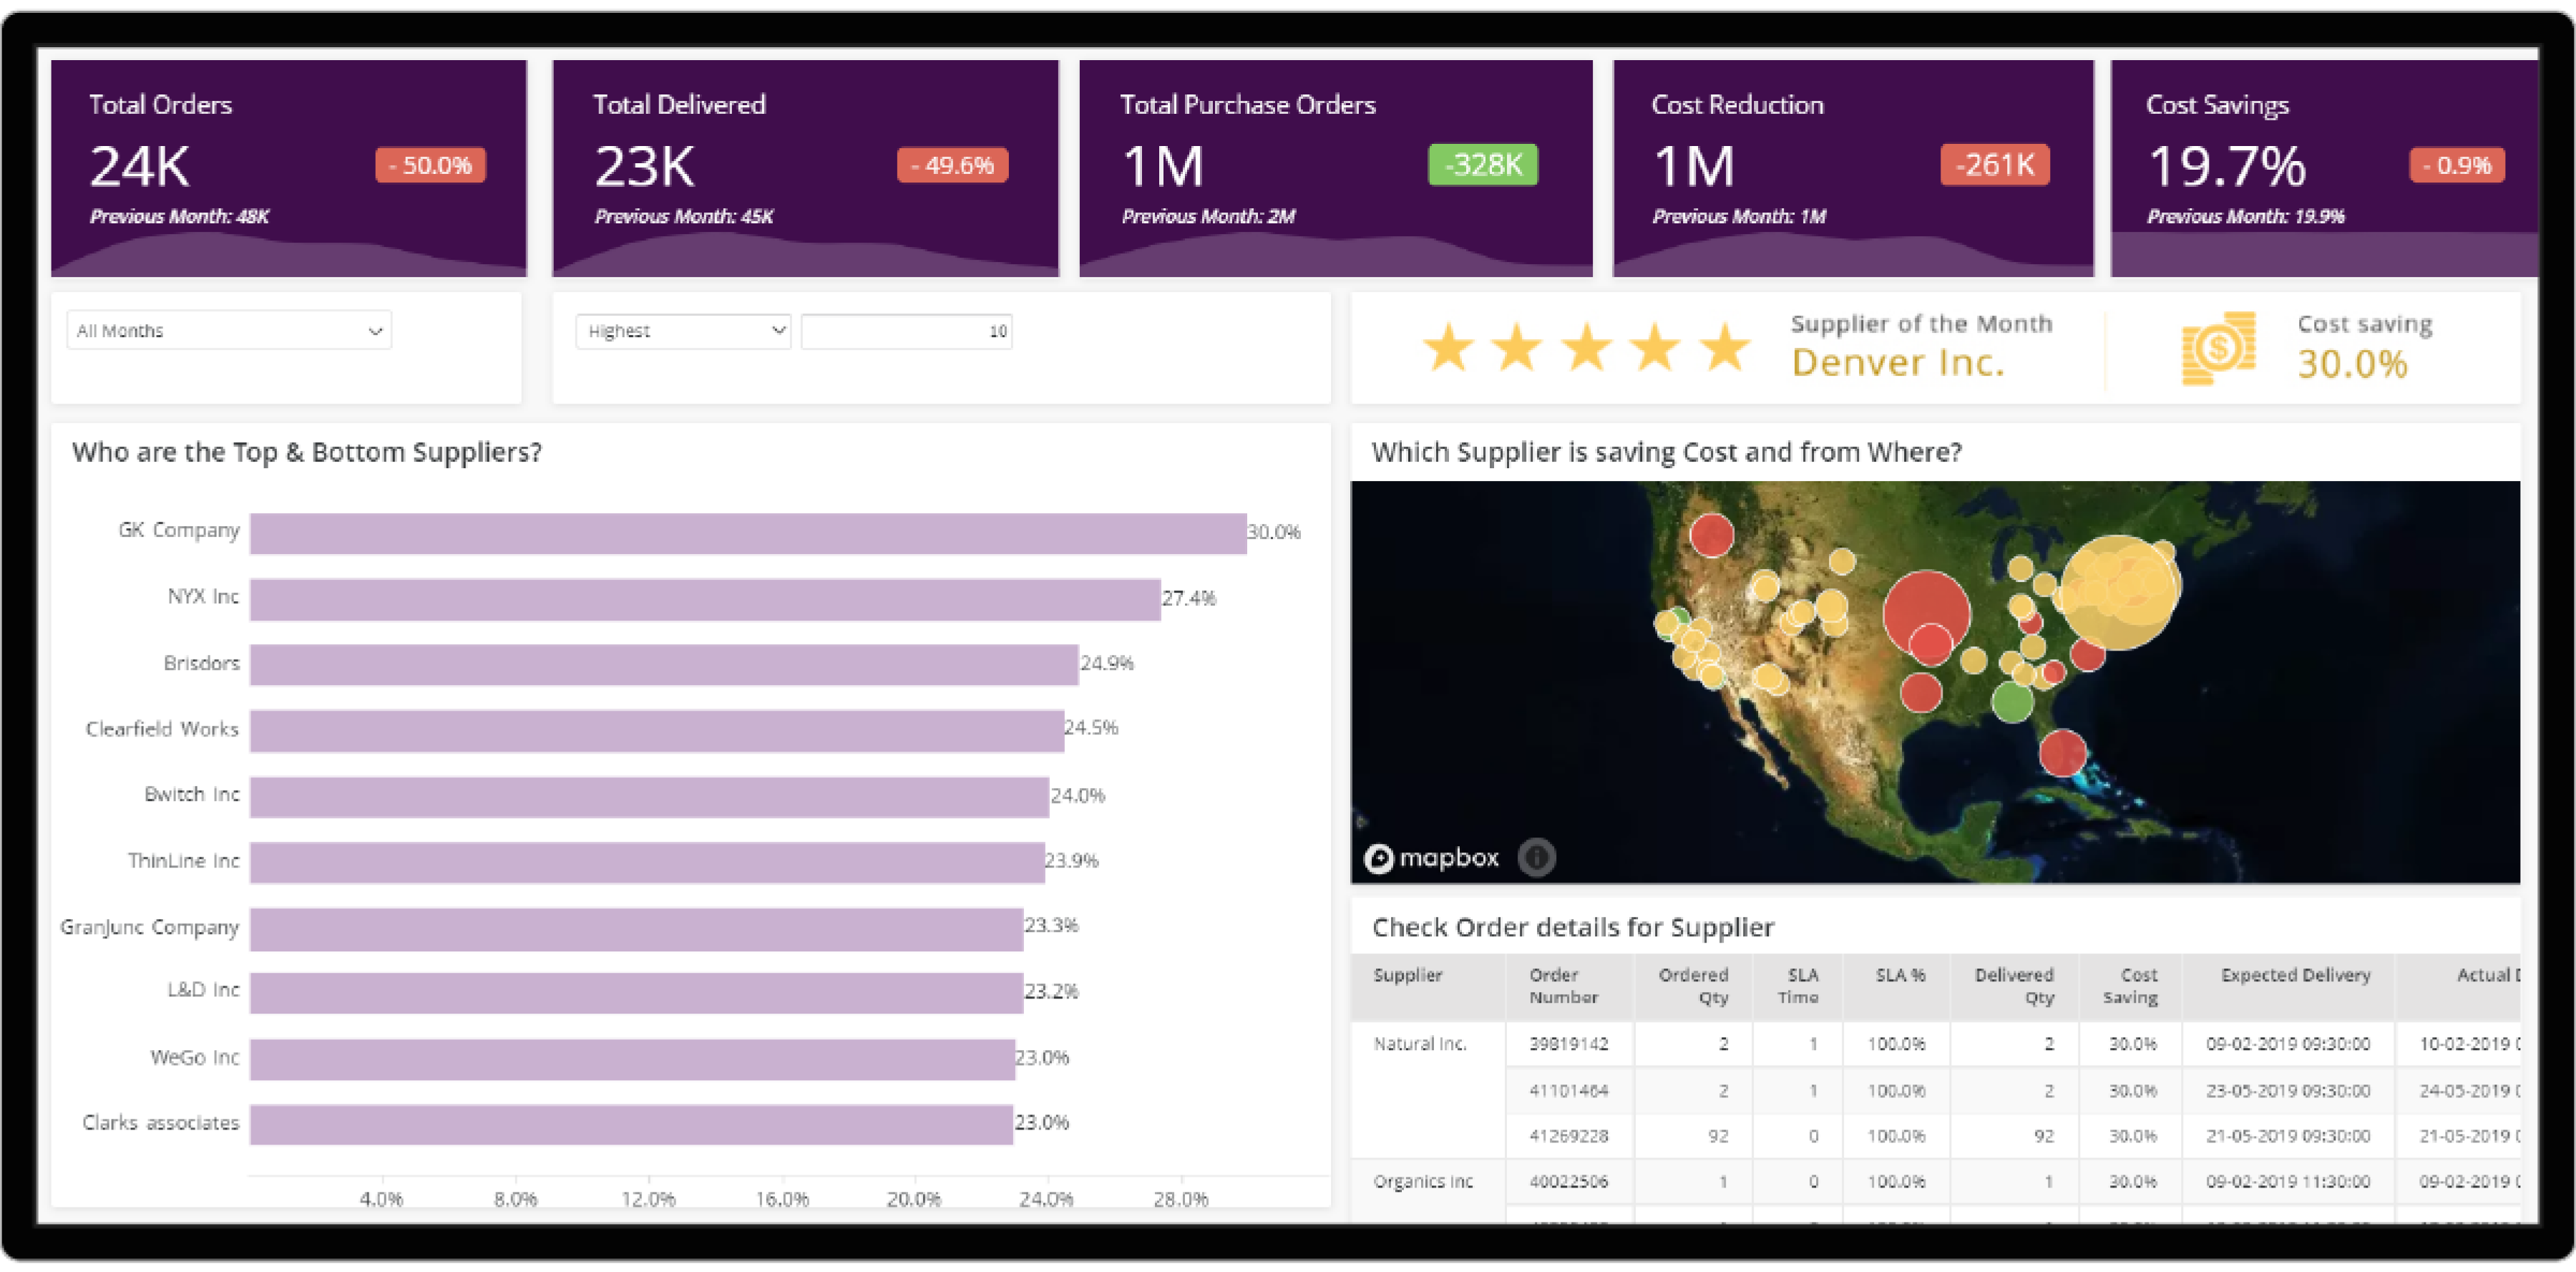
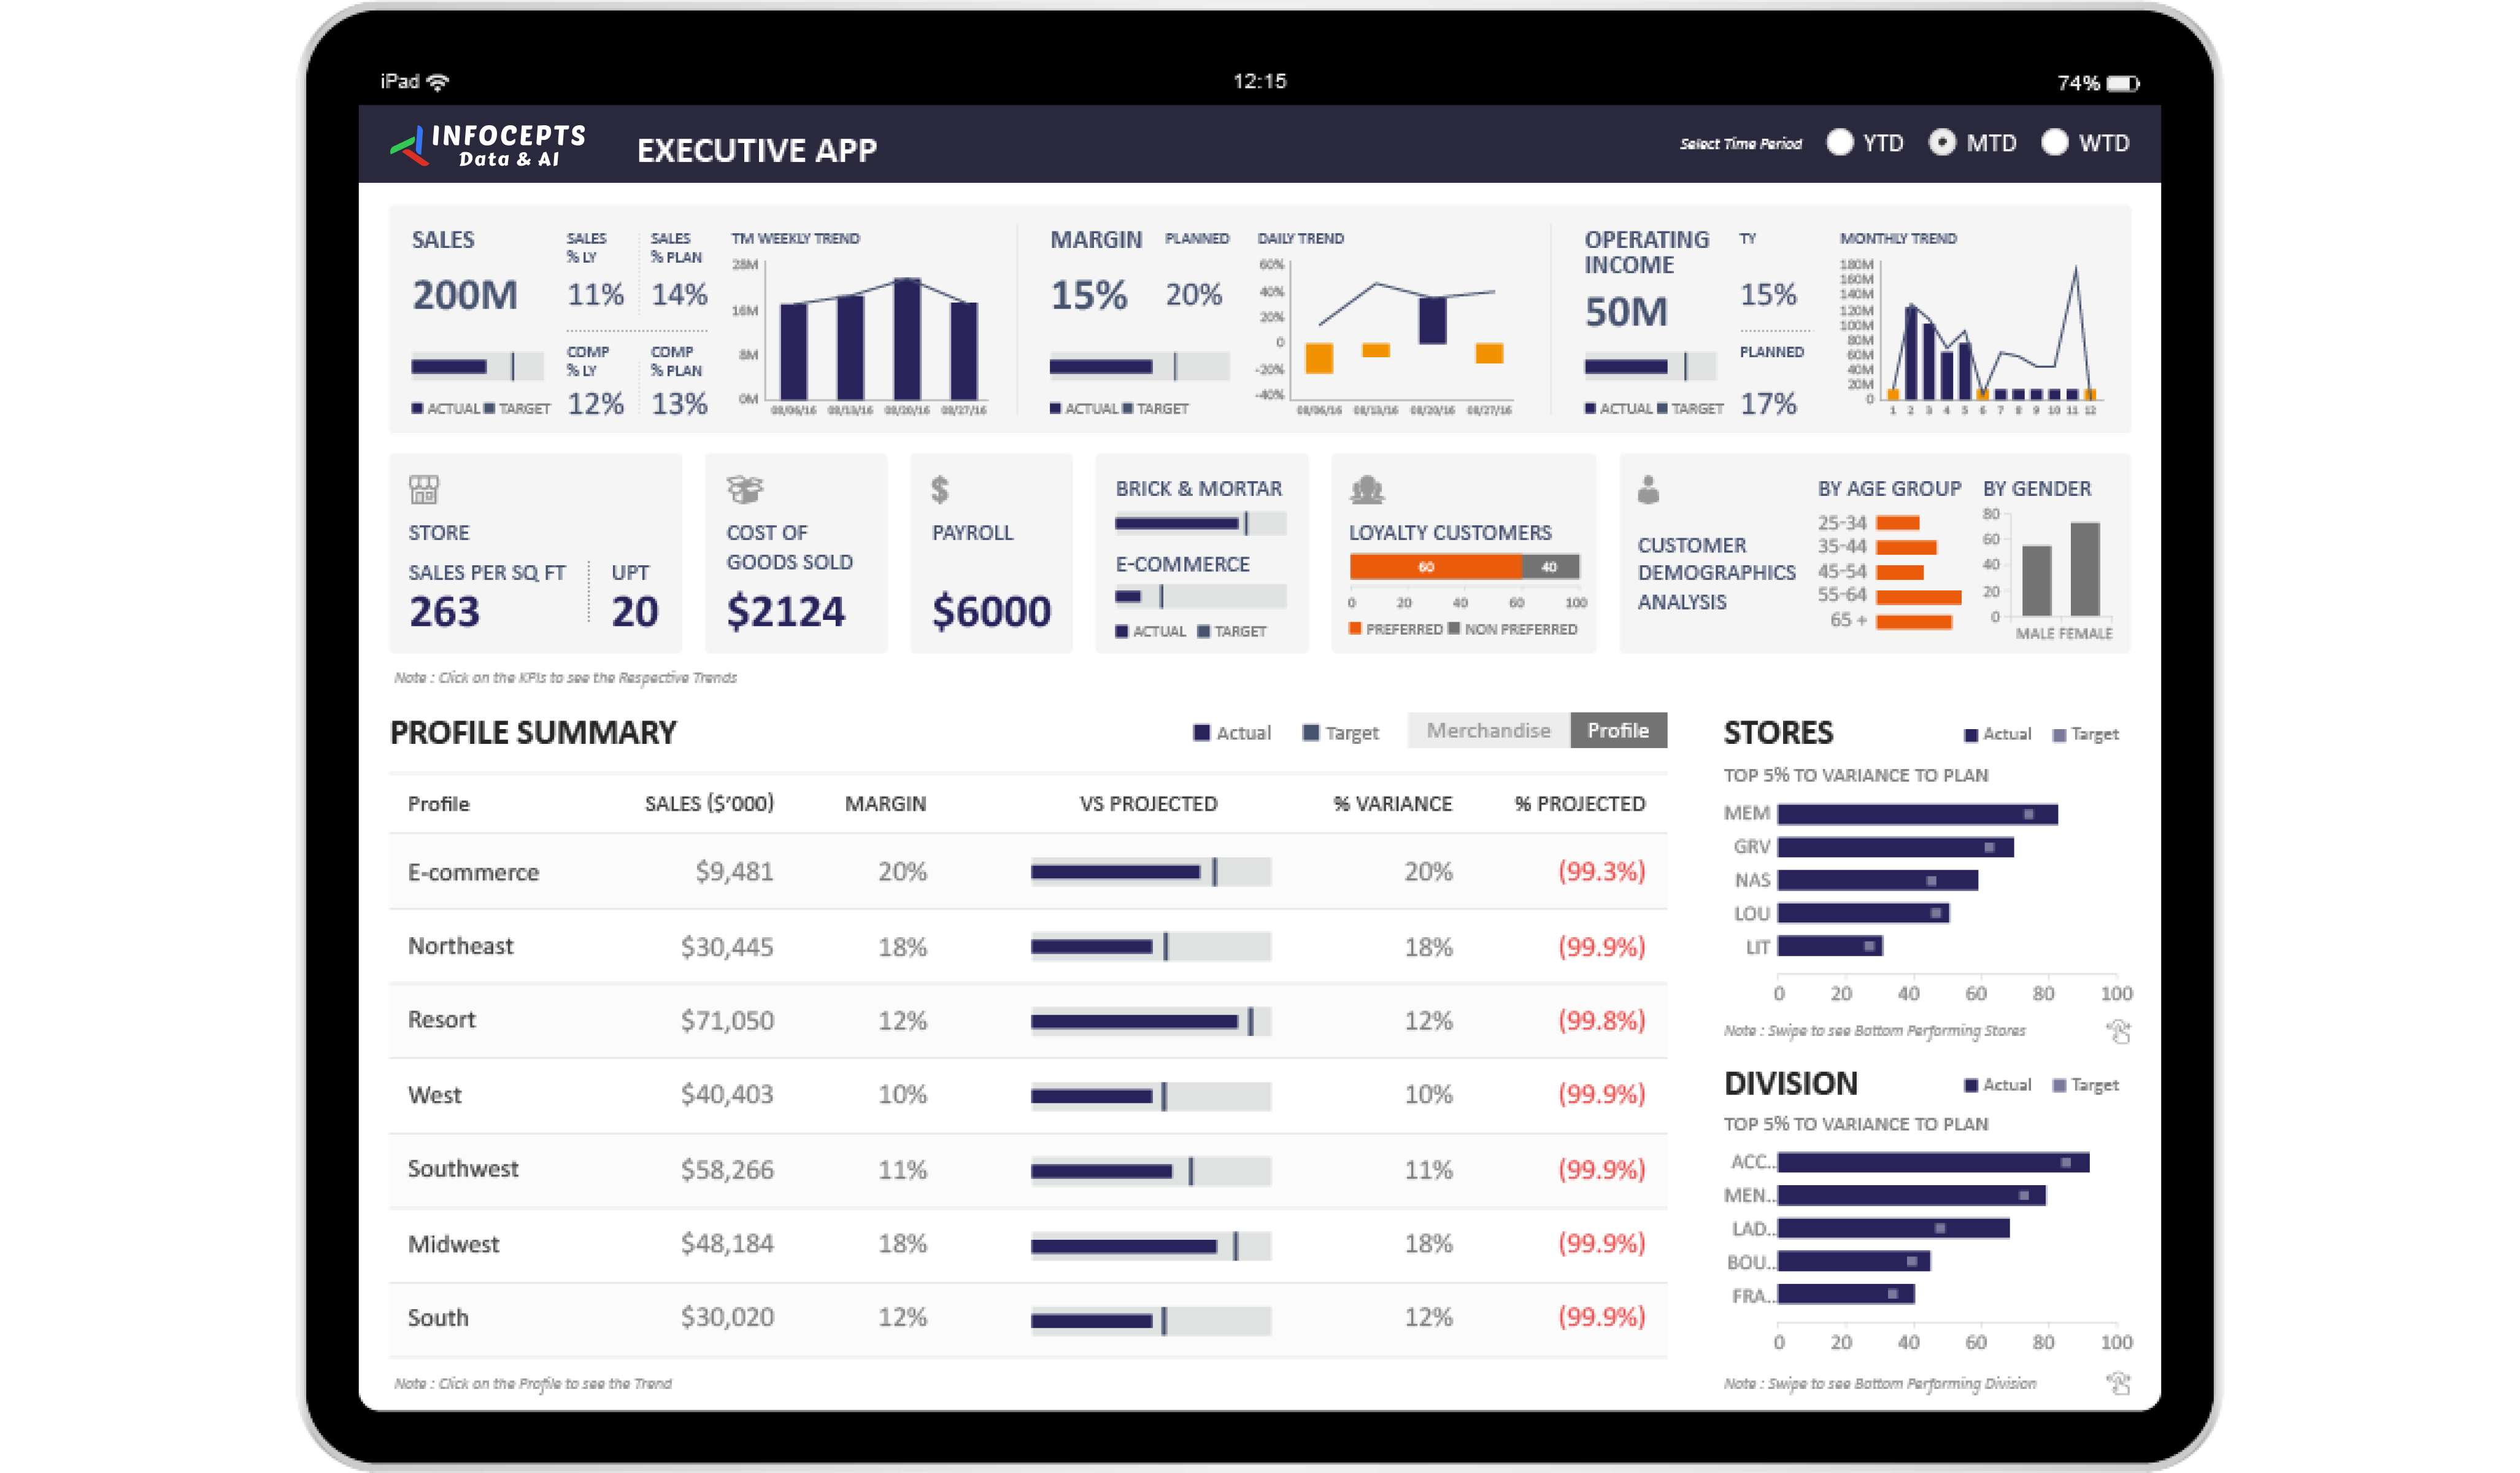
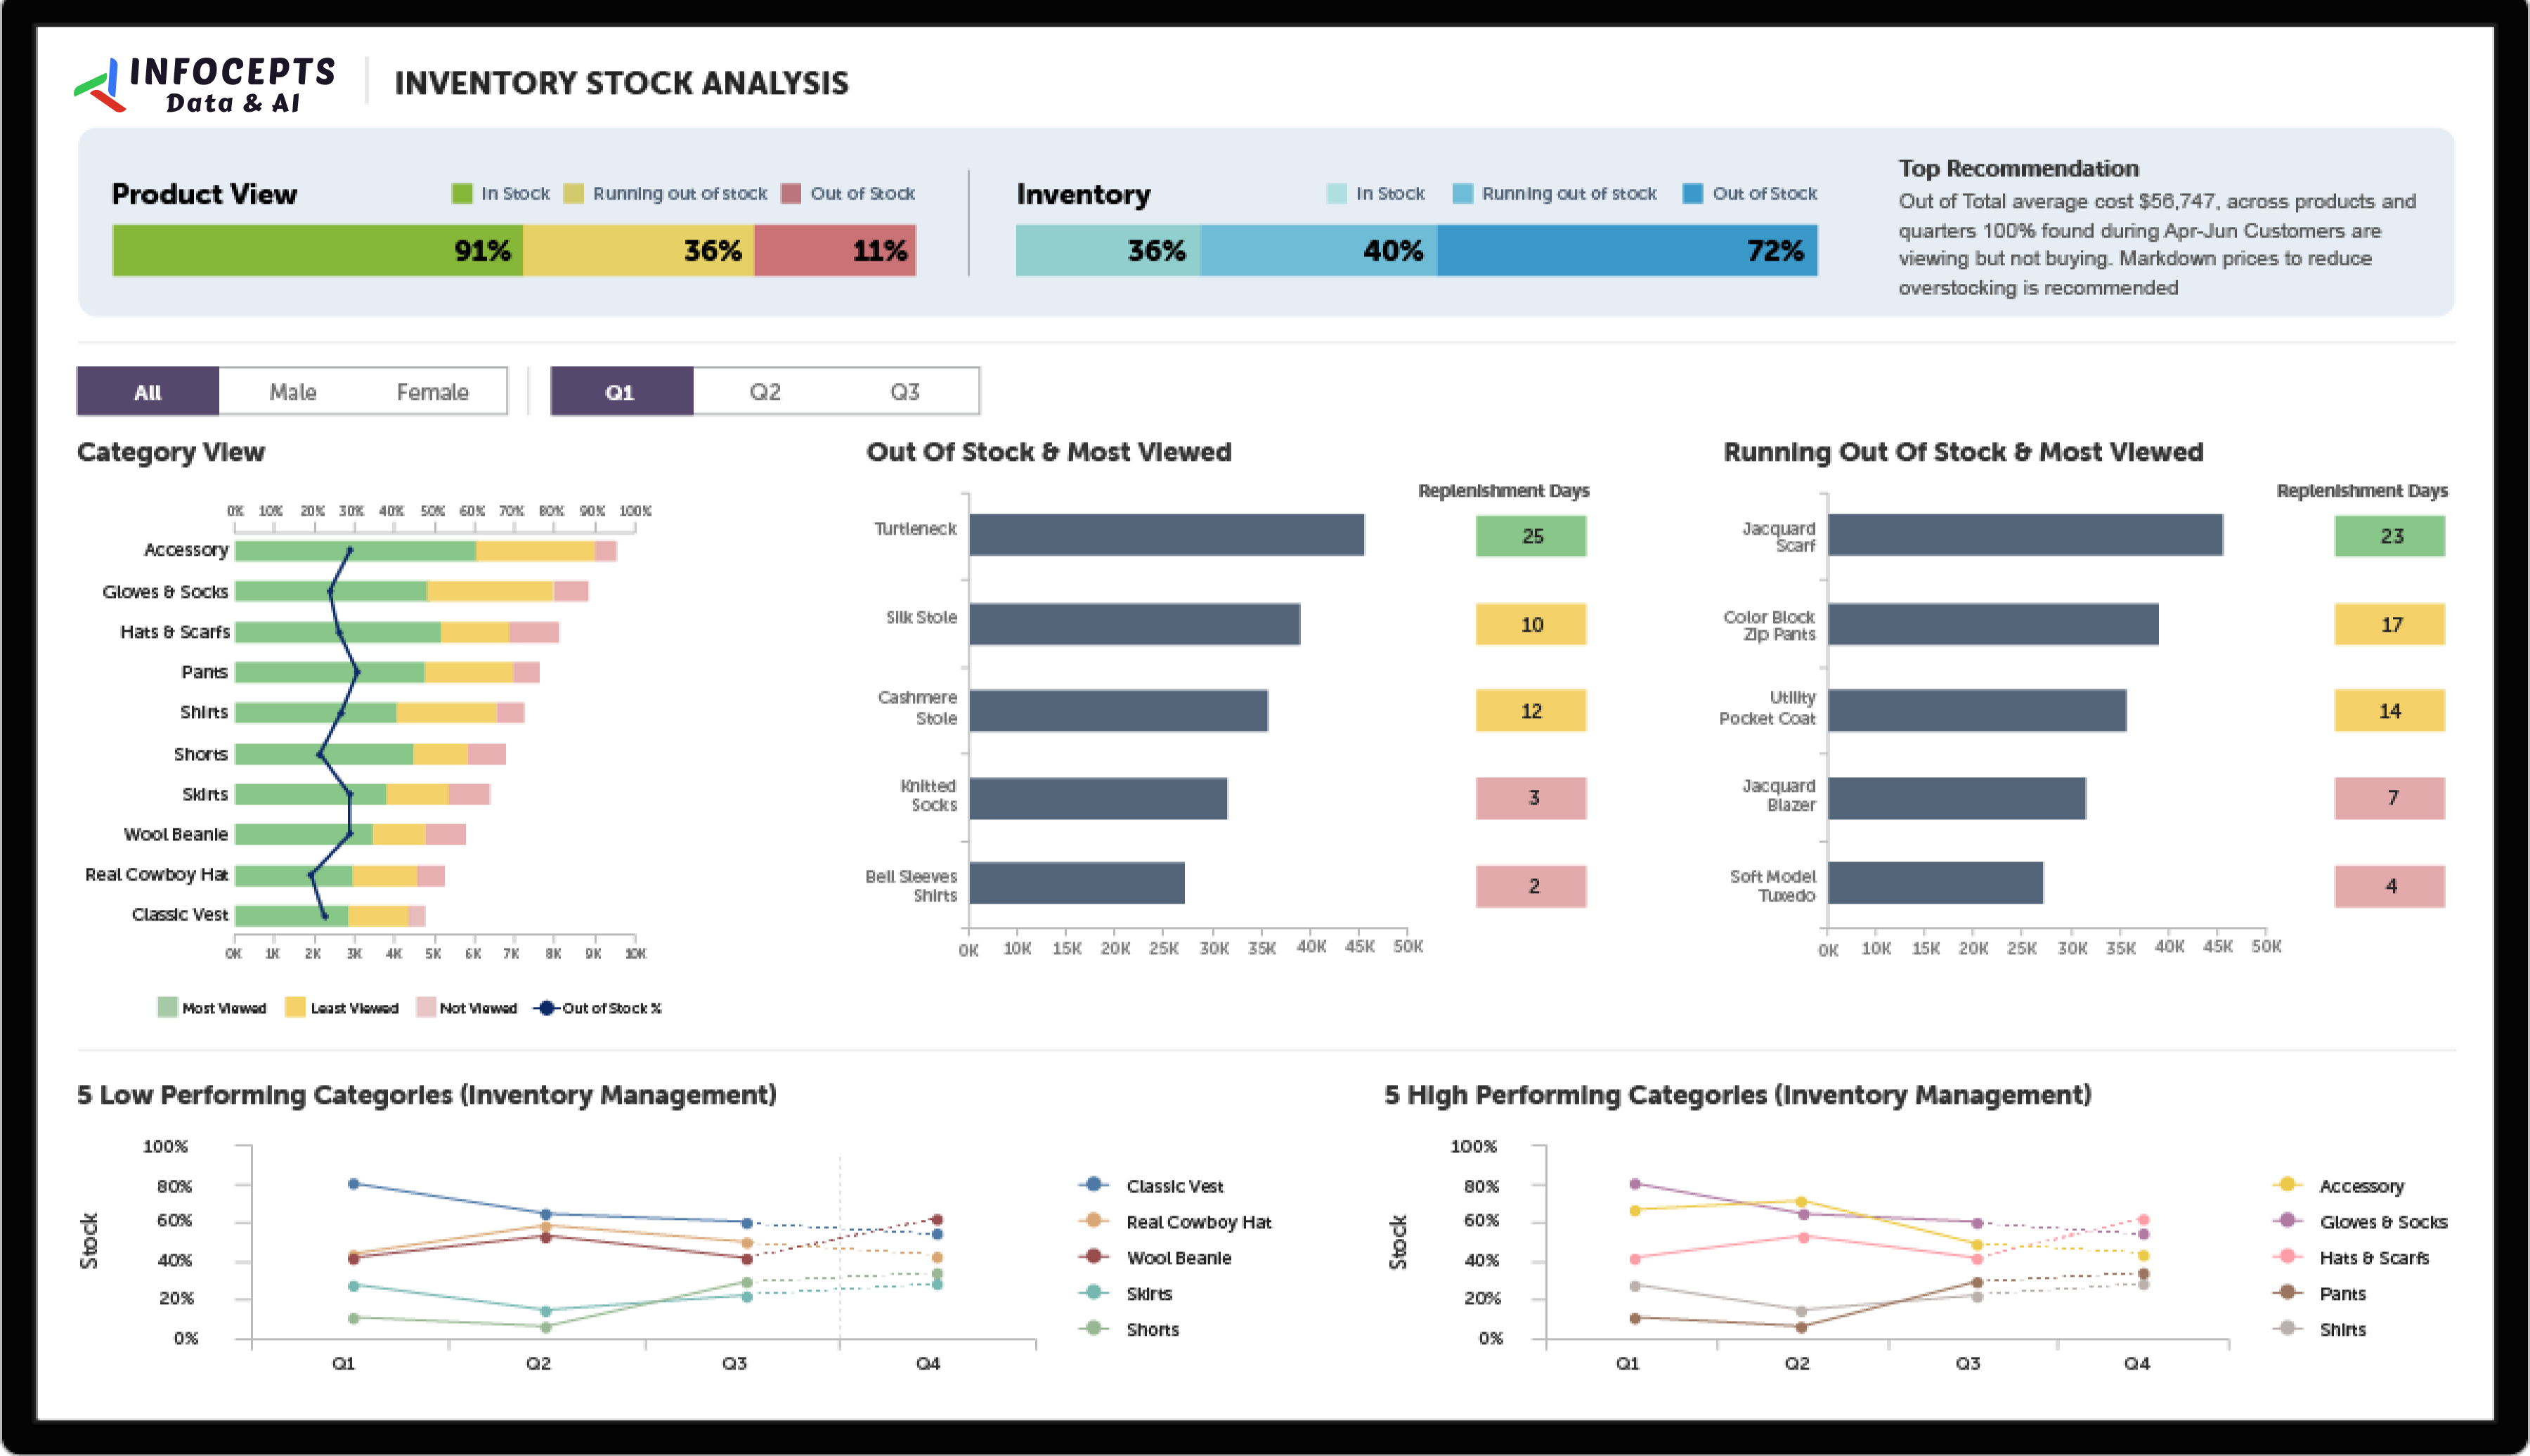
Provides a comprehensive view of organizational financial health, visualizing revenue, expenses, profitability, and key financial metrics. It offers actionable insights for finance teams and decision-makers to monitor performance, control budgets, and drive strategic financial planning.
Frequently asked questions
It brings revenue, expenses, profitability, and key financial metrics into one visual view, so finance teams can monitor organizational financial health without waiting for a monthly close report.
Monitor performance against budget, spot cost trends early, and support strategic financial planning with current numbers instead of last month’s close.
Revenue, expenses, profitability, and whatever additional financial KPIs a specific organization tracks, such as margin by product line or budget variance by department.
Finance teams and decision-makers responsible for budget control and financial planning across the organization, not just the finance department itself.
Accounting reports are typically periodic and compliance-focused; a finance dashboard is built for ongoing monitoring and decision-making, refreshed more frequently than a close cycle.
By connecting ERP and financial systems into a BI platform through Business Analytics services, structured around the financial KPIs a specific finance team already reports on.

 Pranali Lanjewar