



50%
Increase in User Adoption by store managers
64%
Increased in sales
56%
Improved decision making
45%
Ease of use
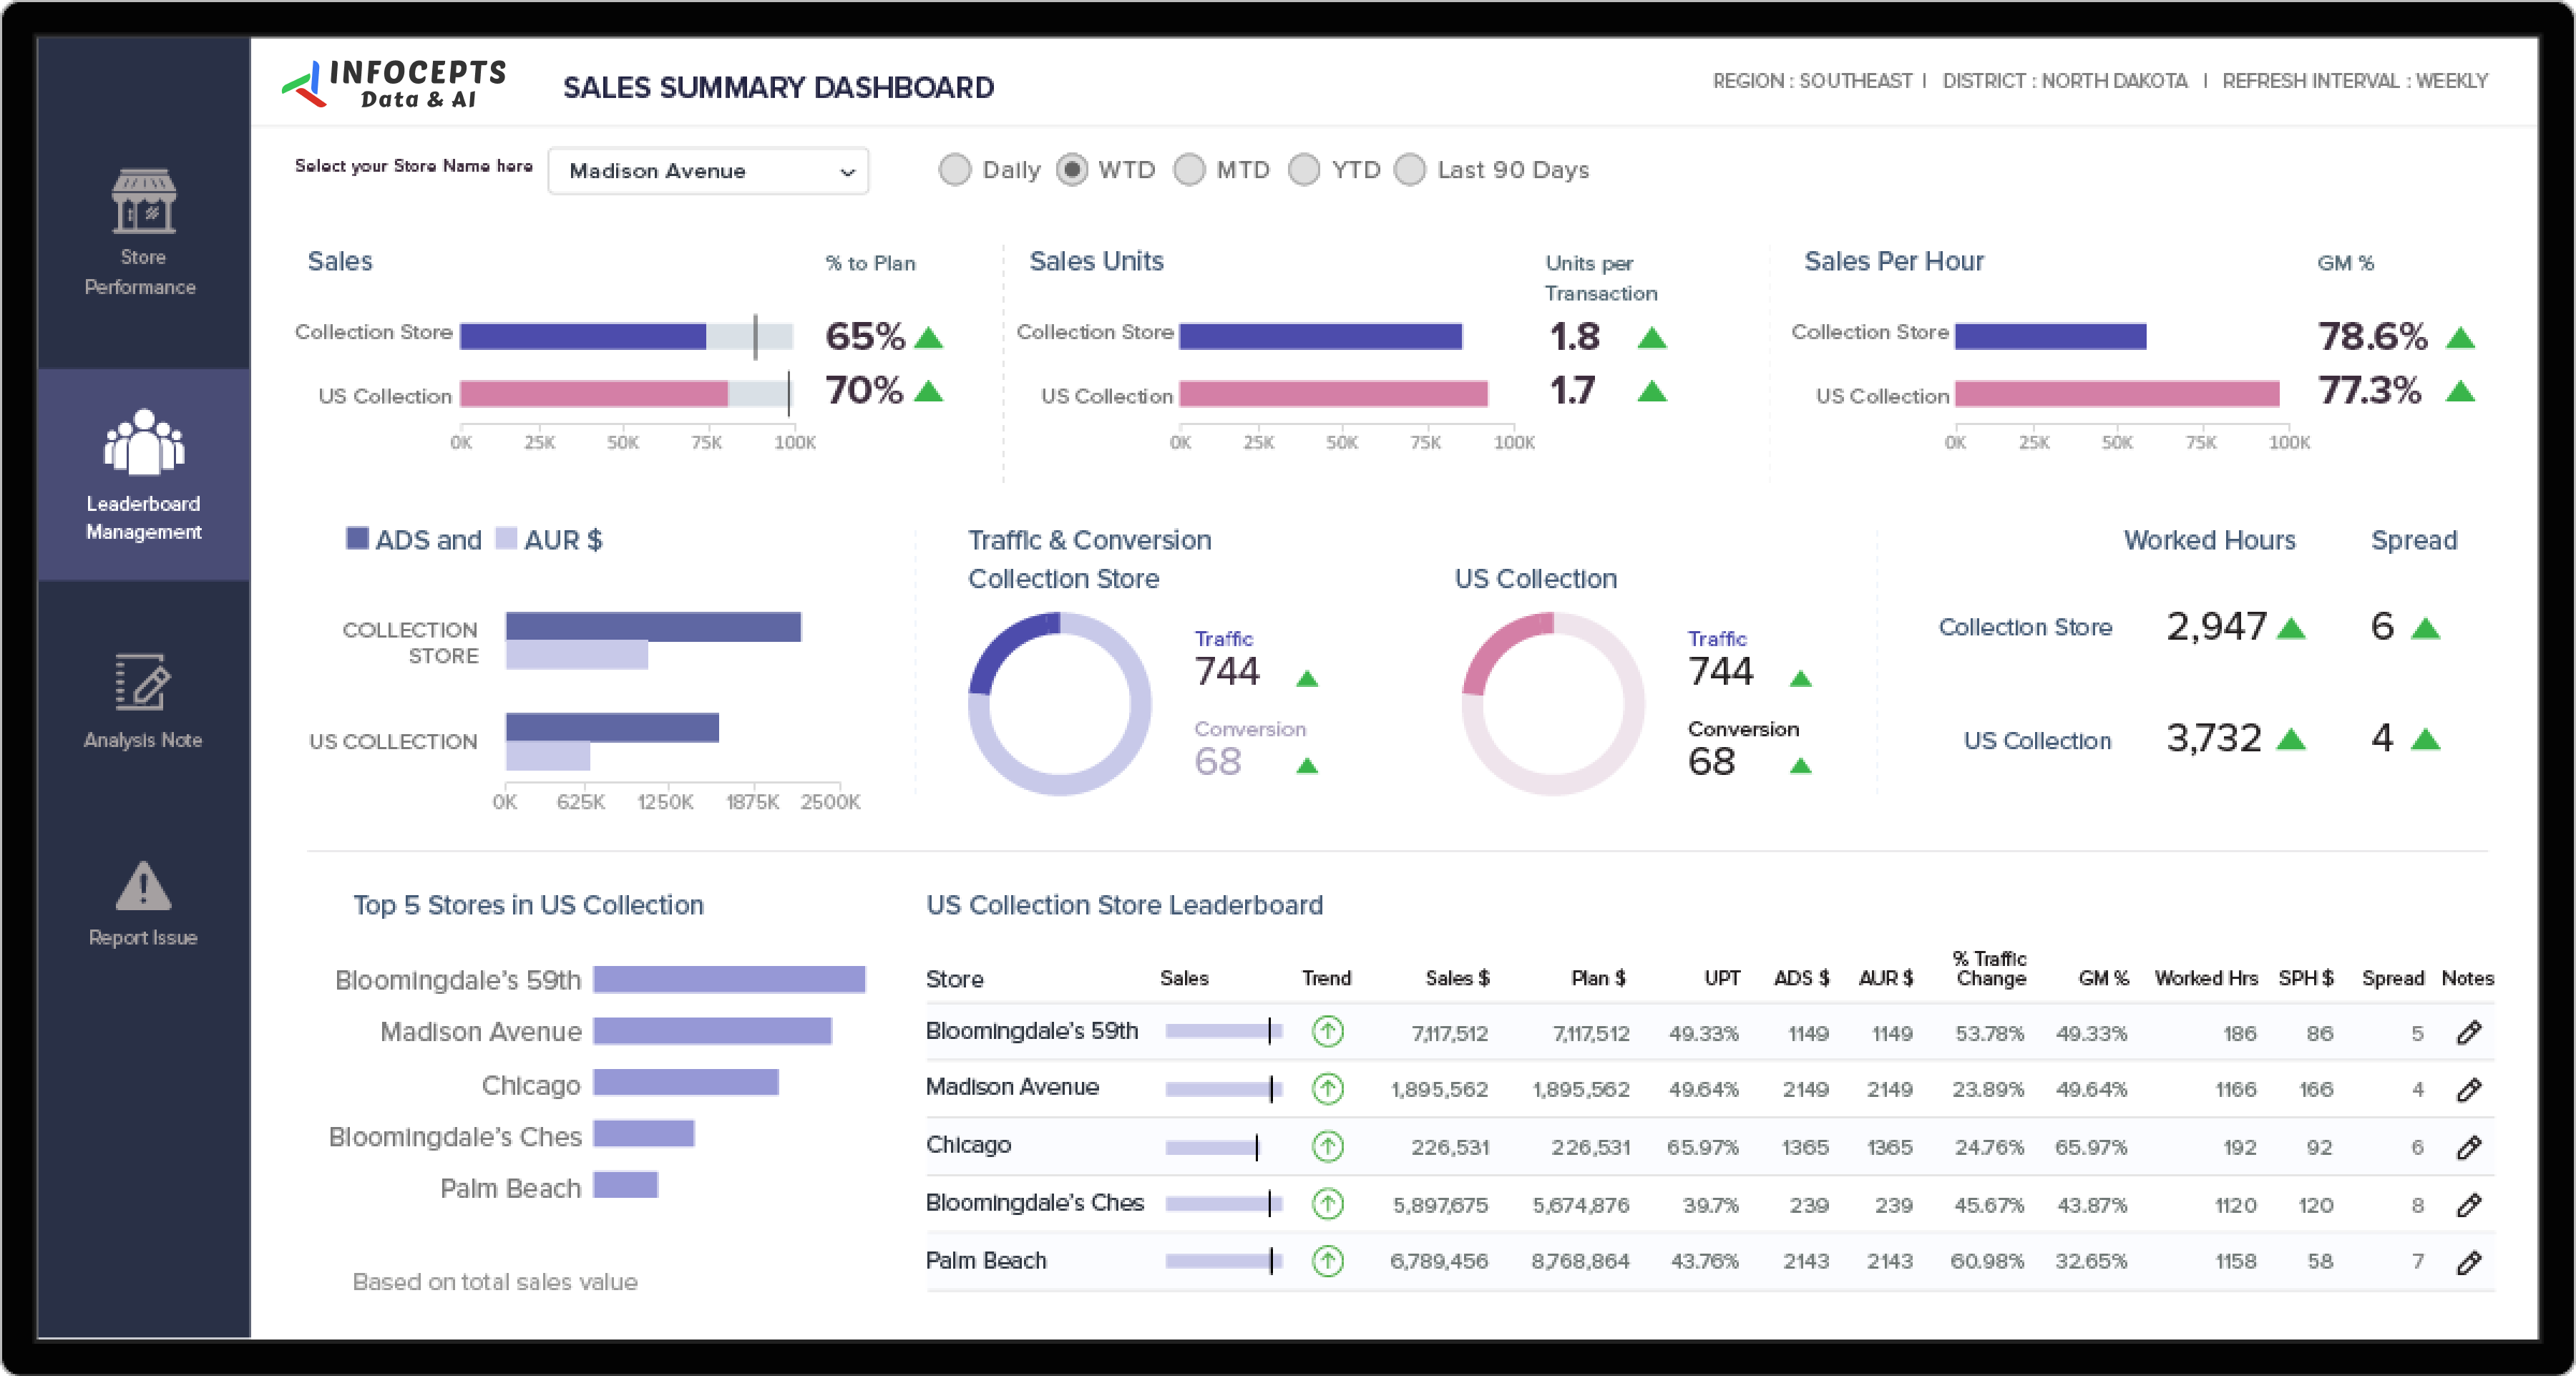
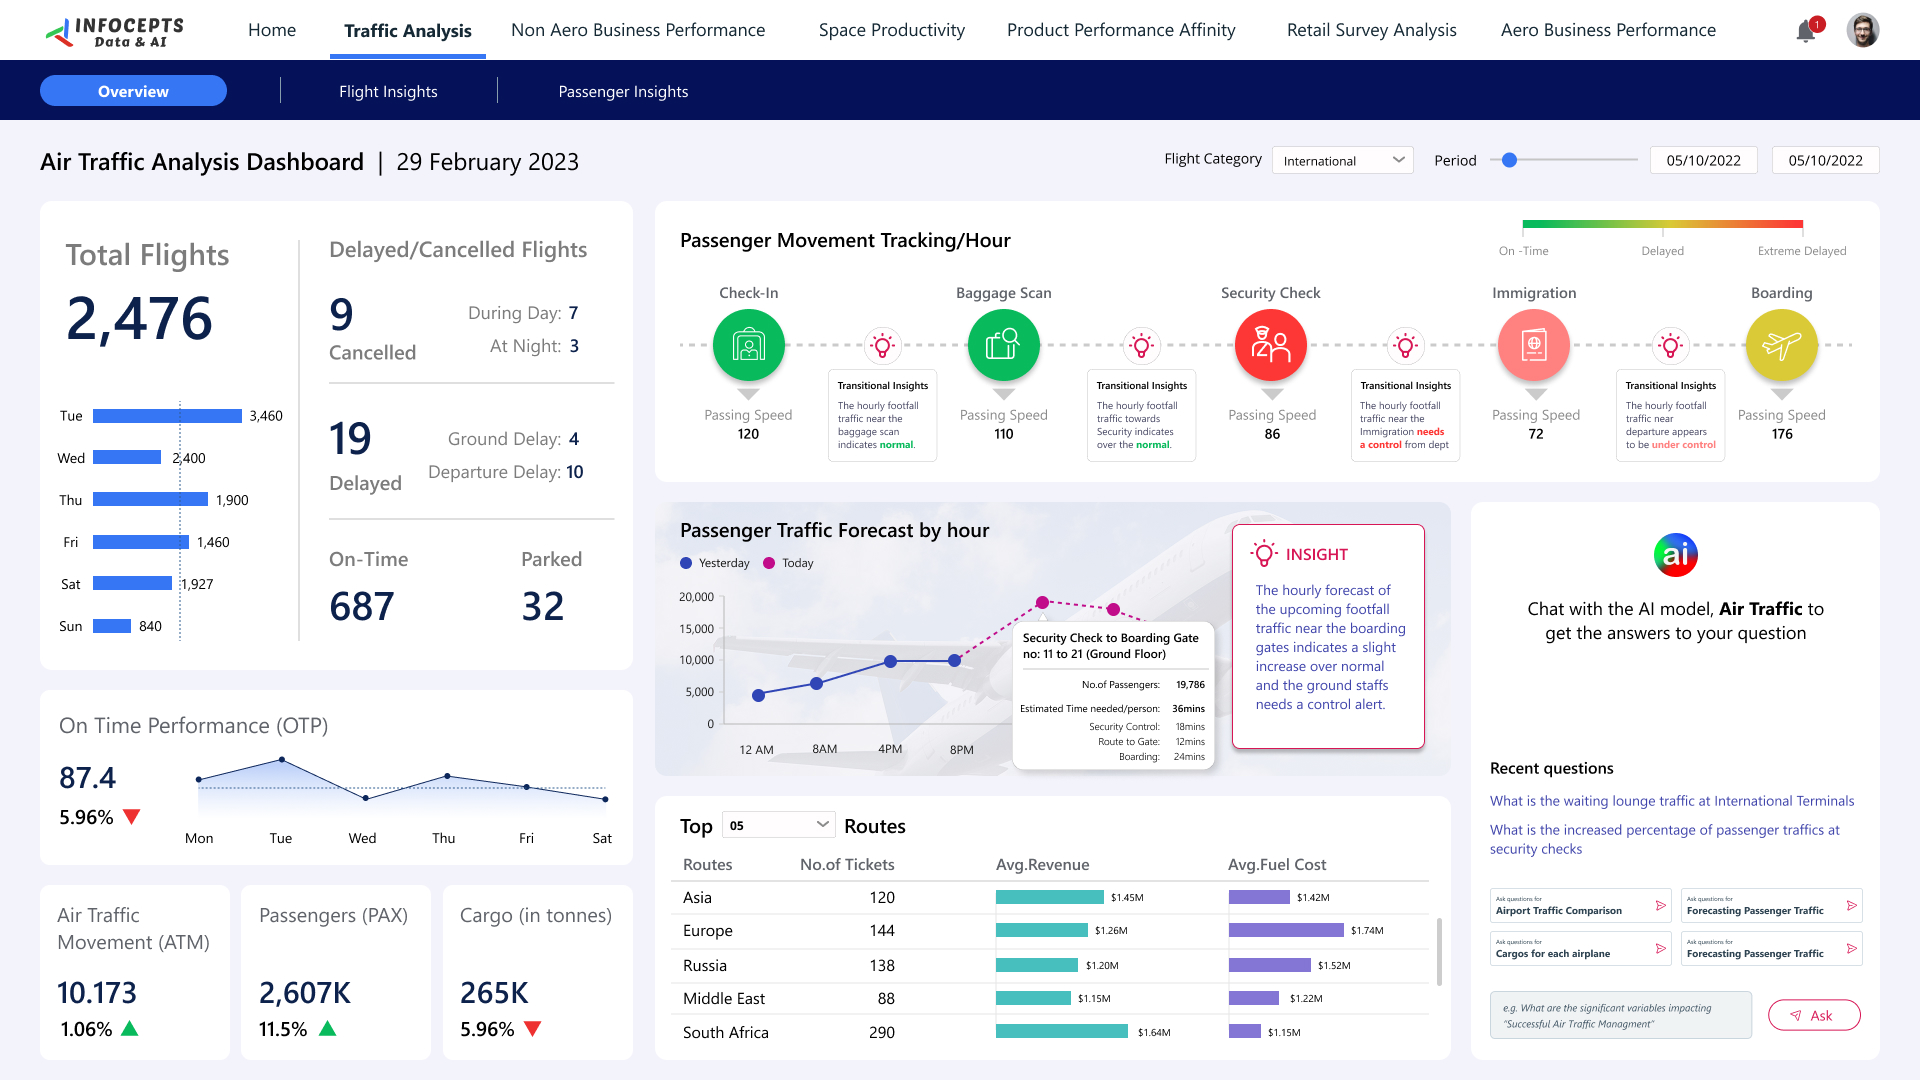
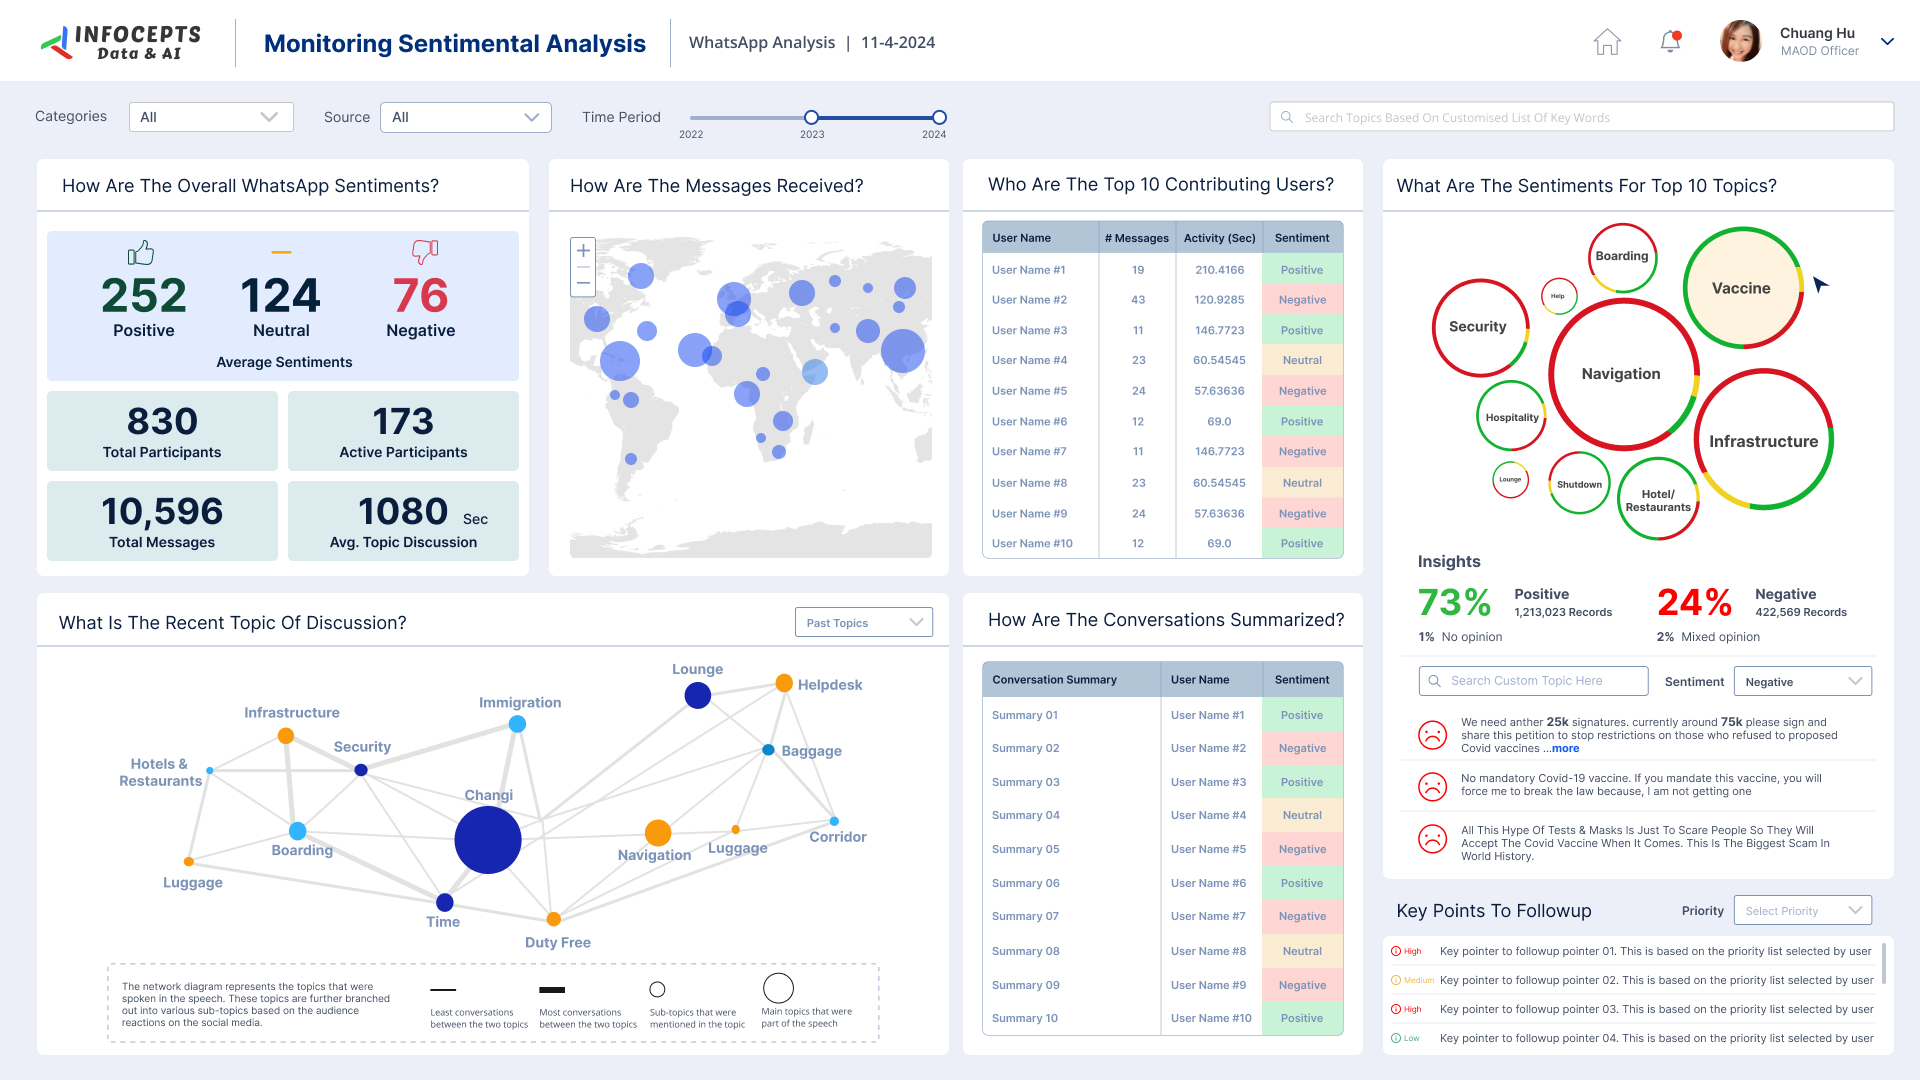
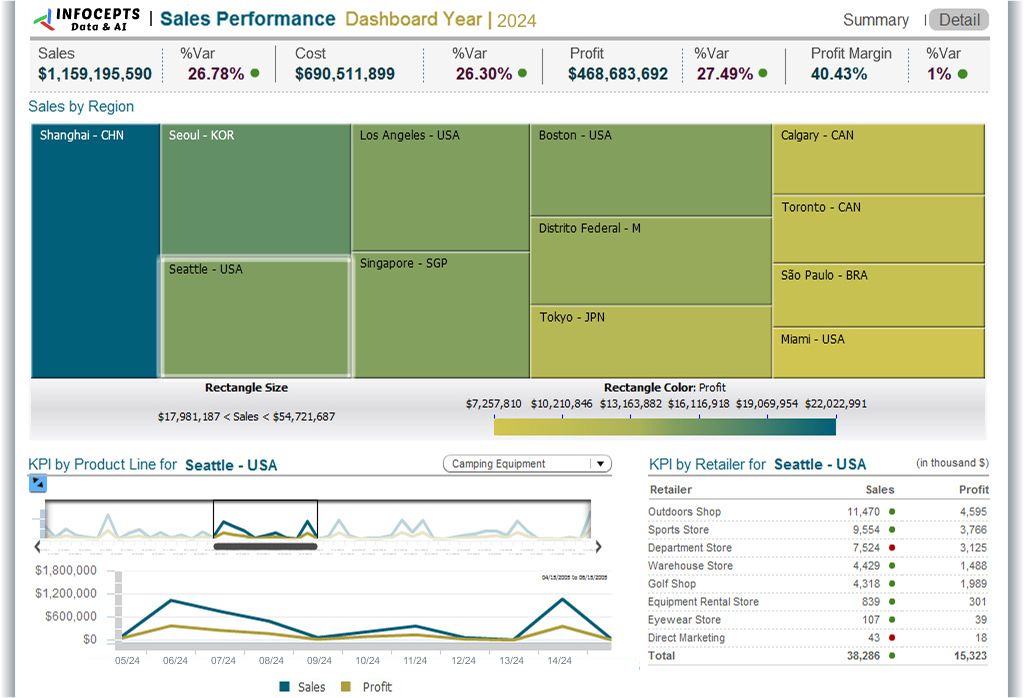
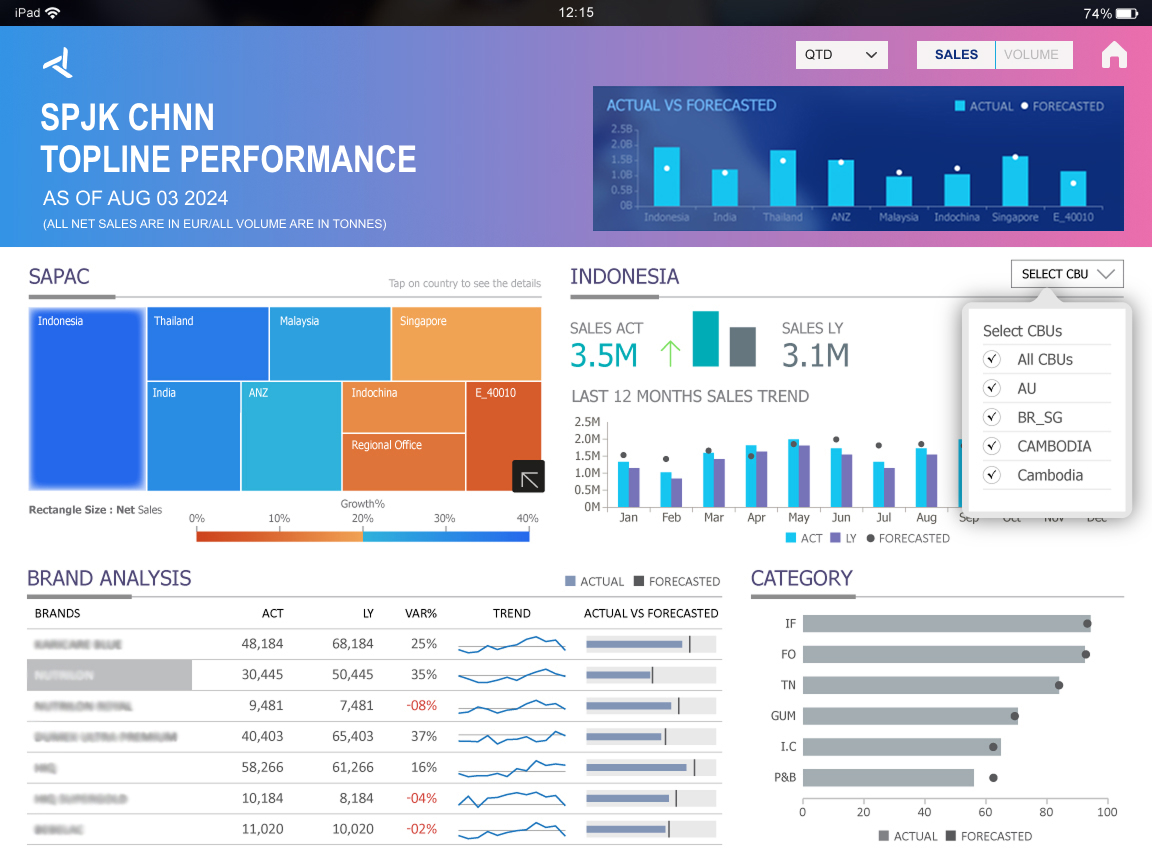
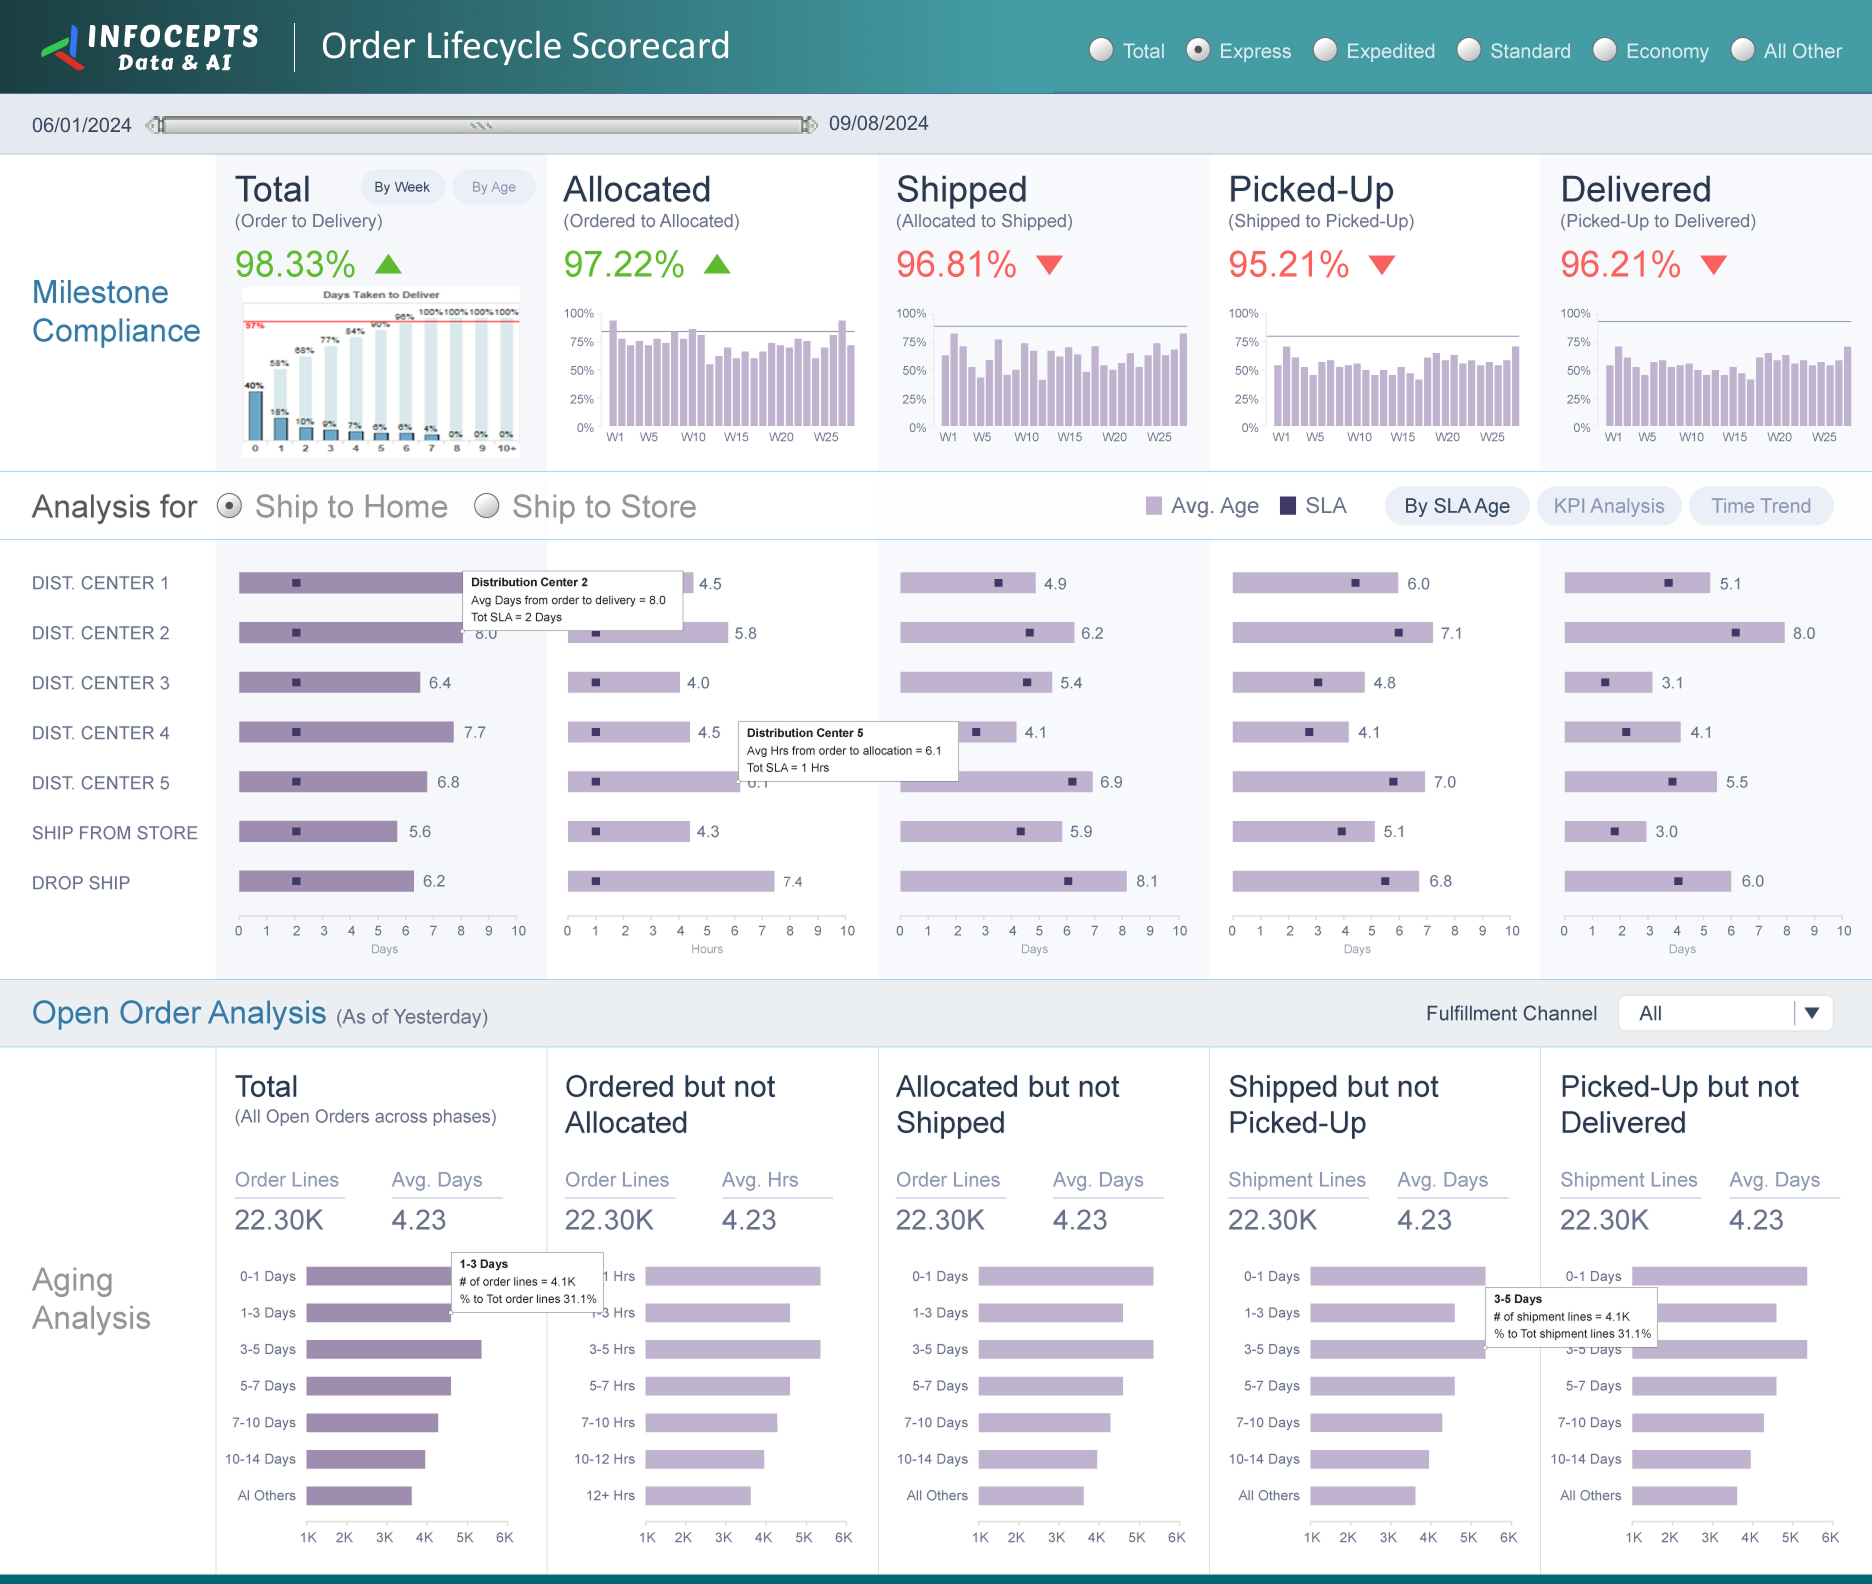
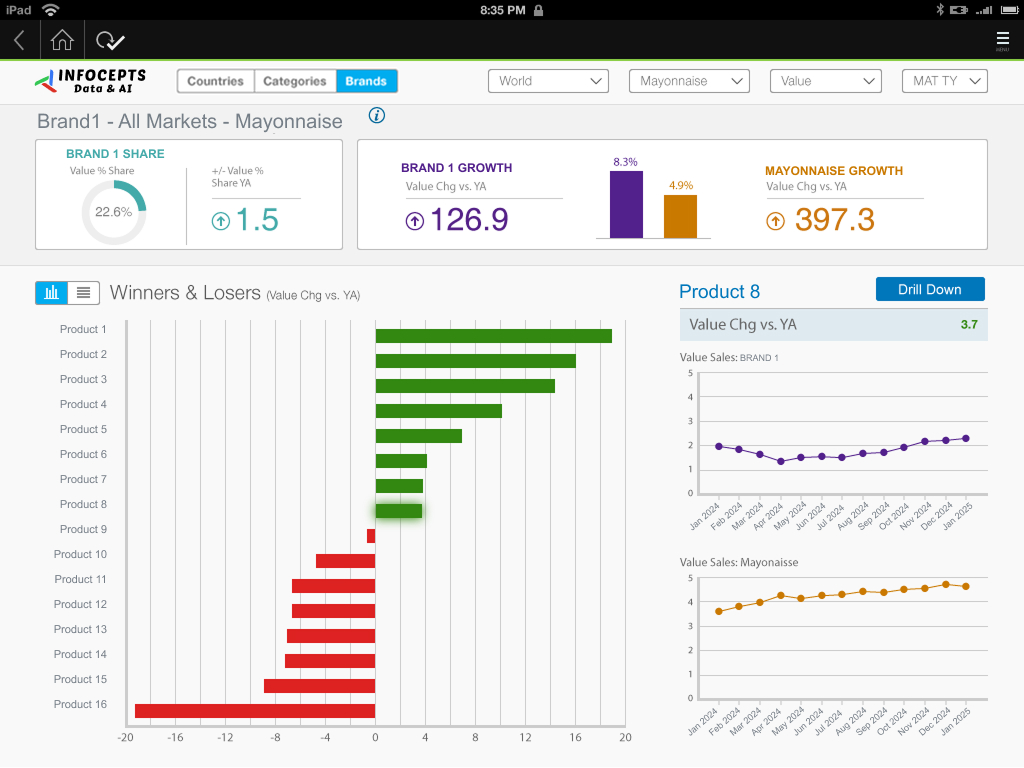
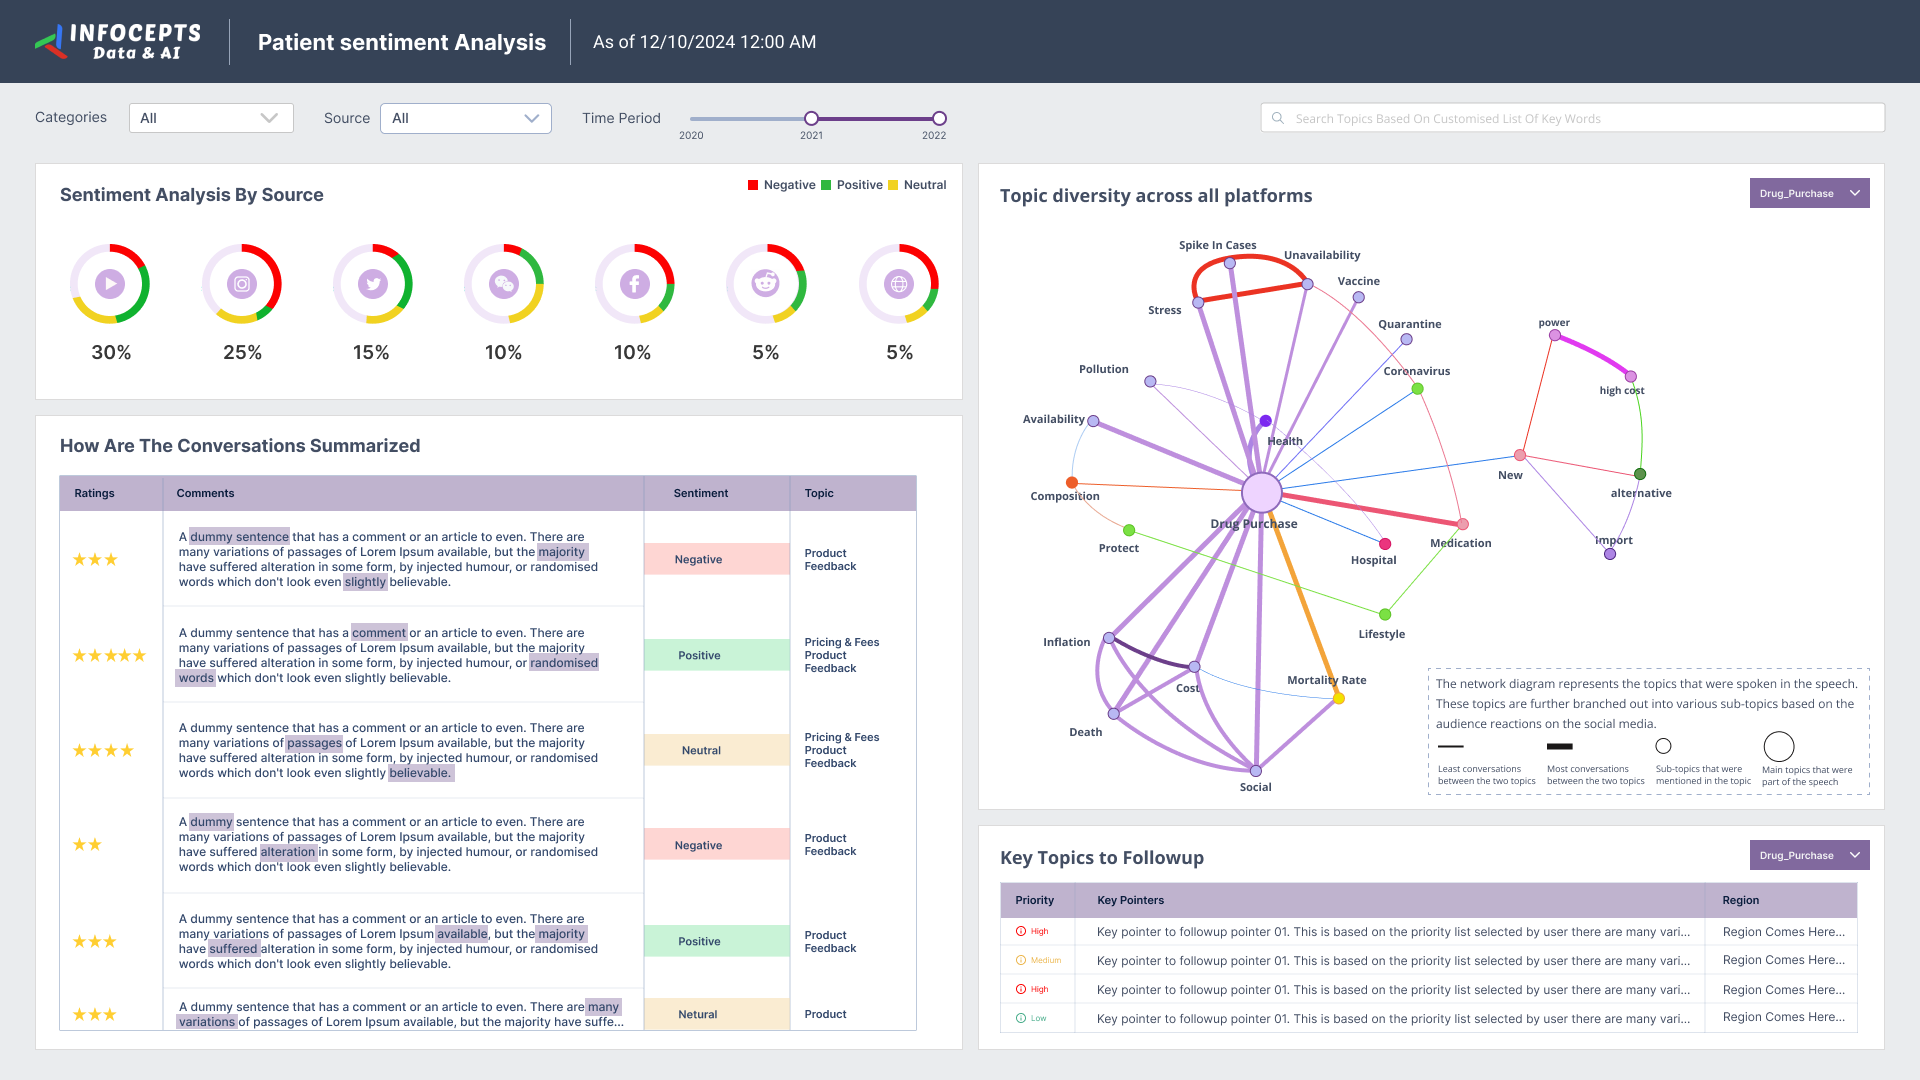
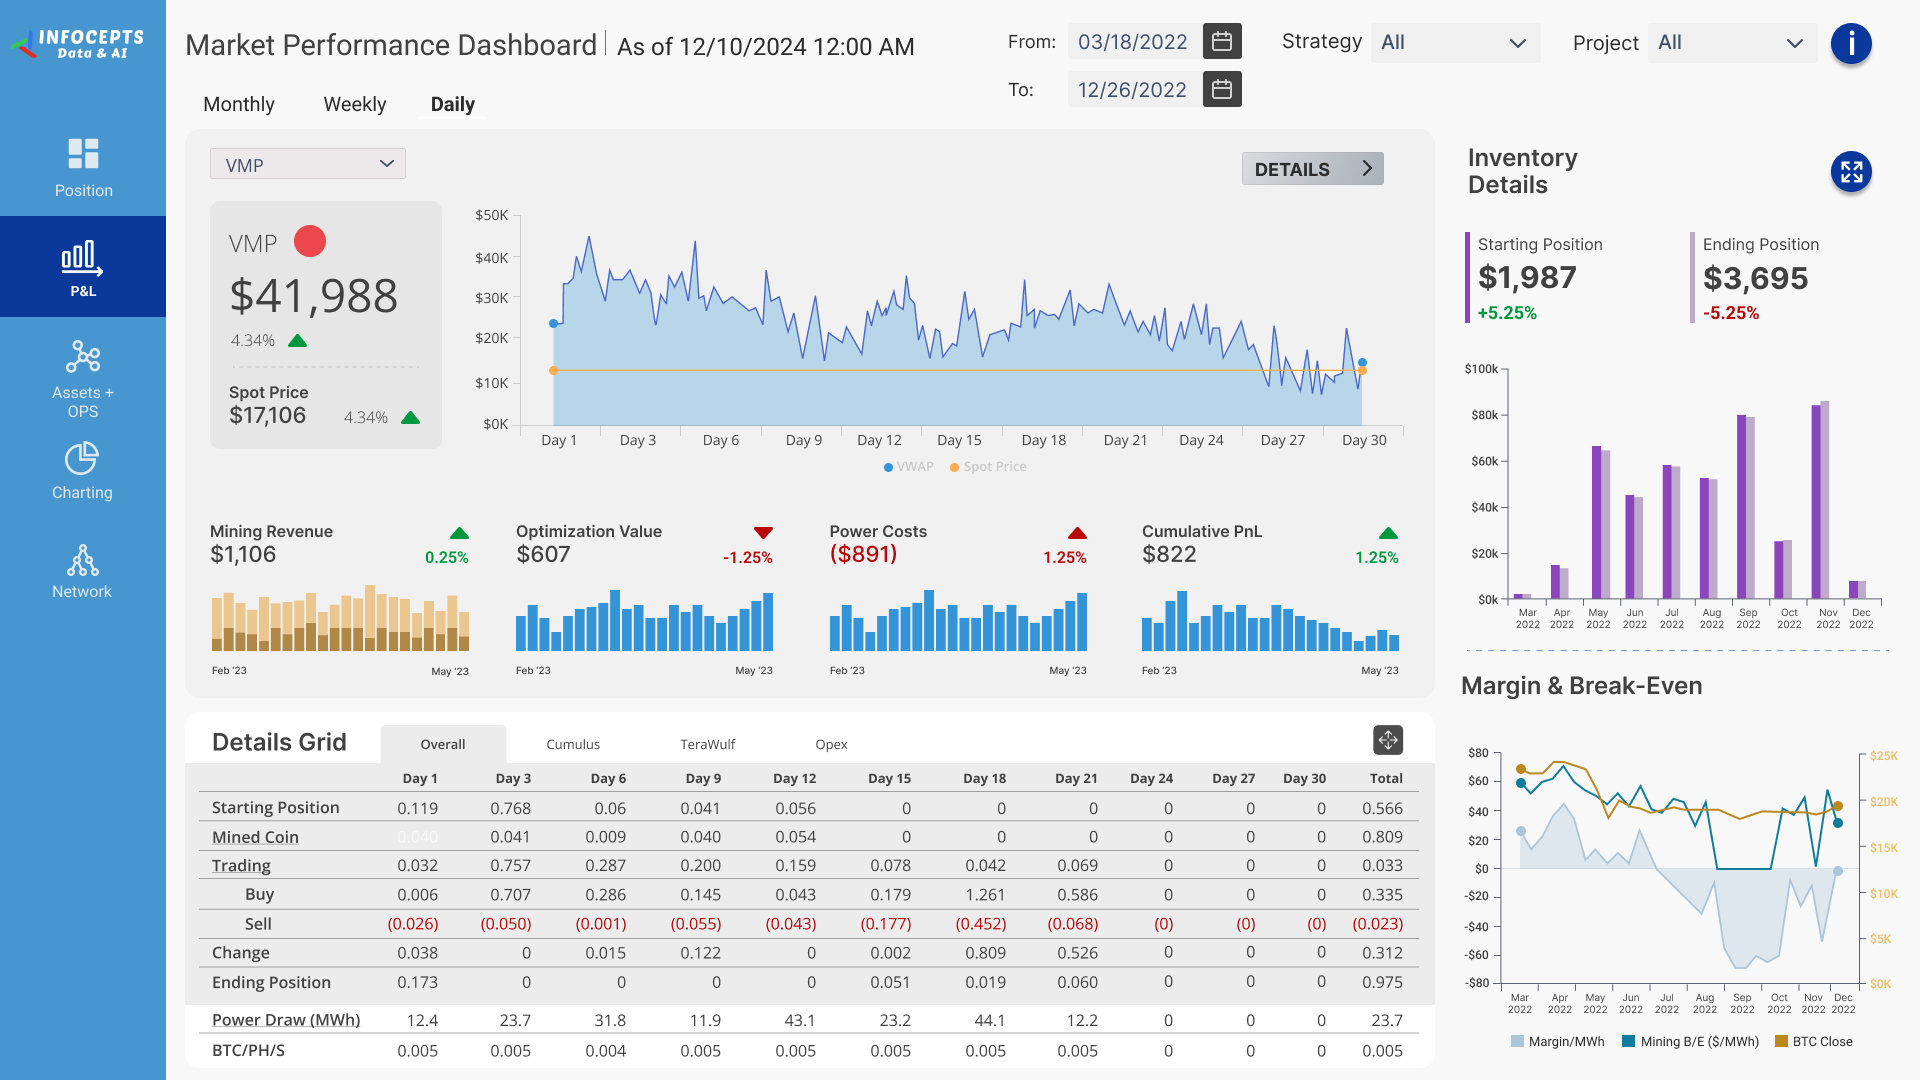
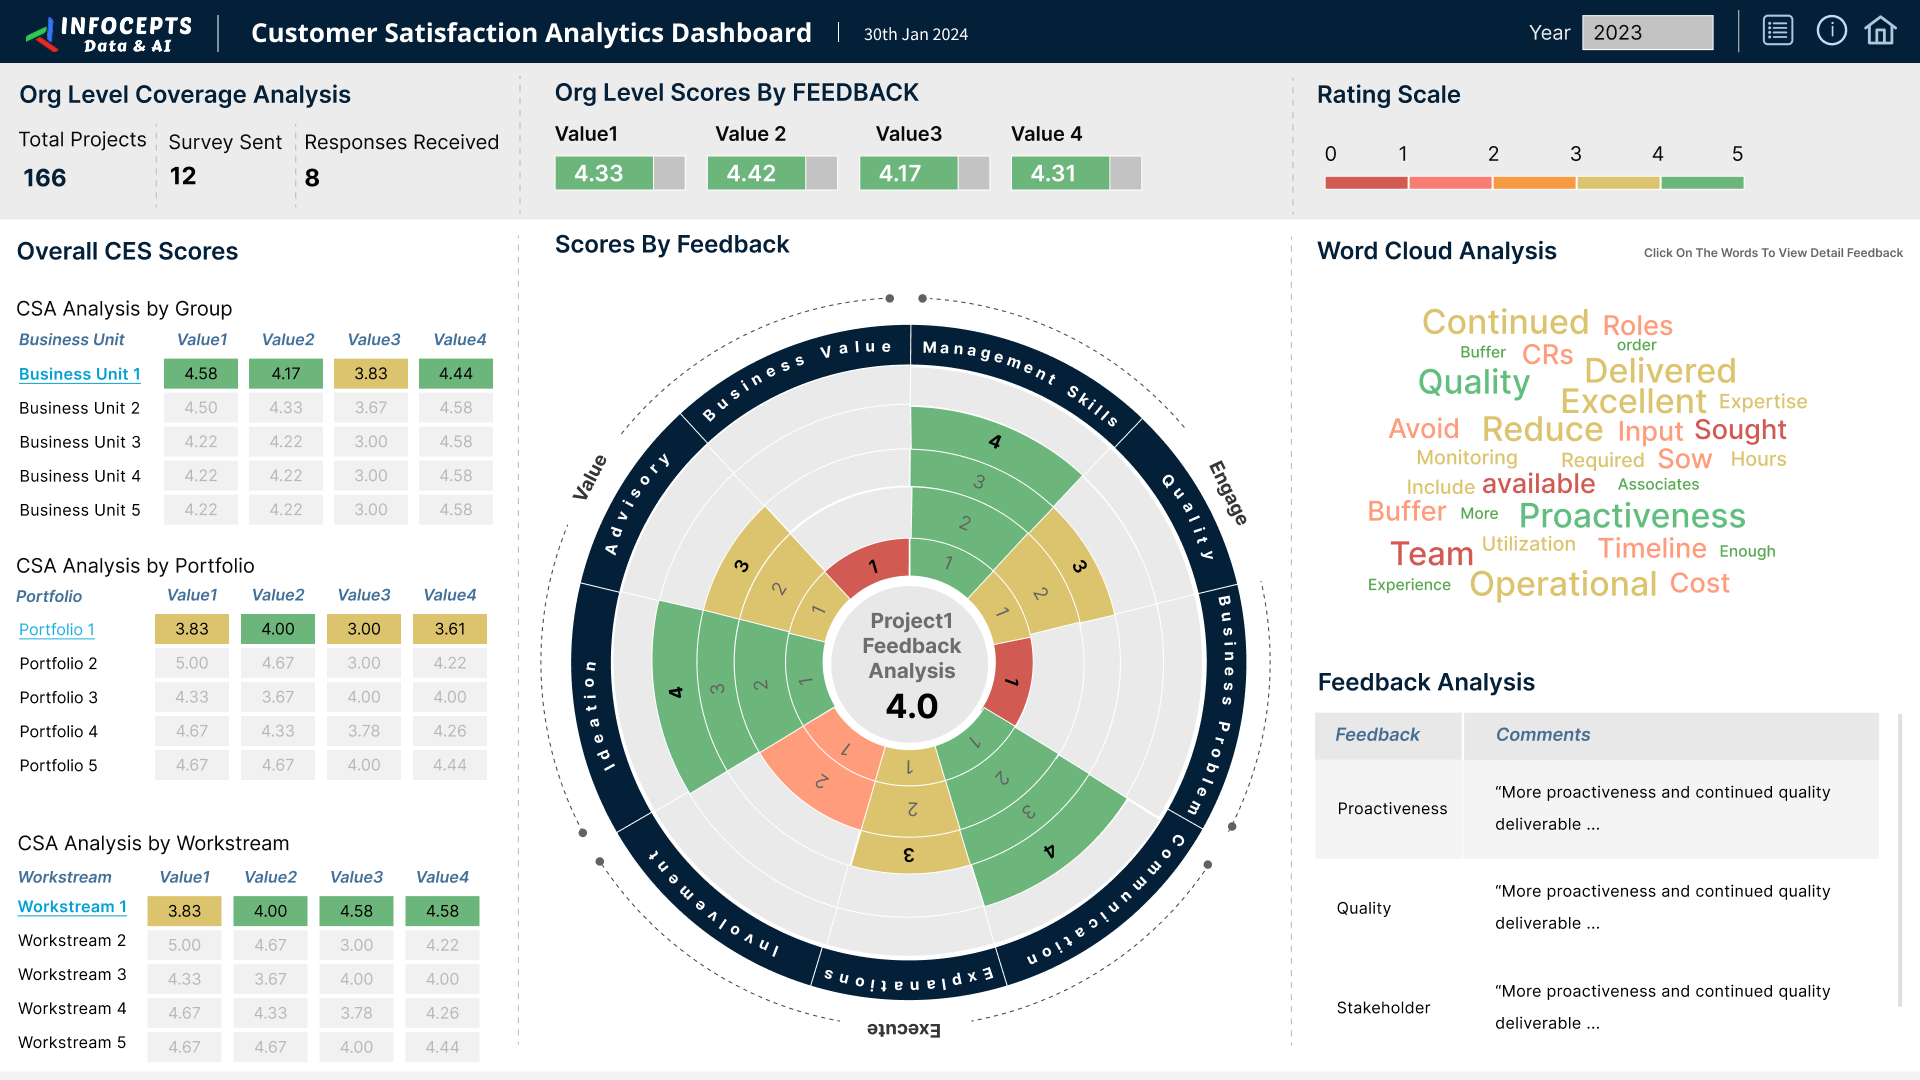
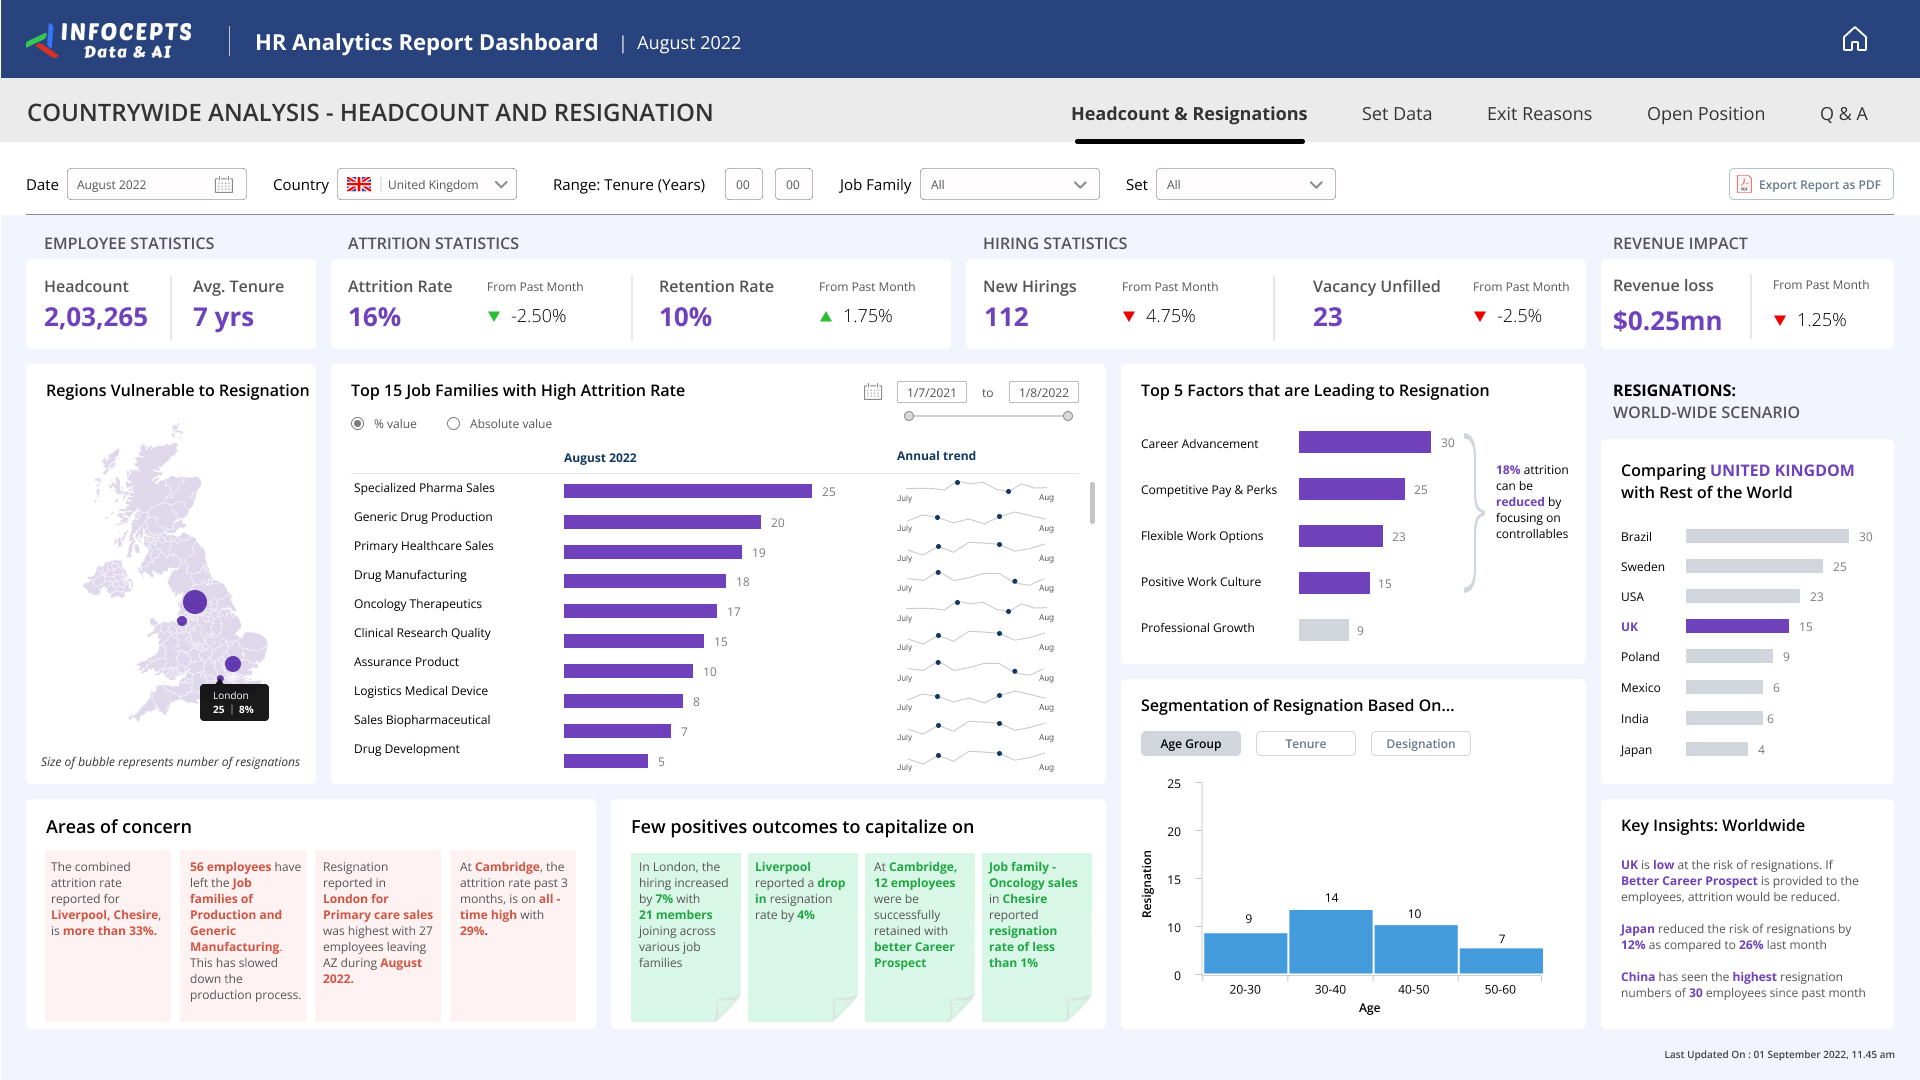
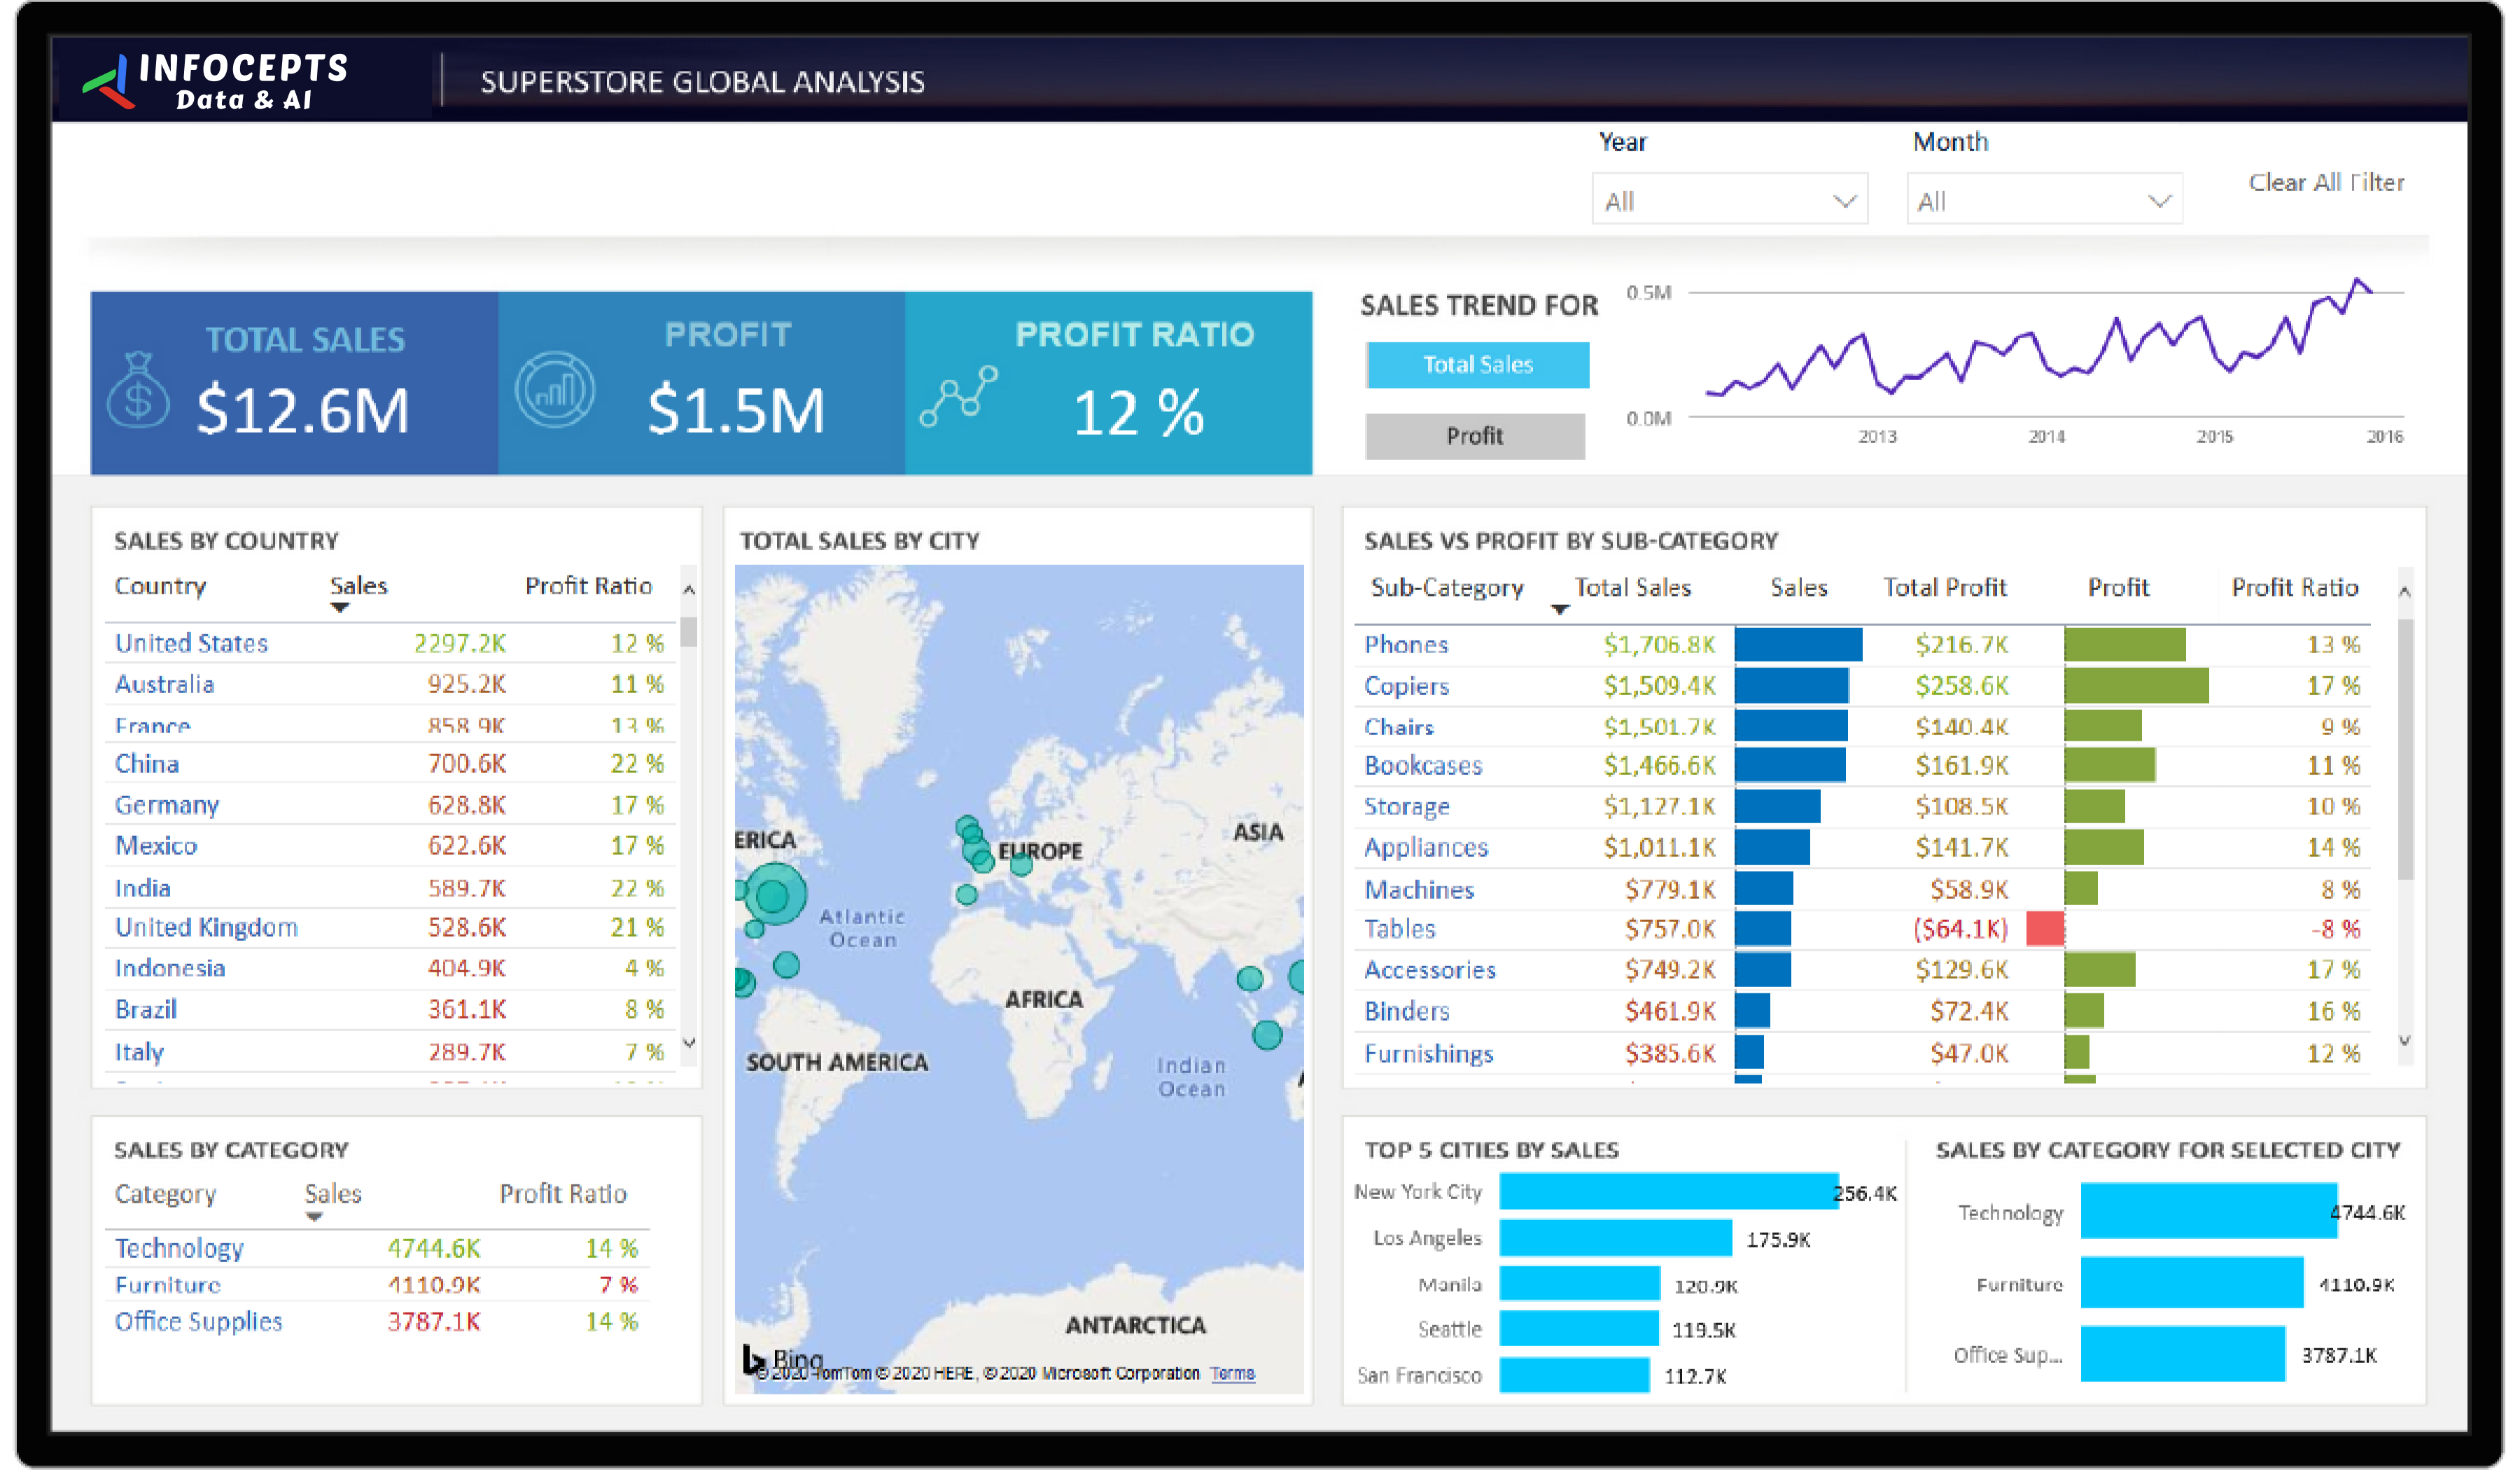
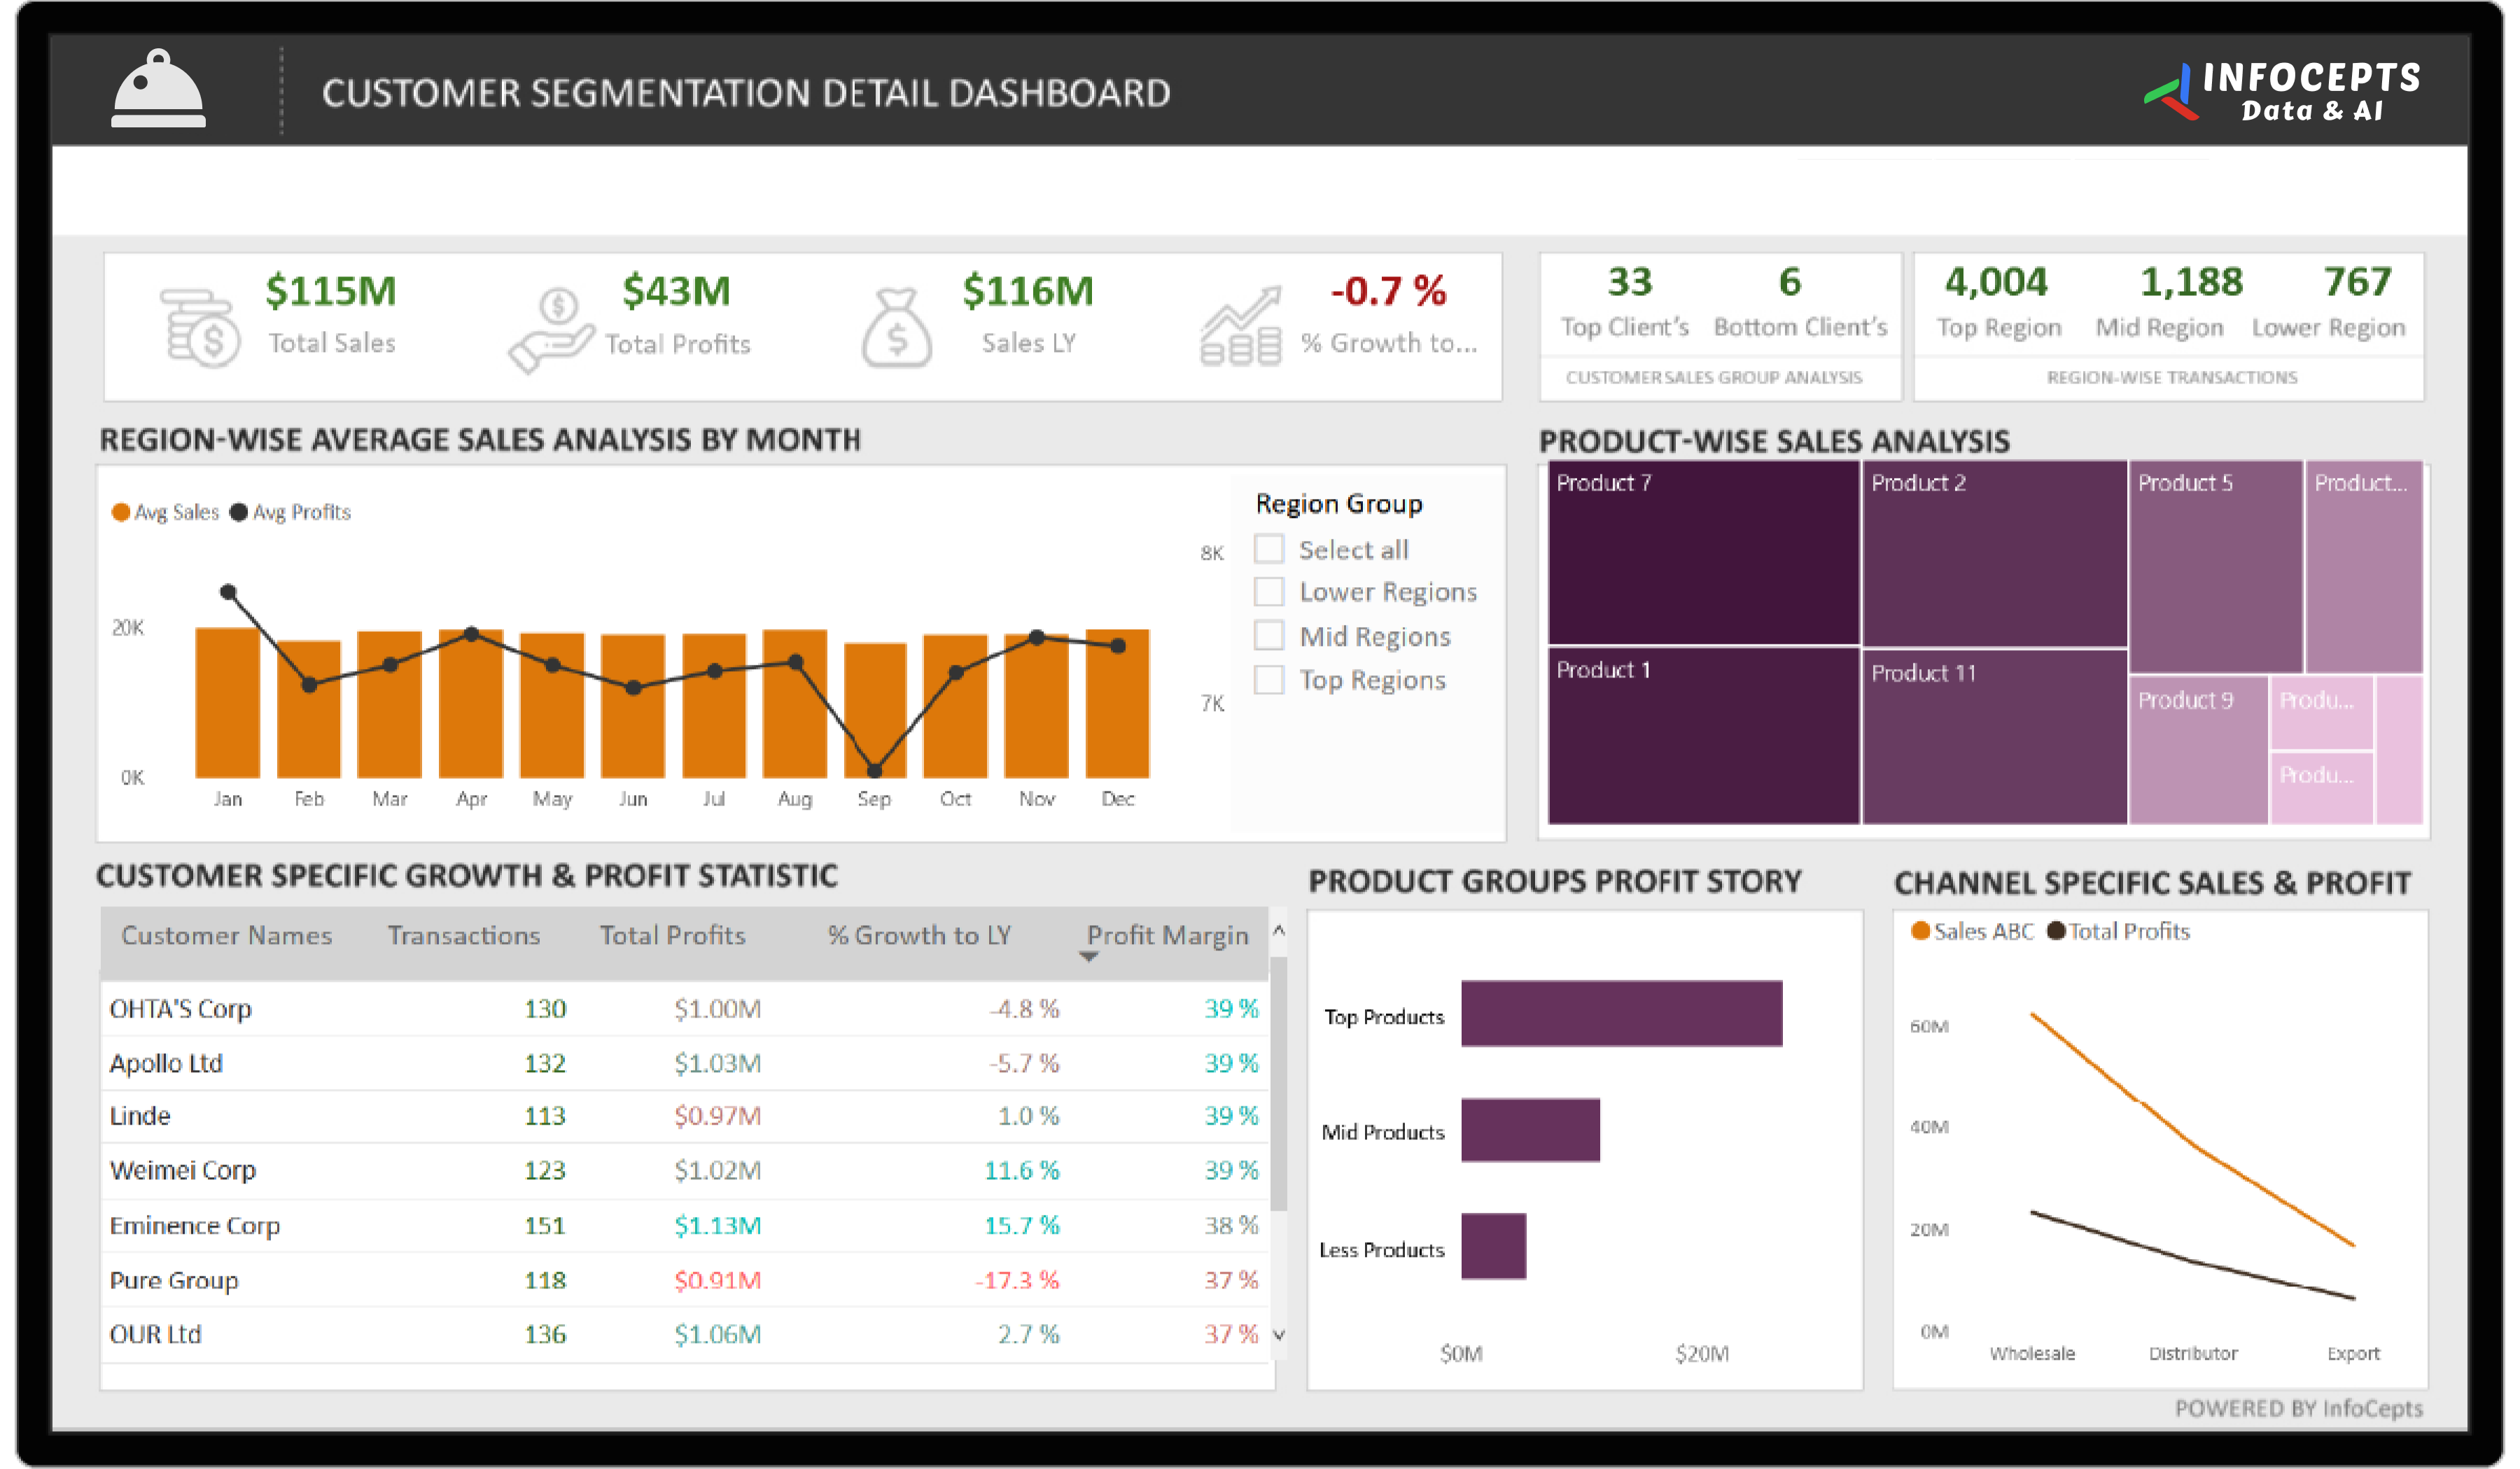
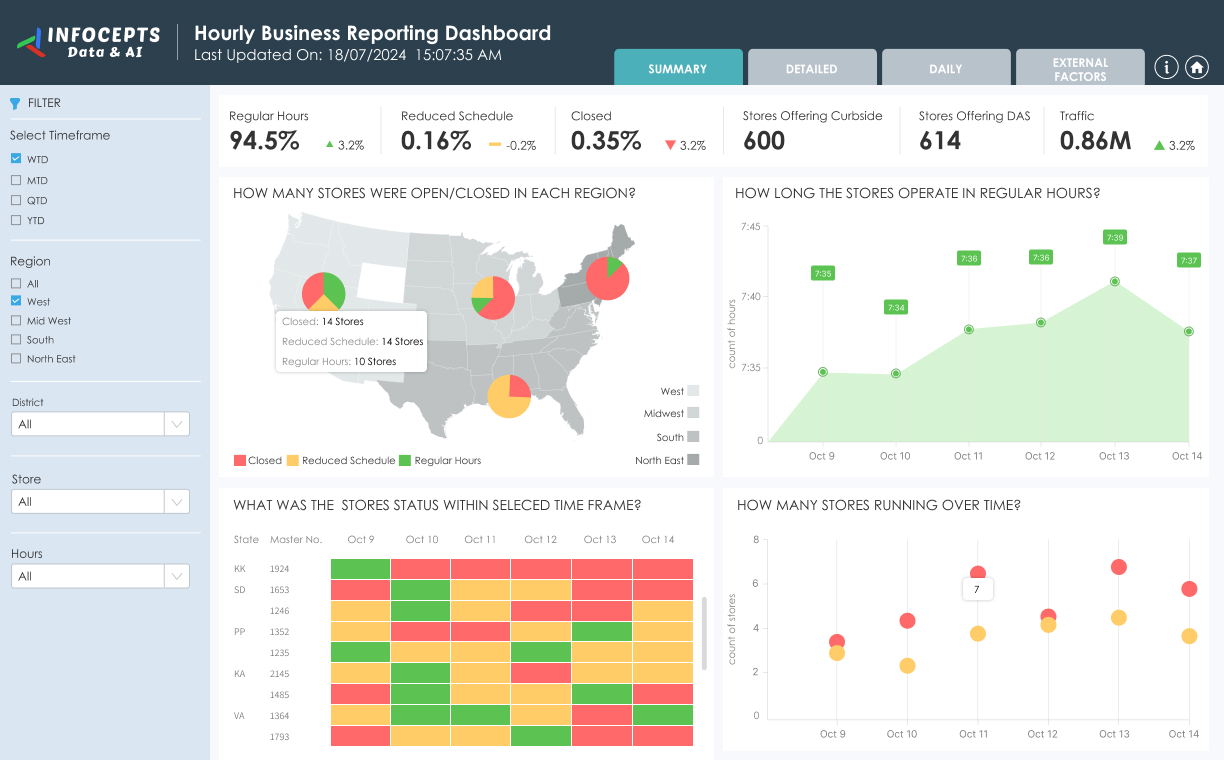
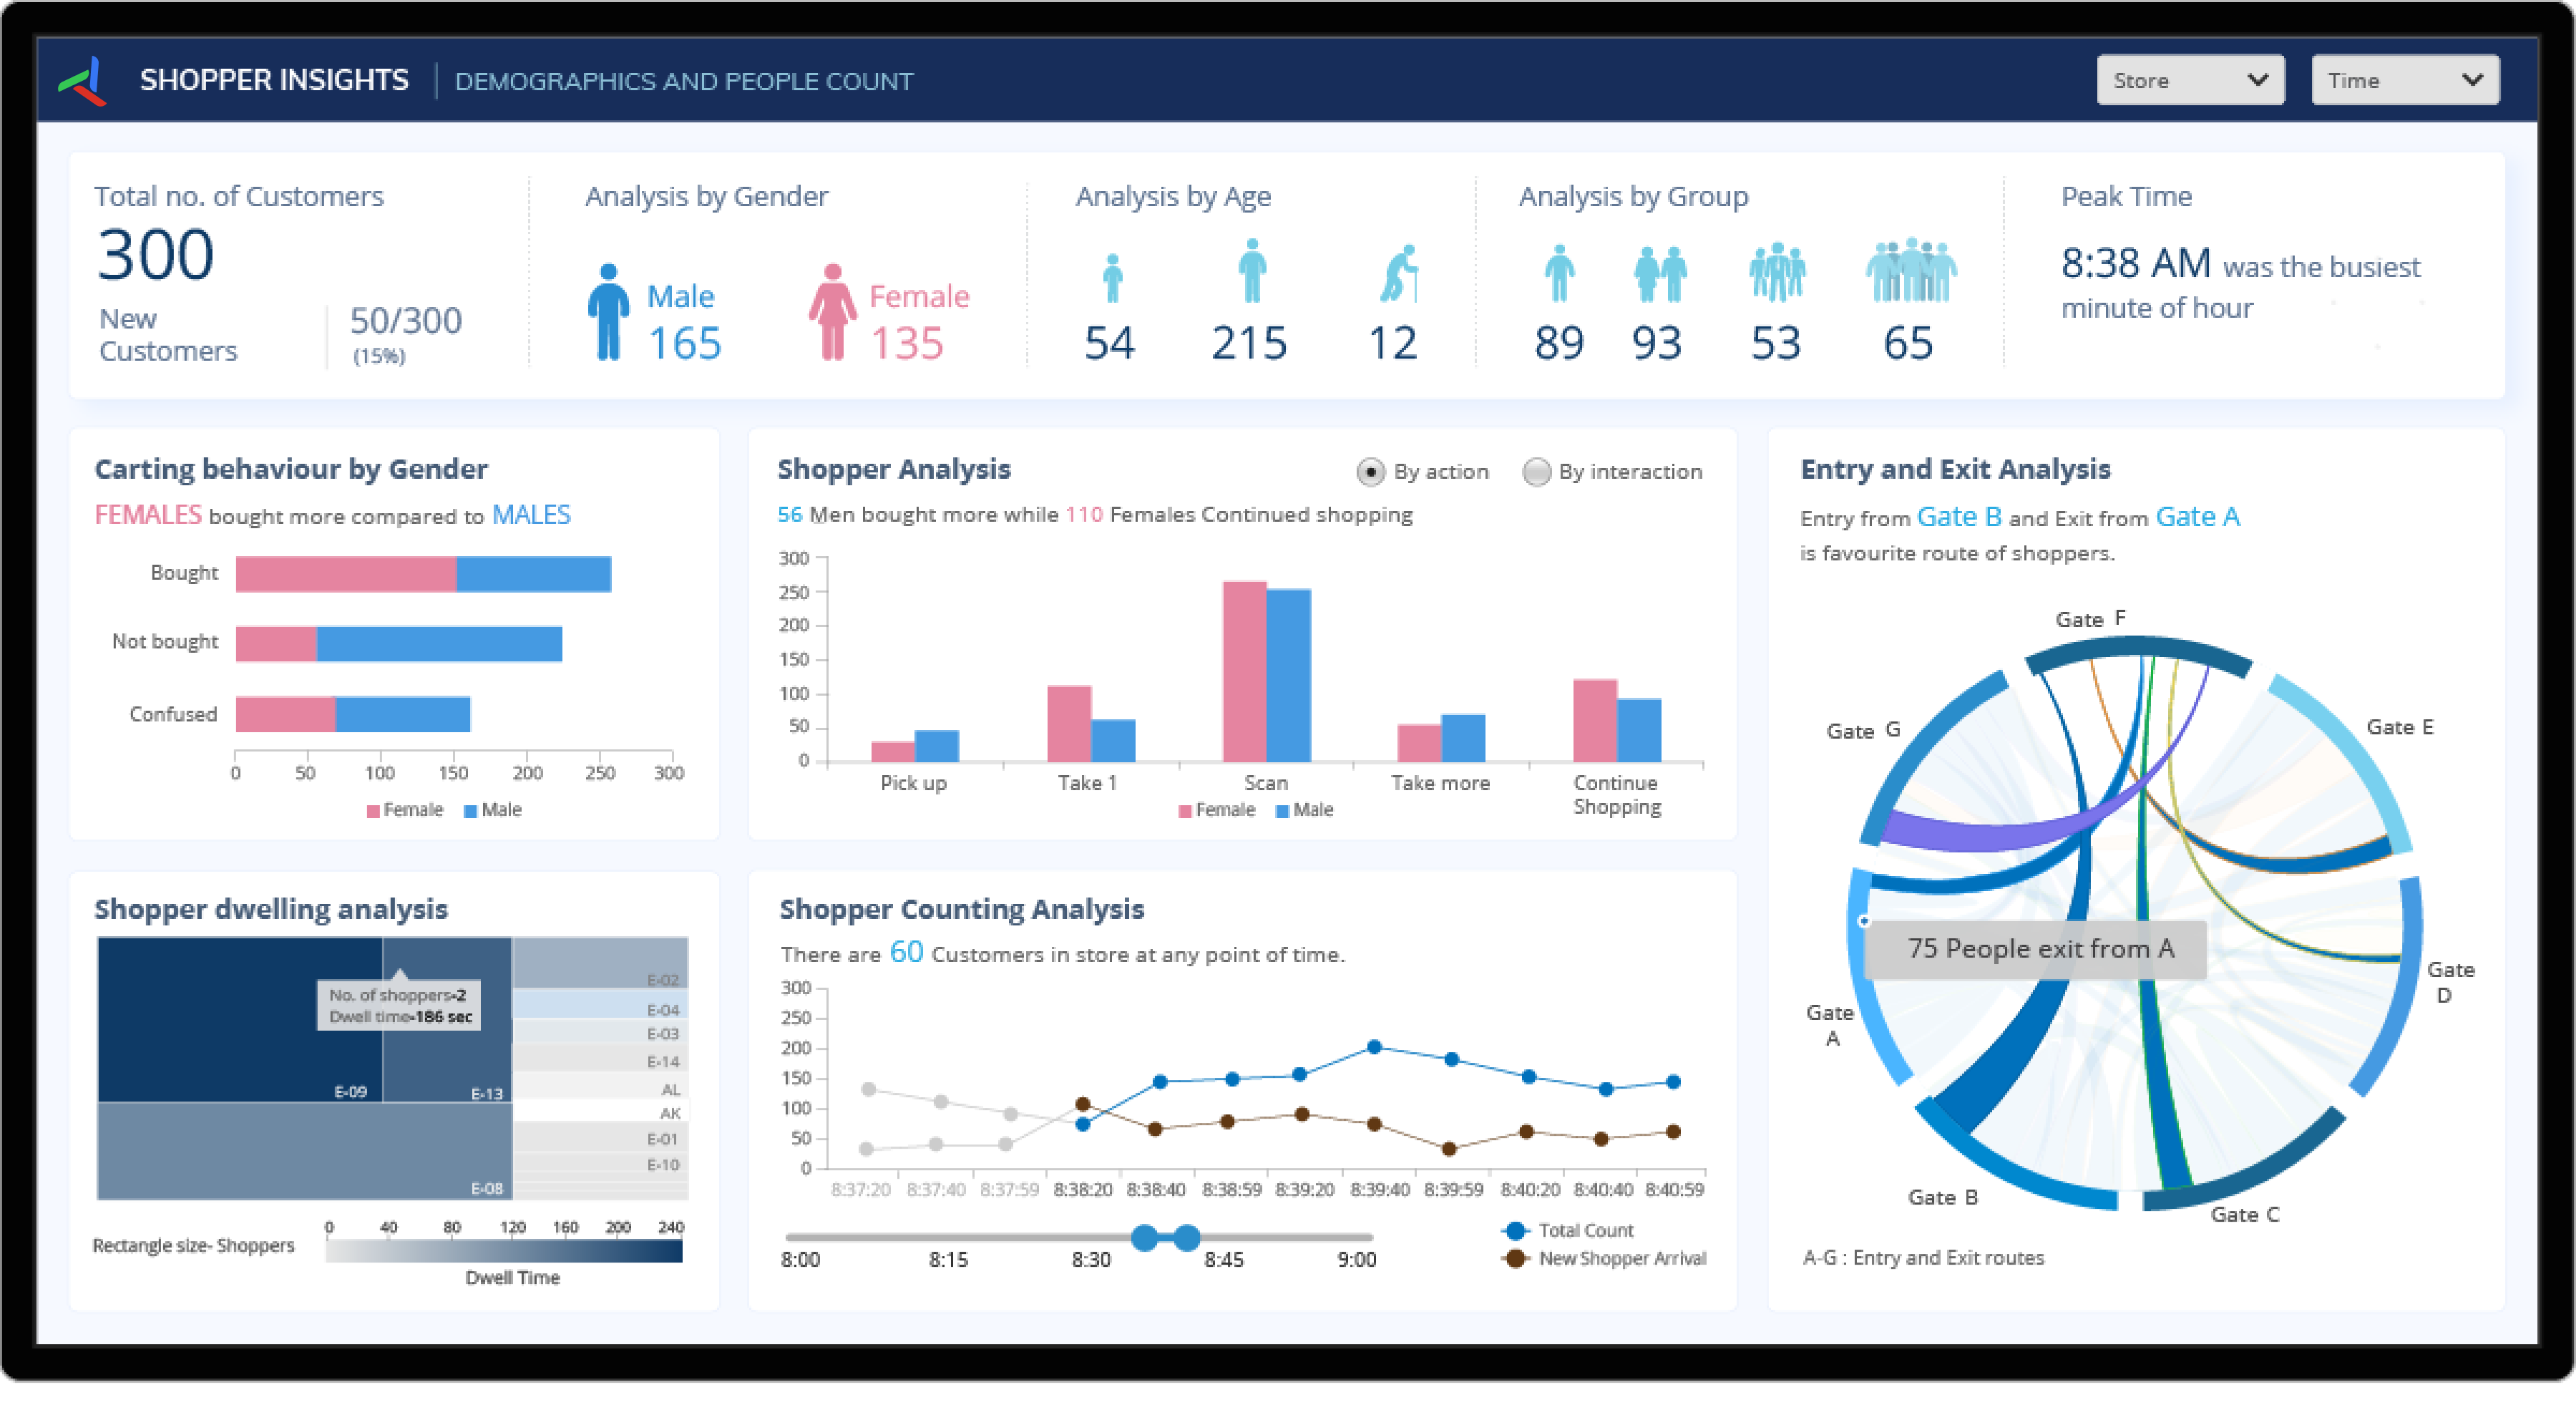
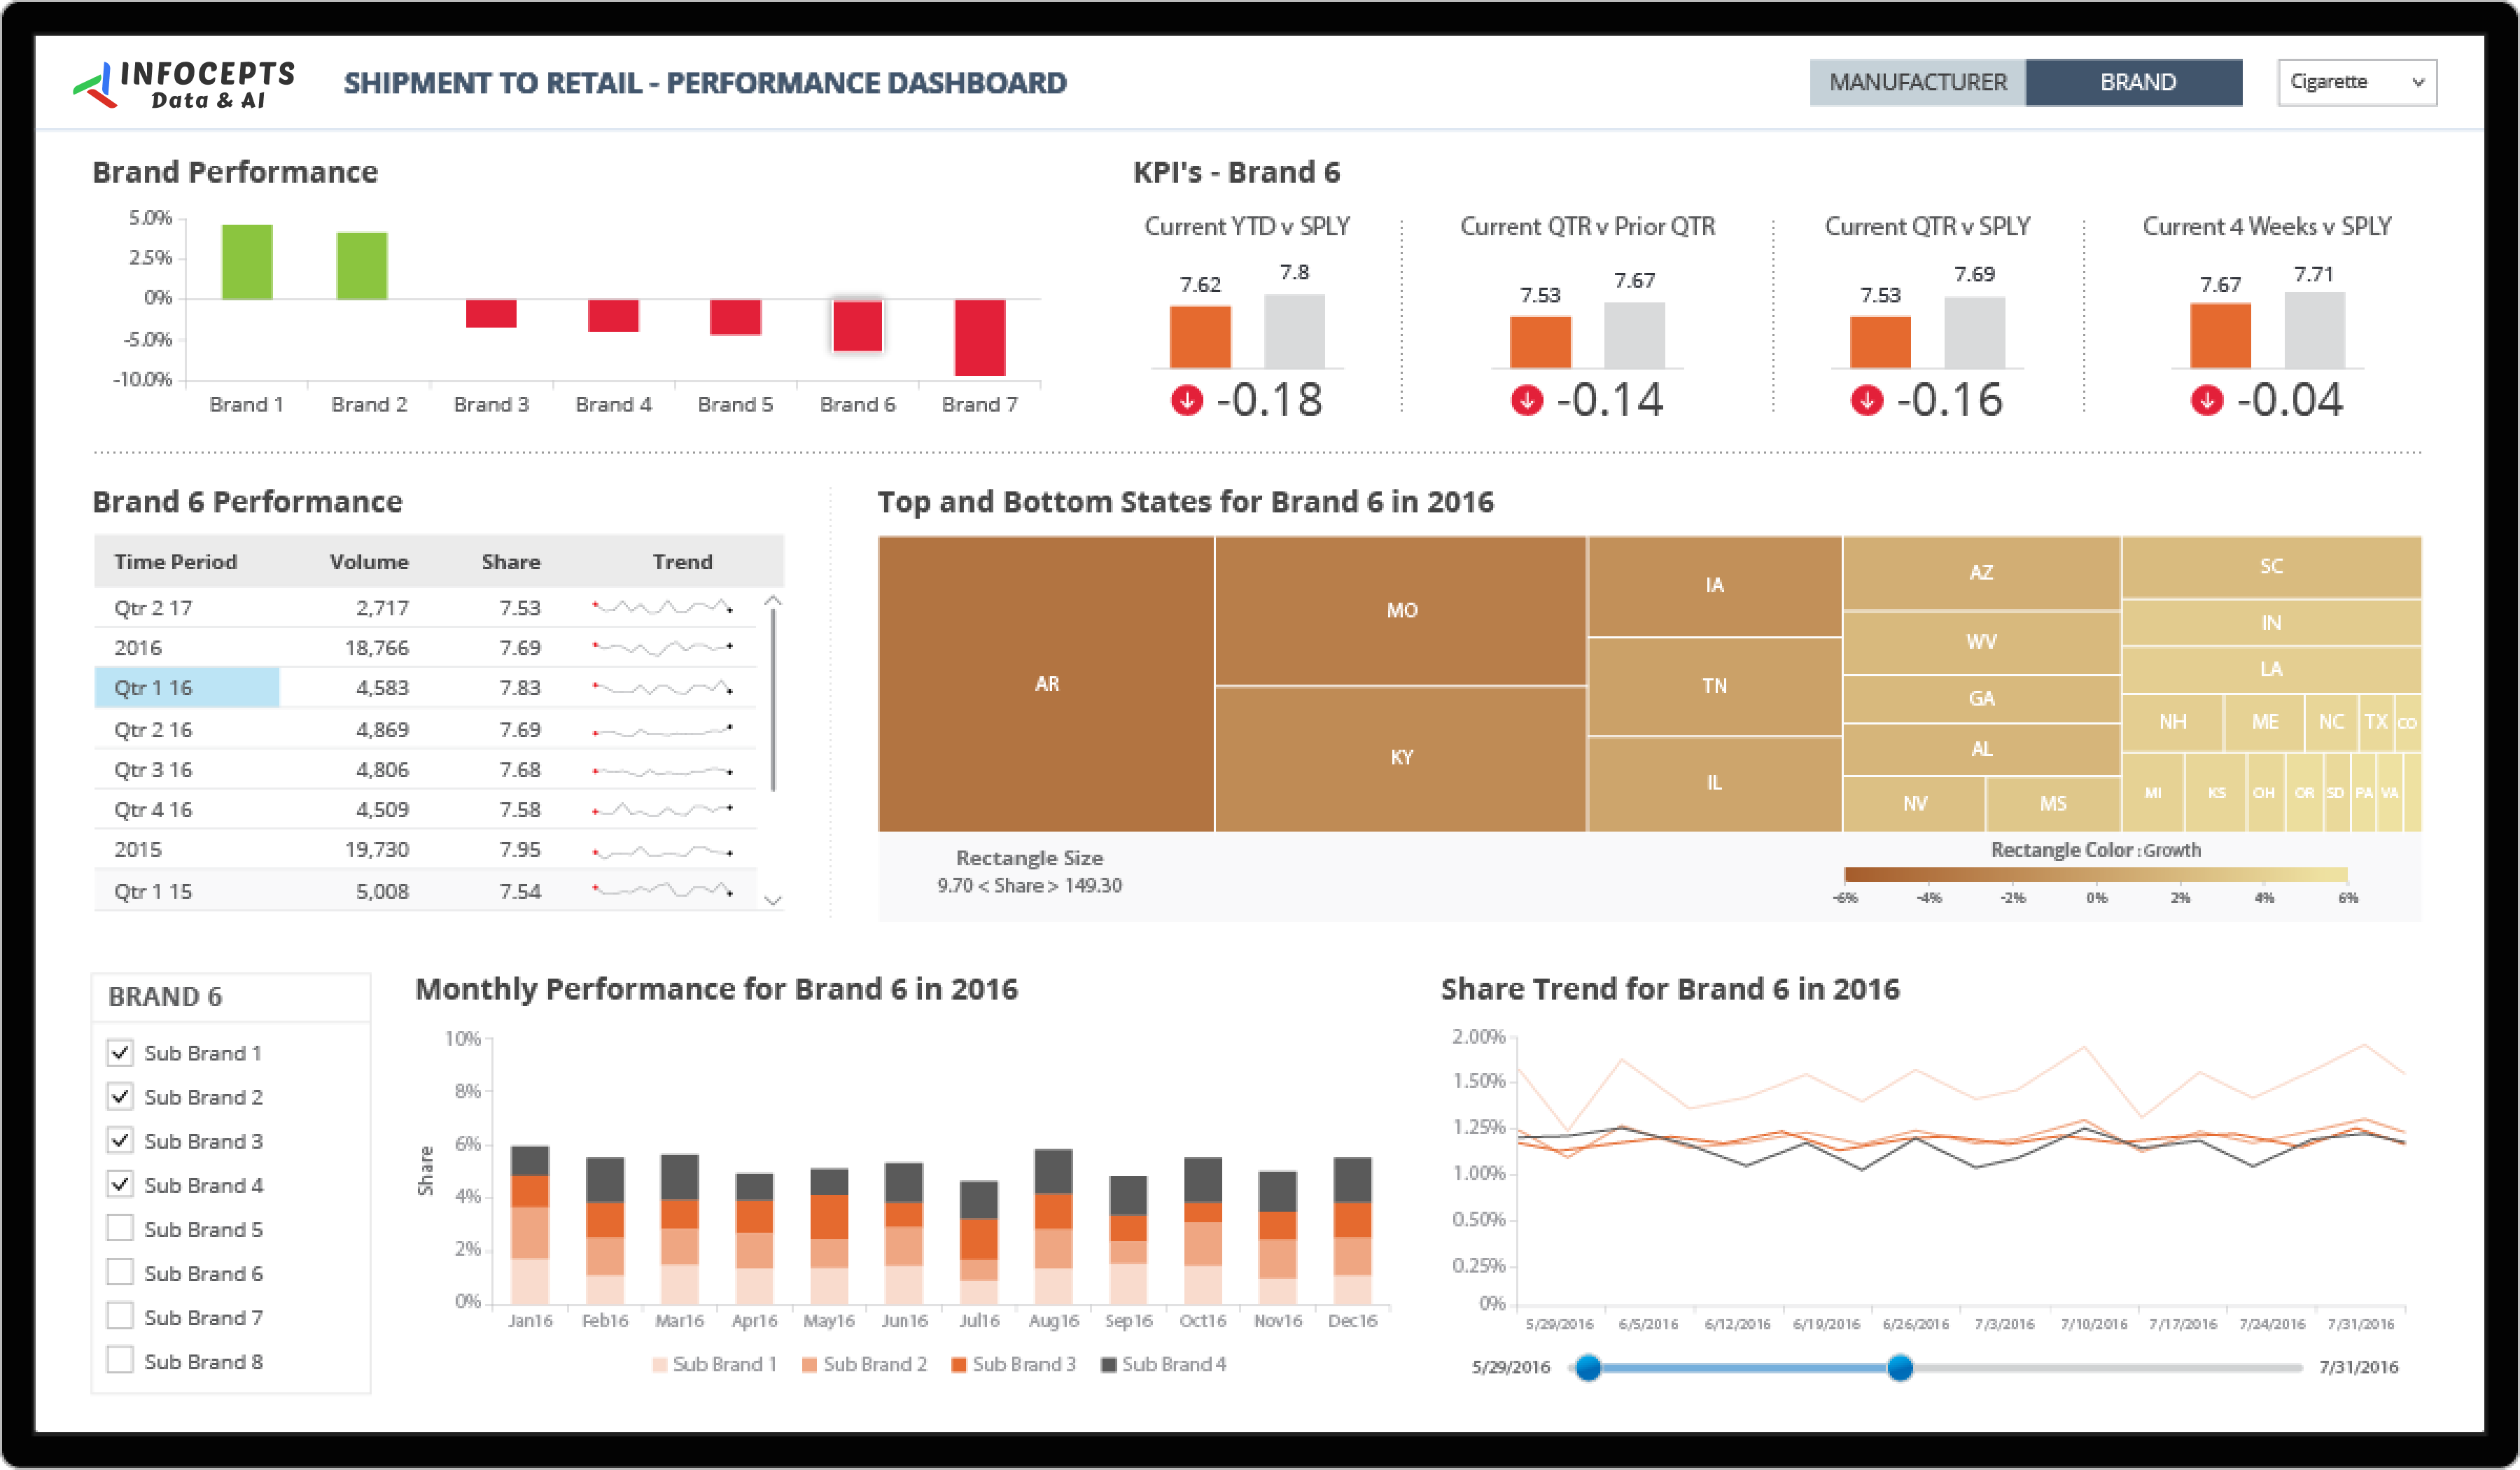
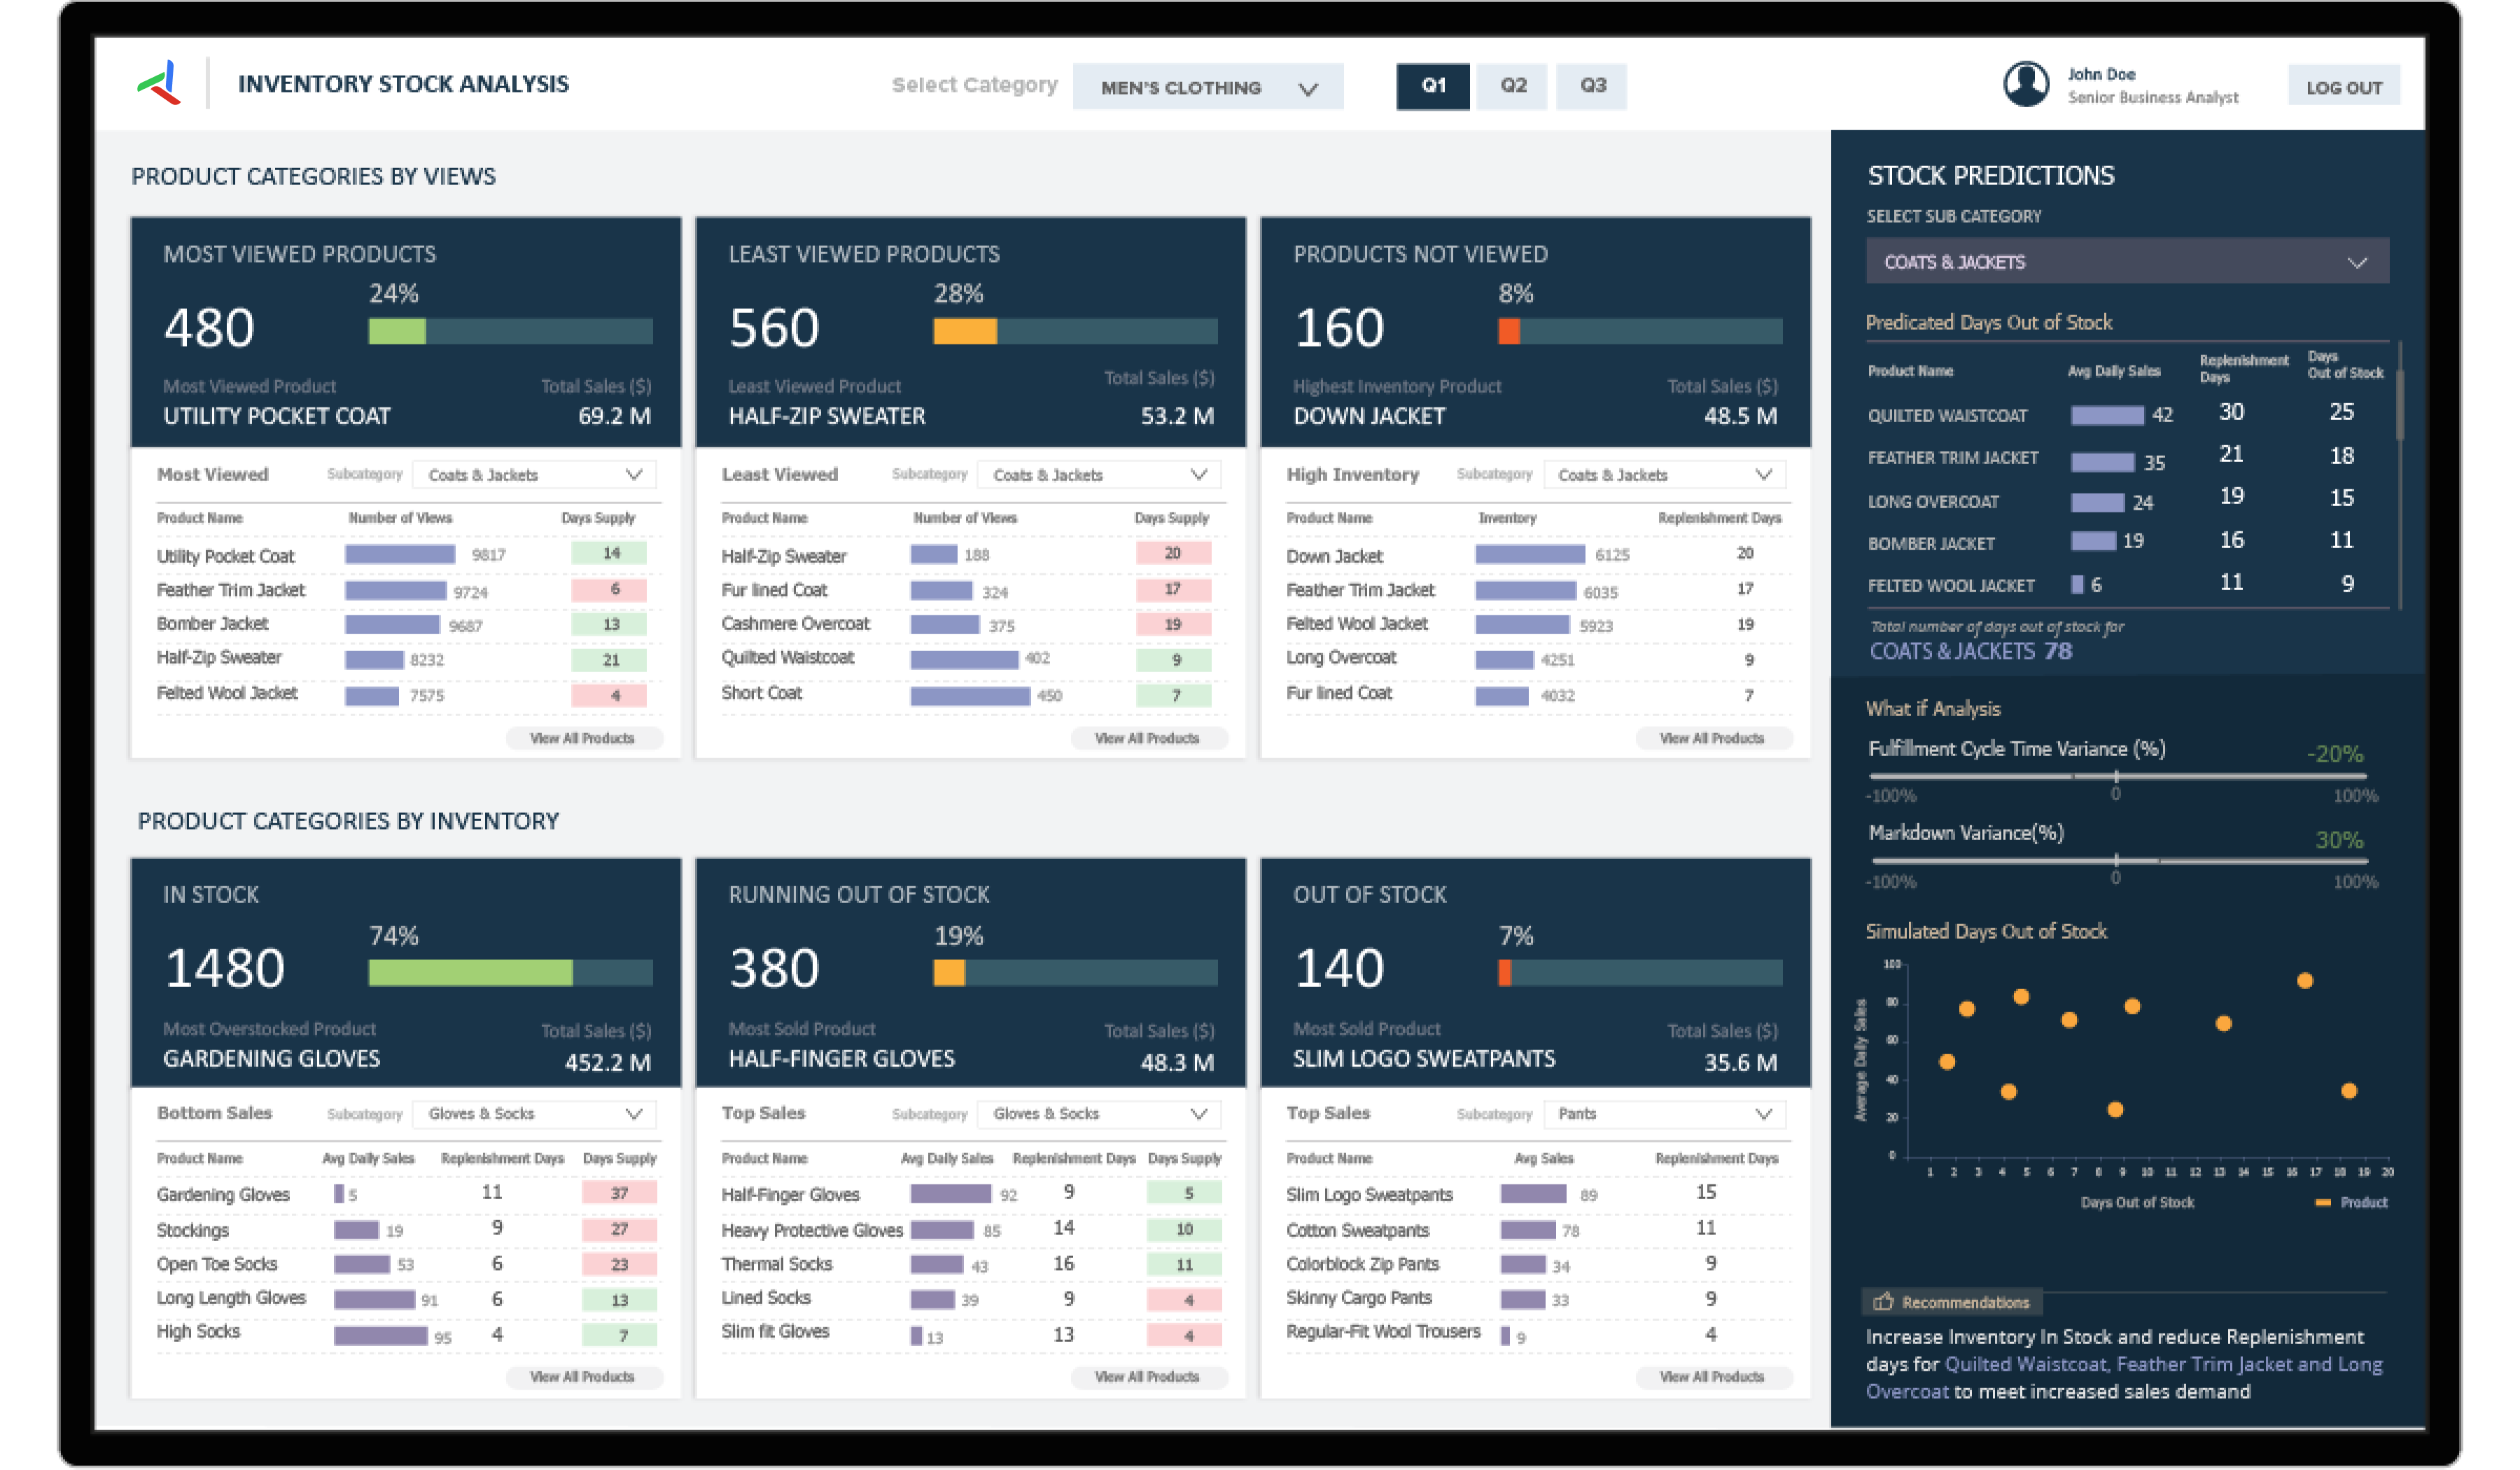
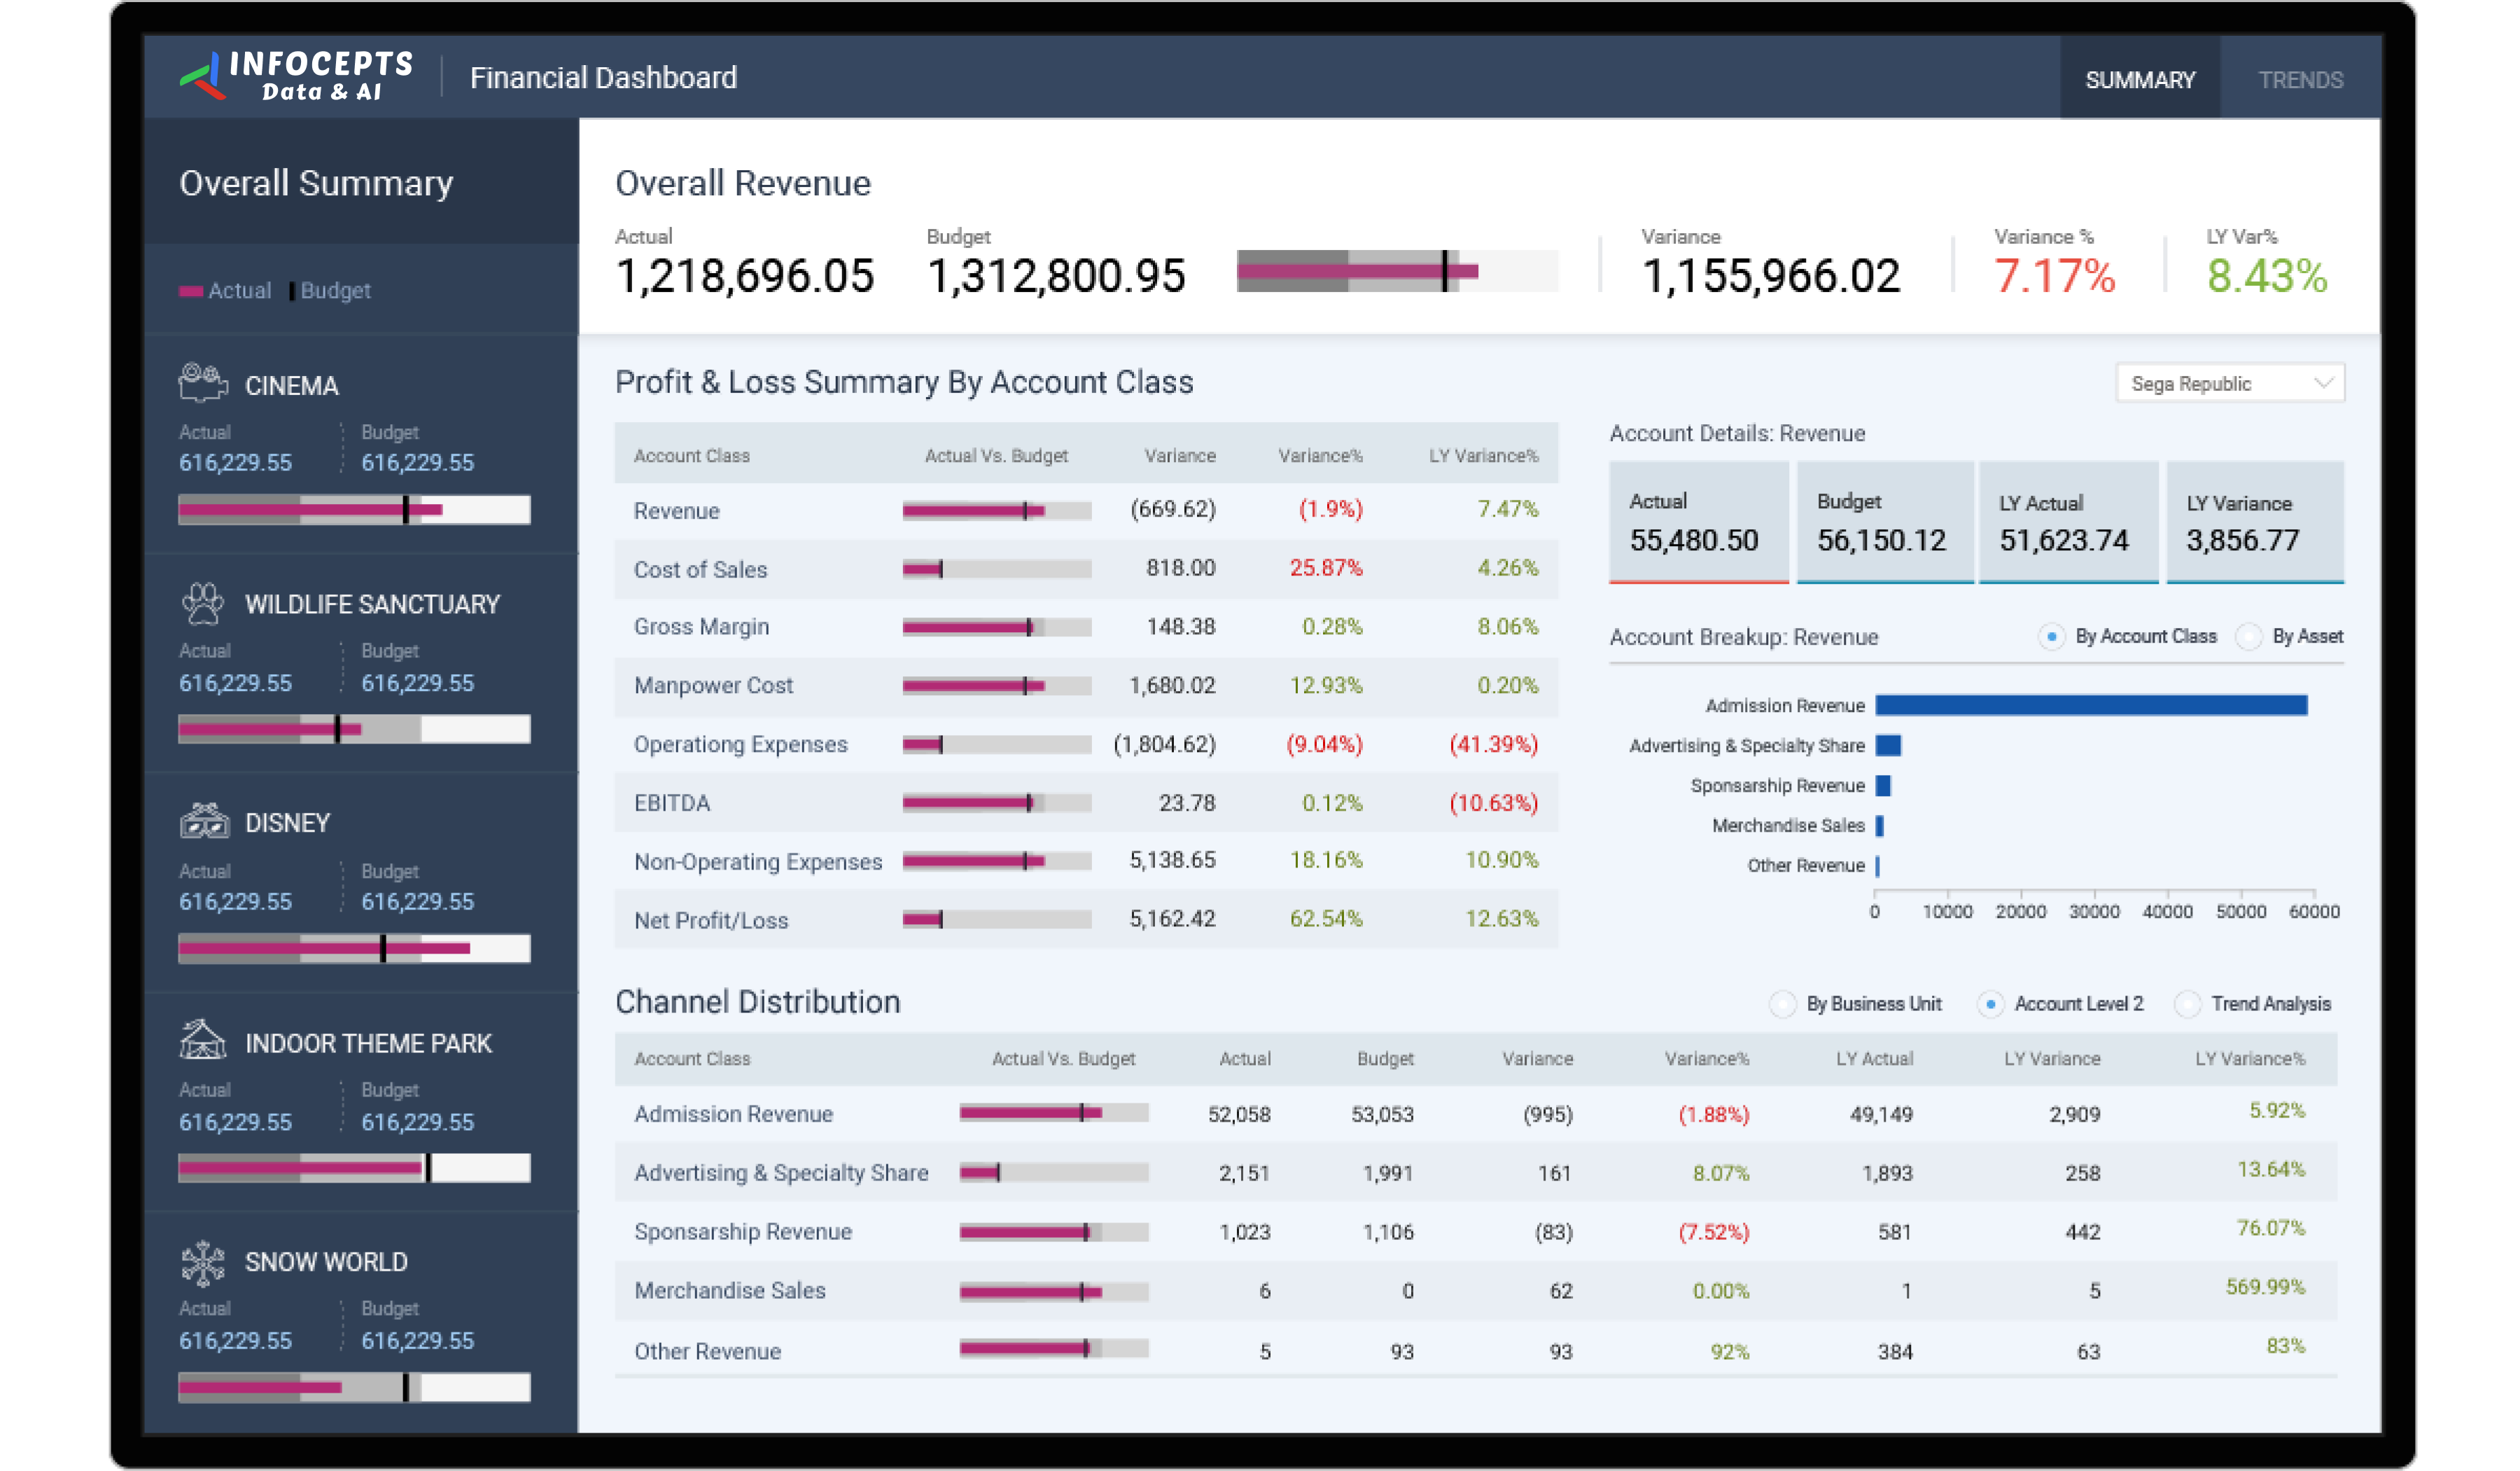
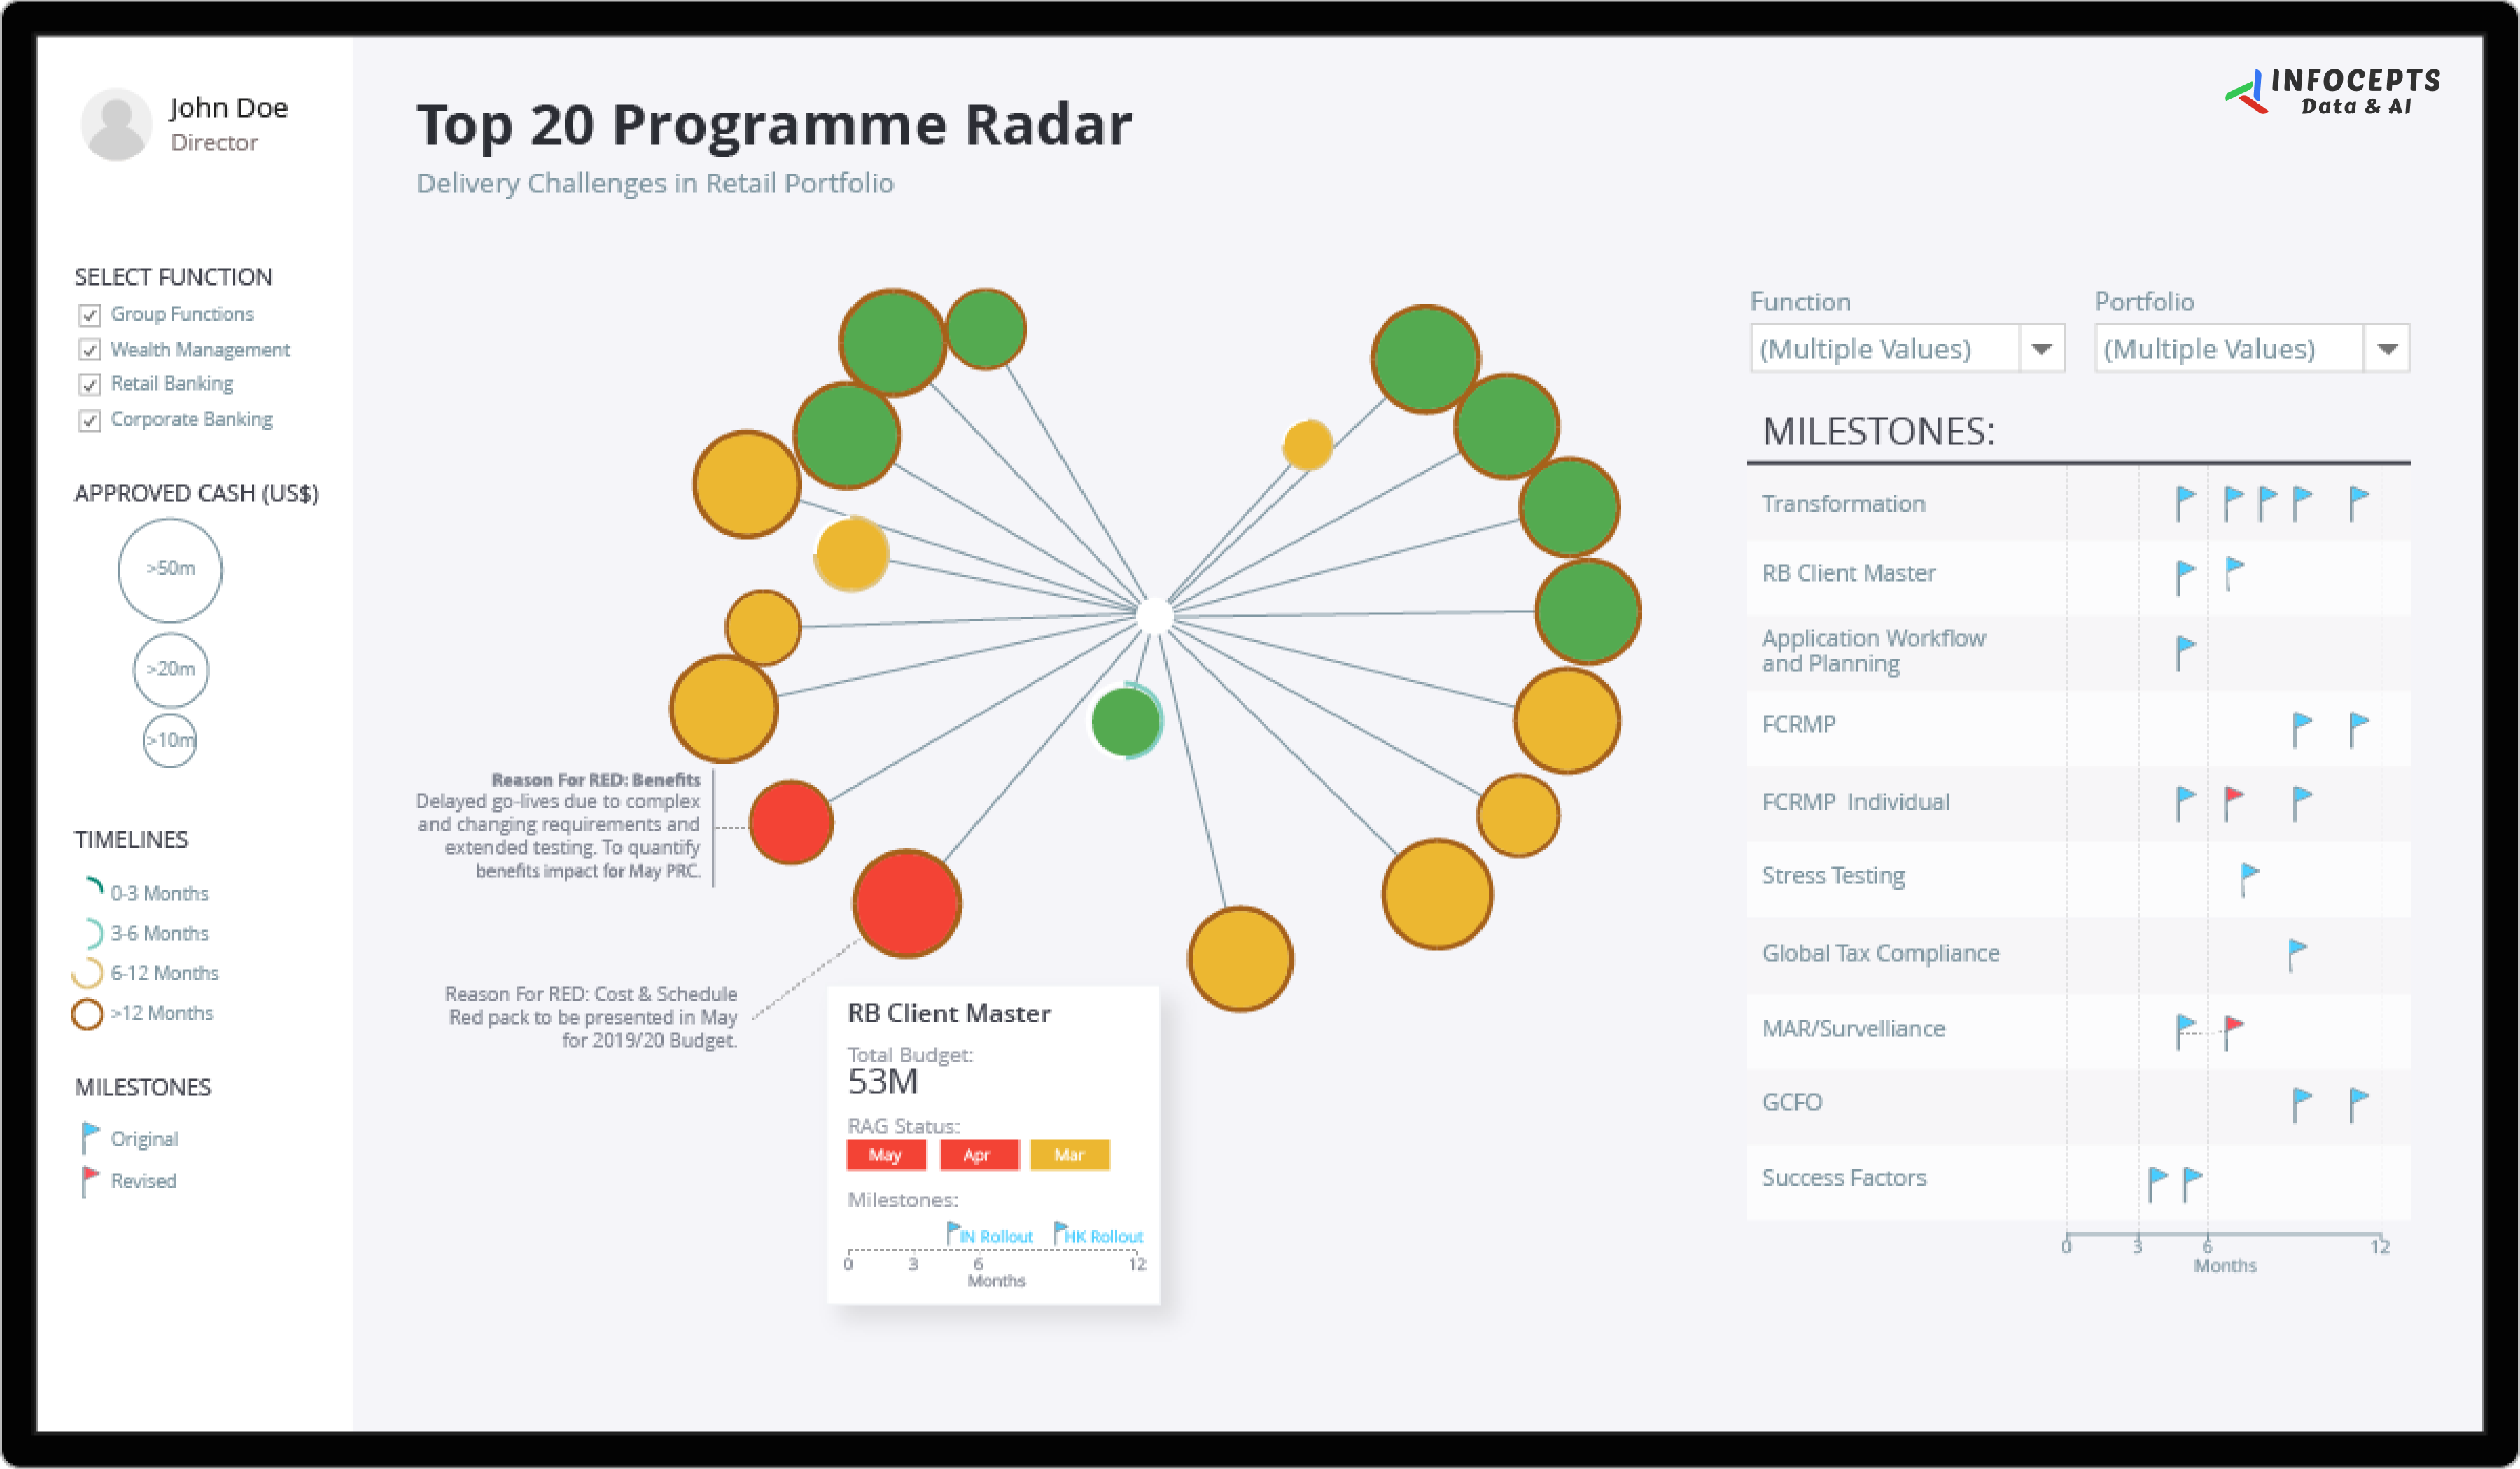
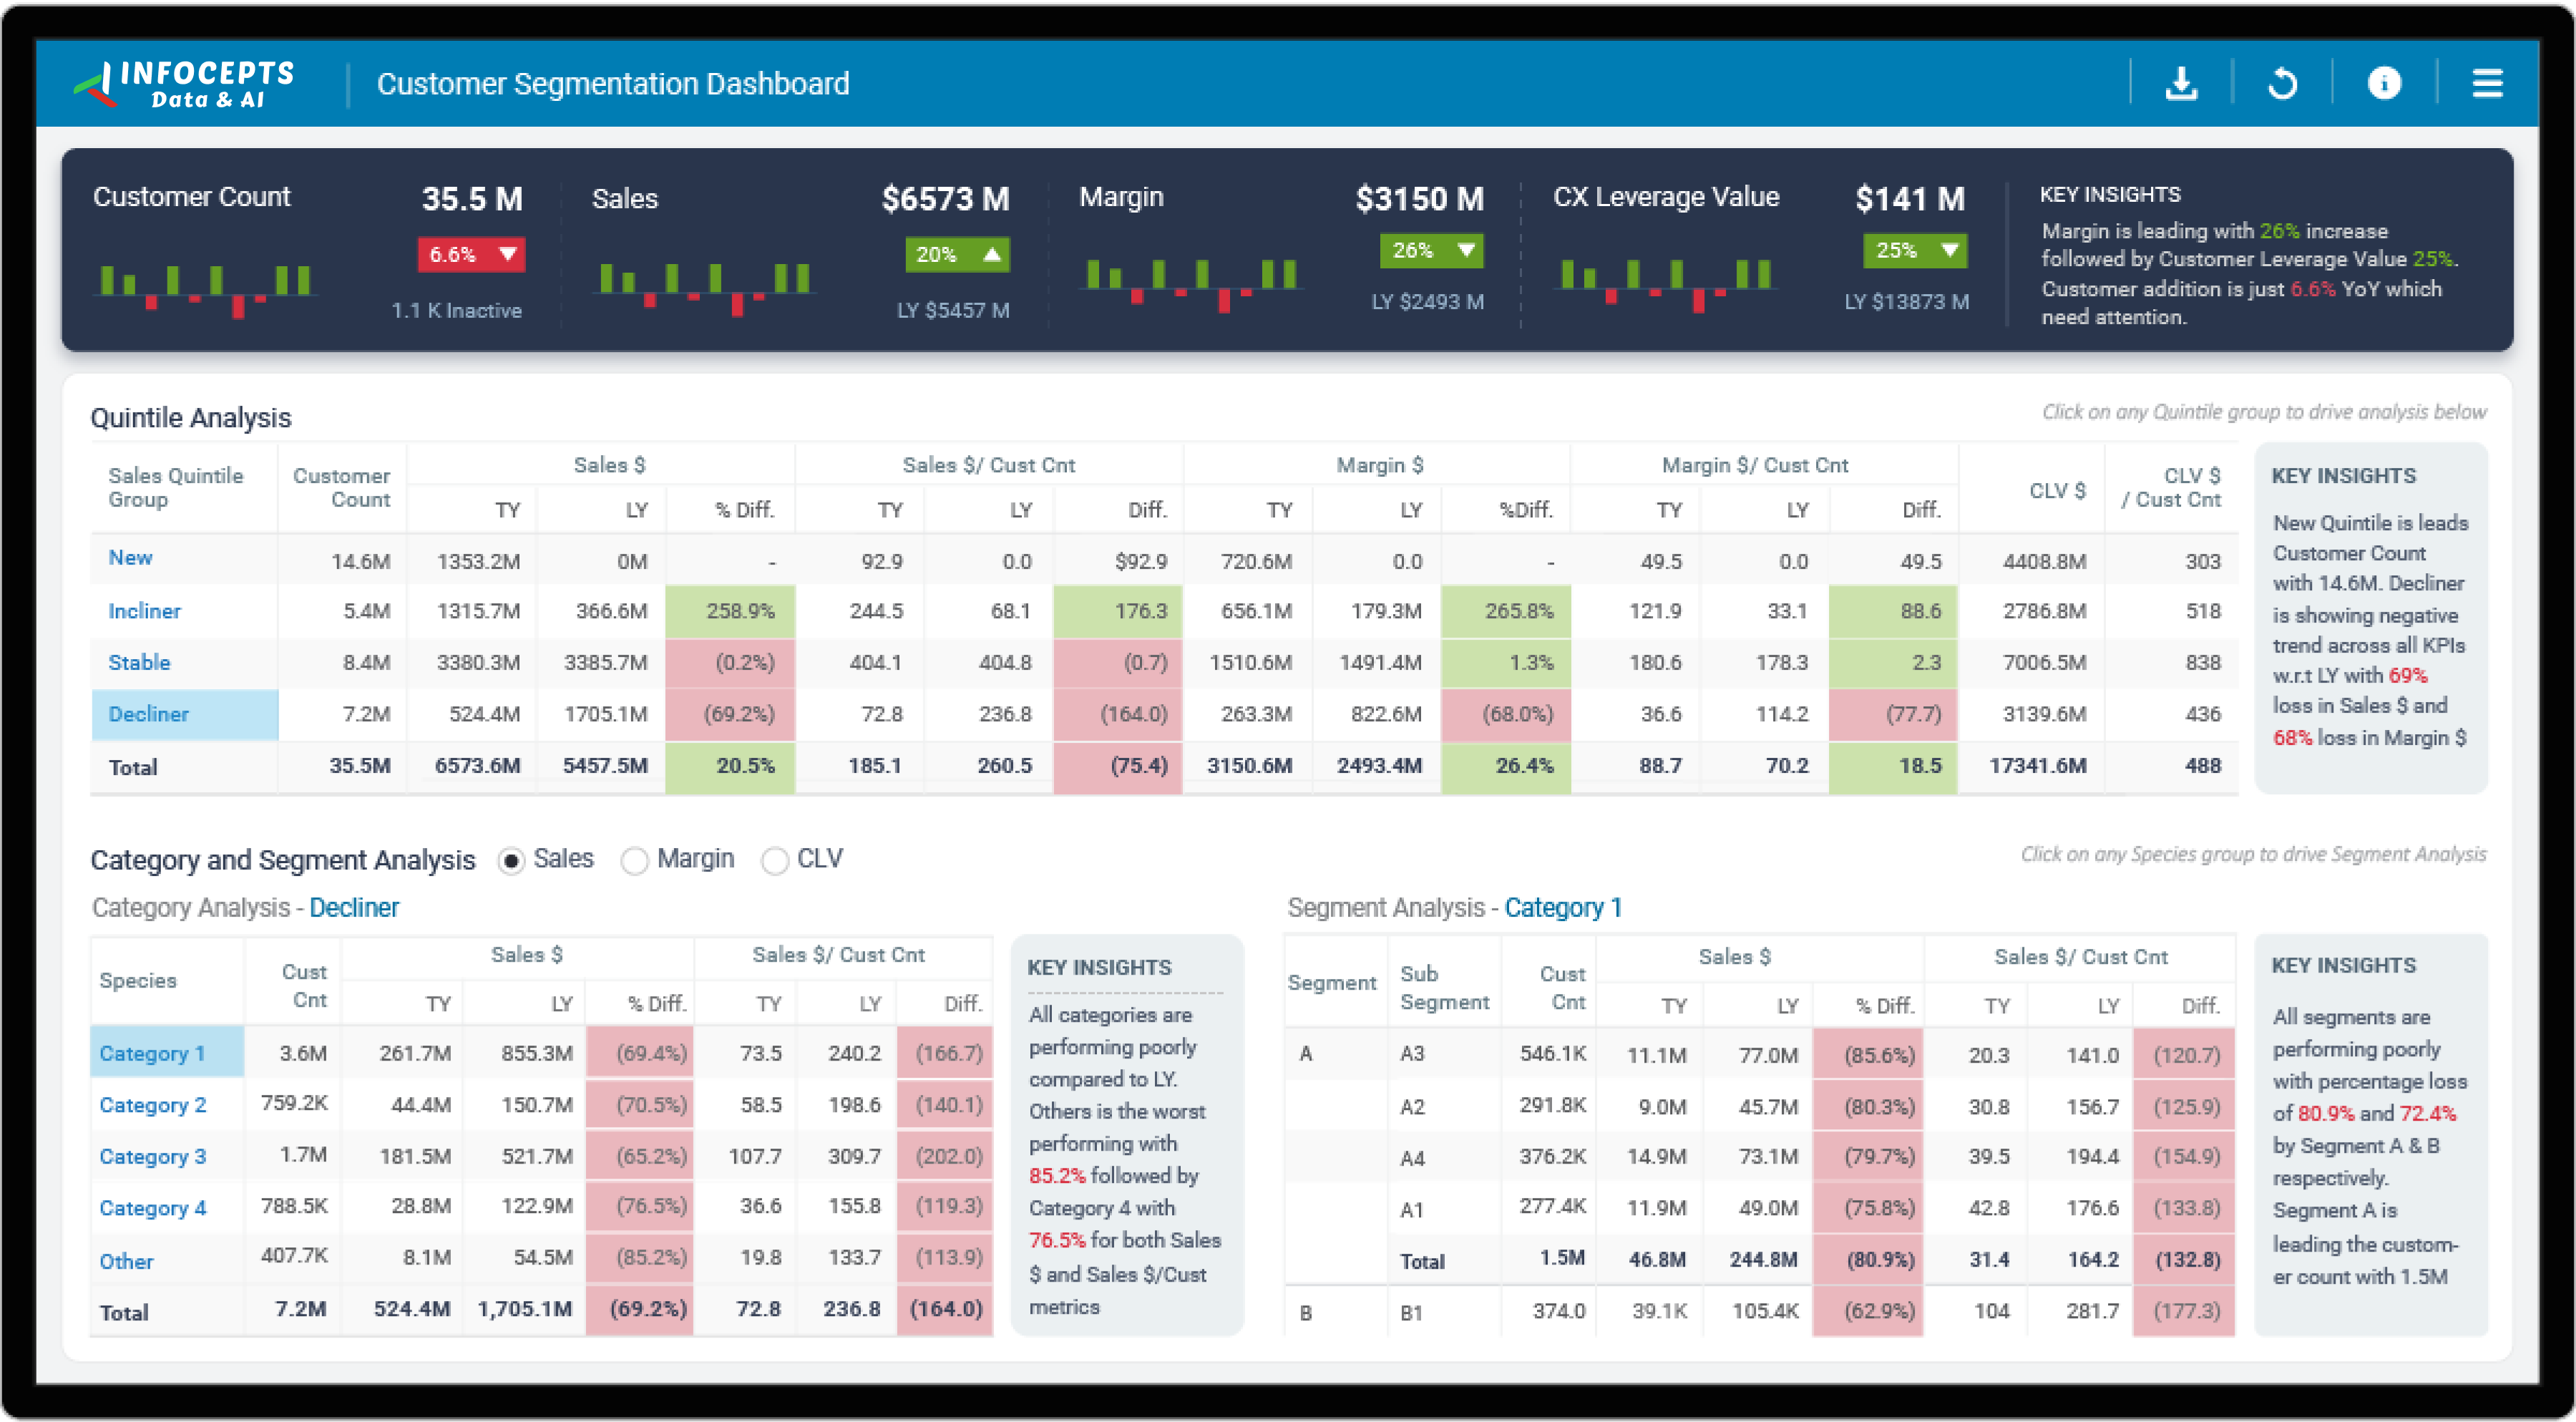
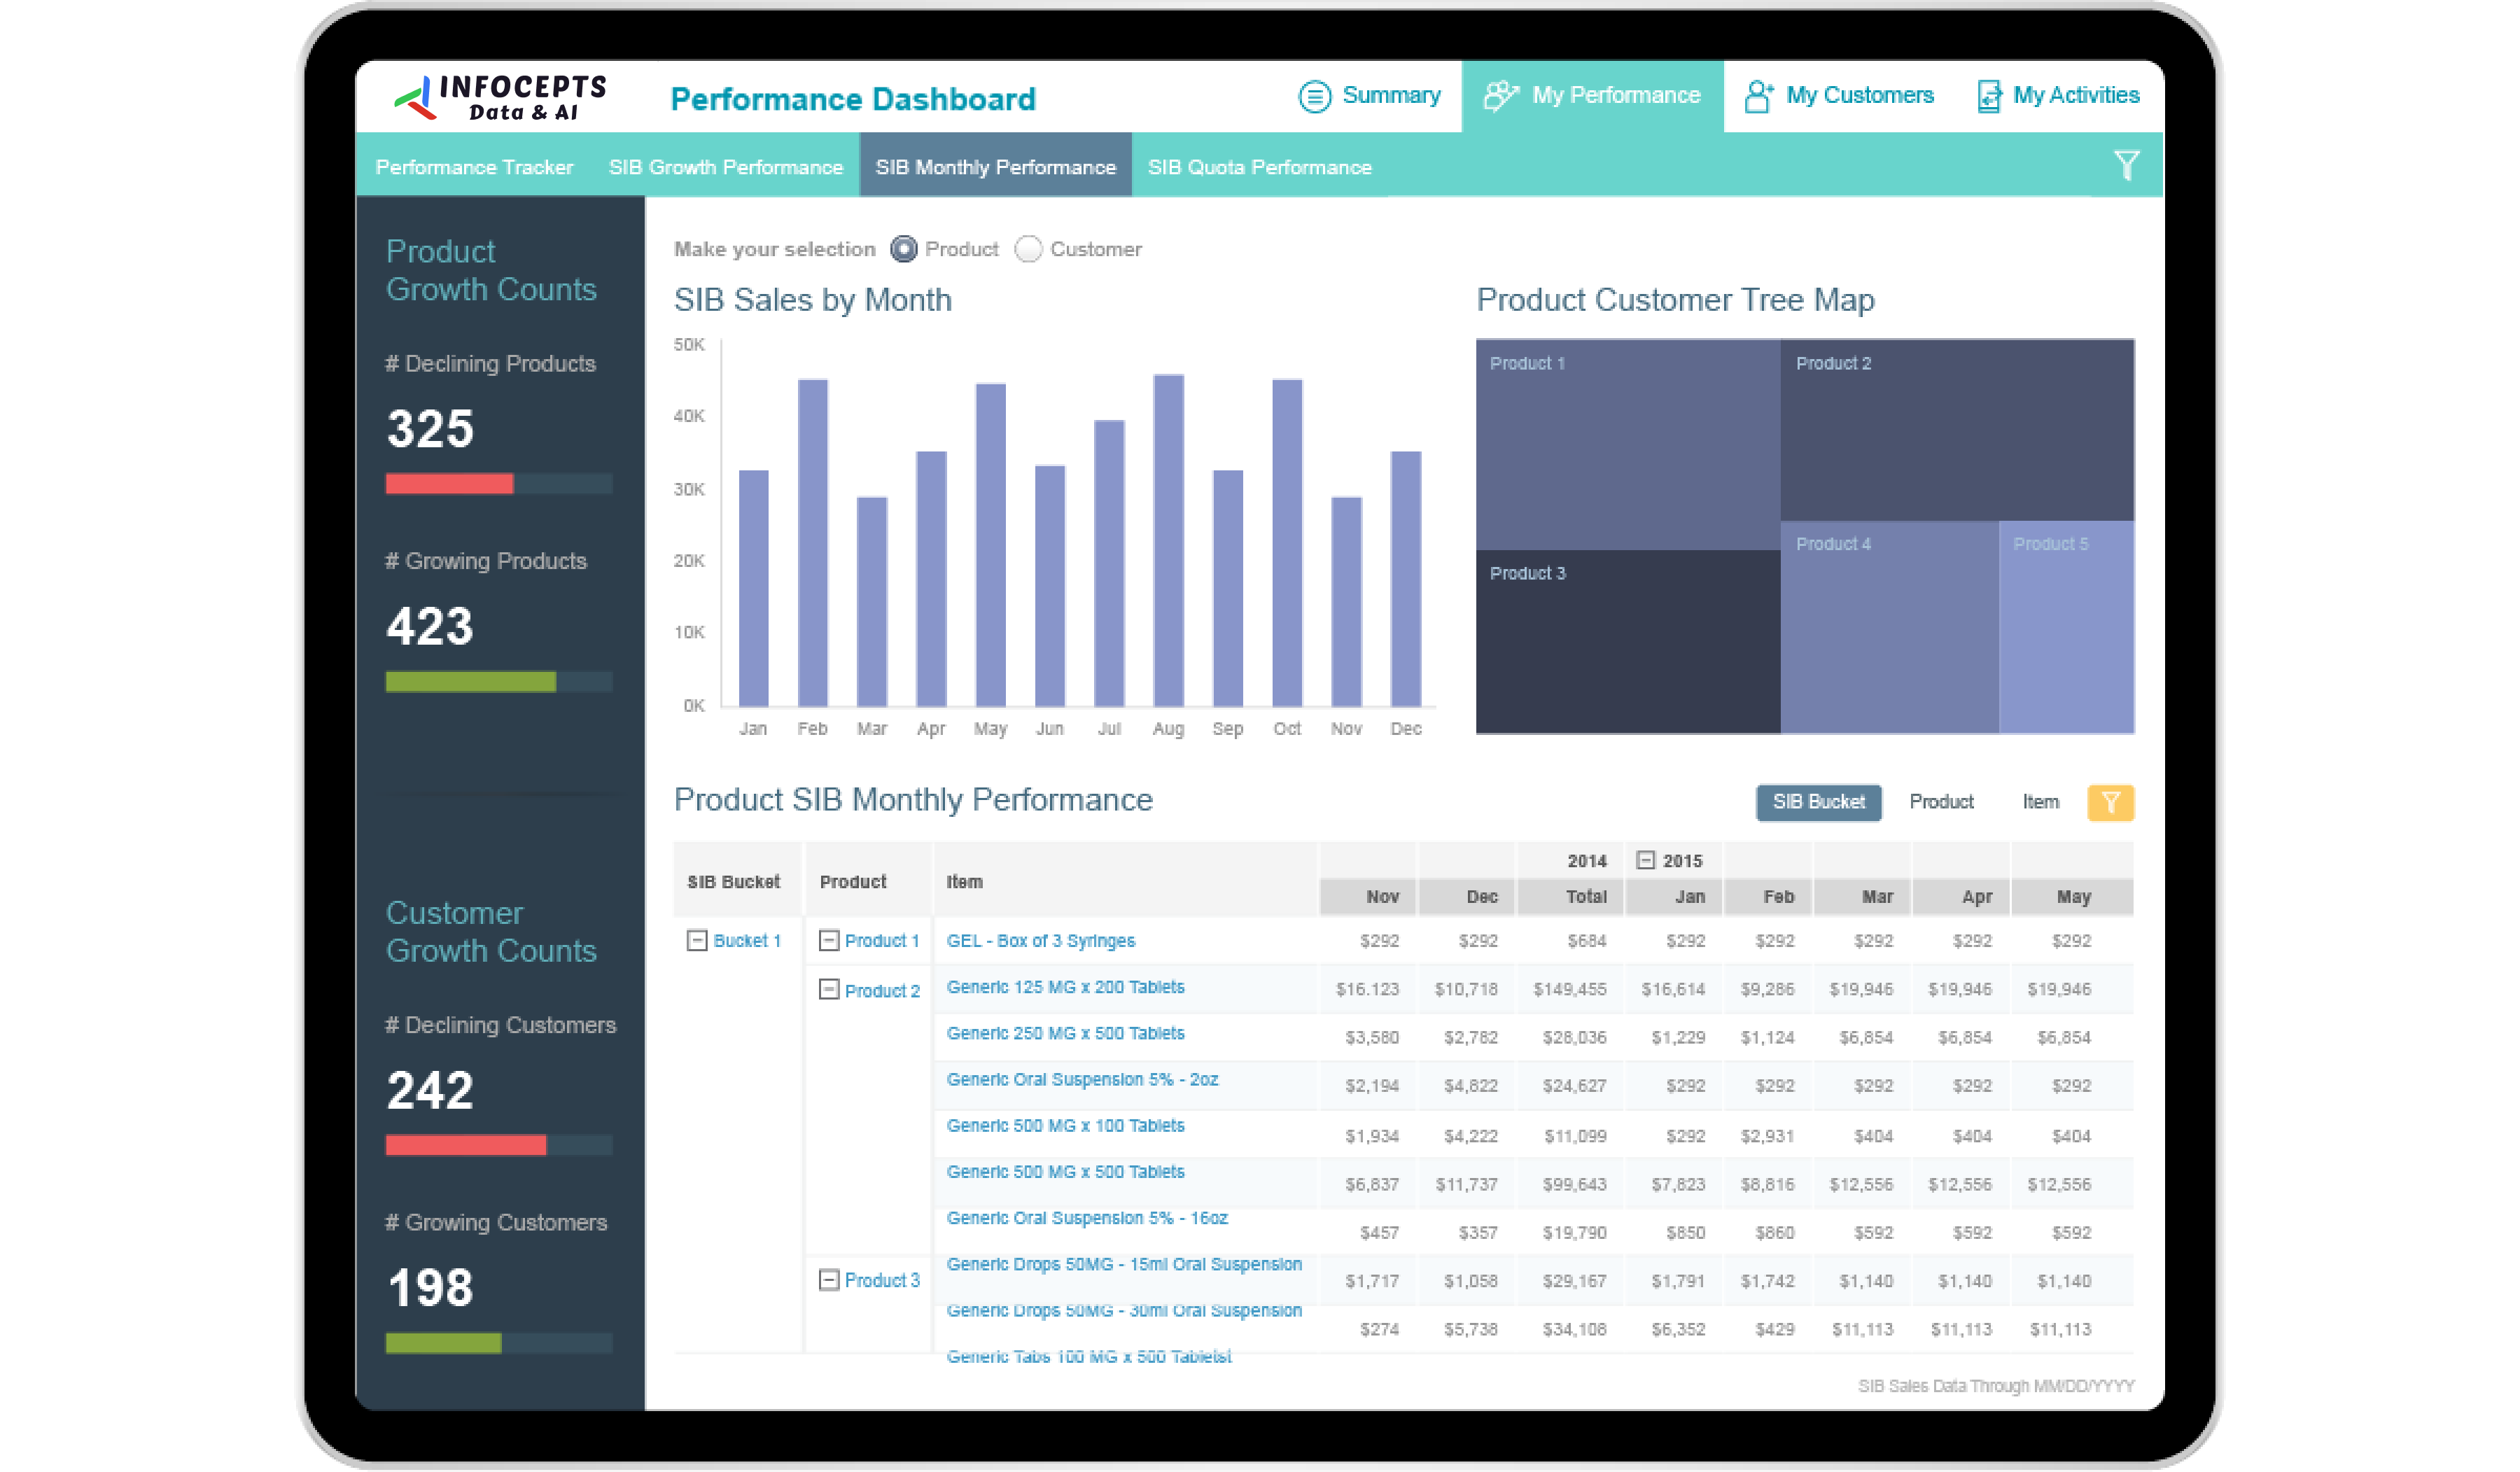
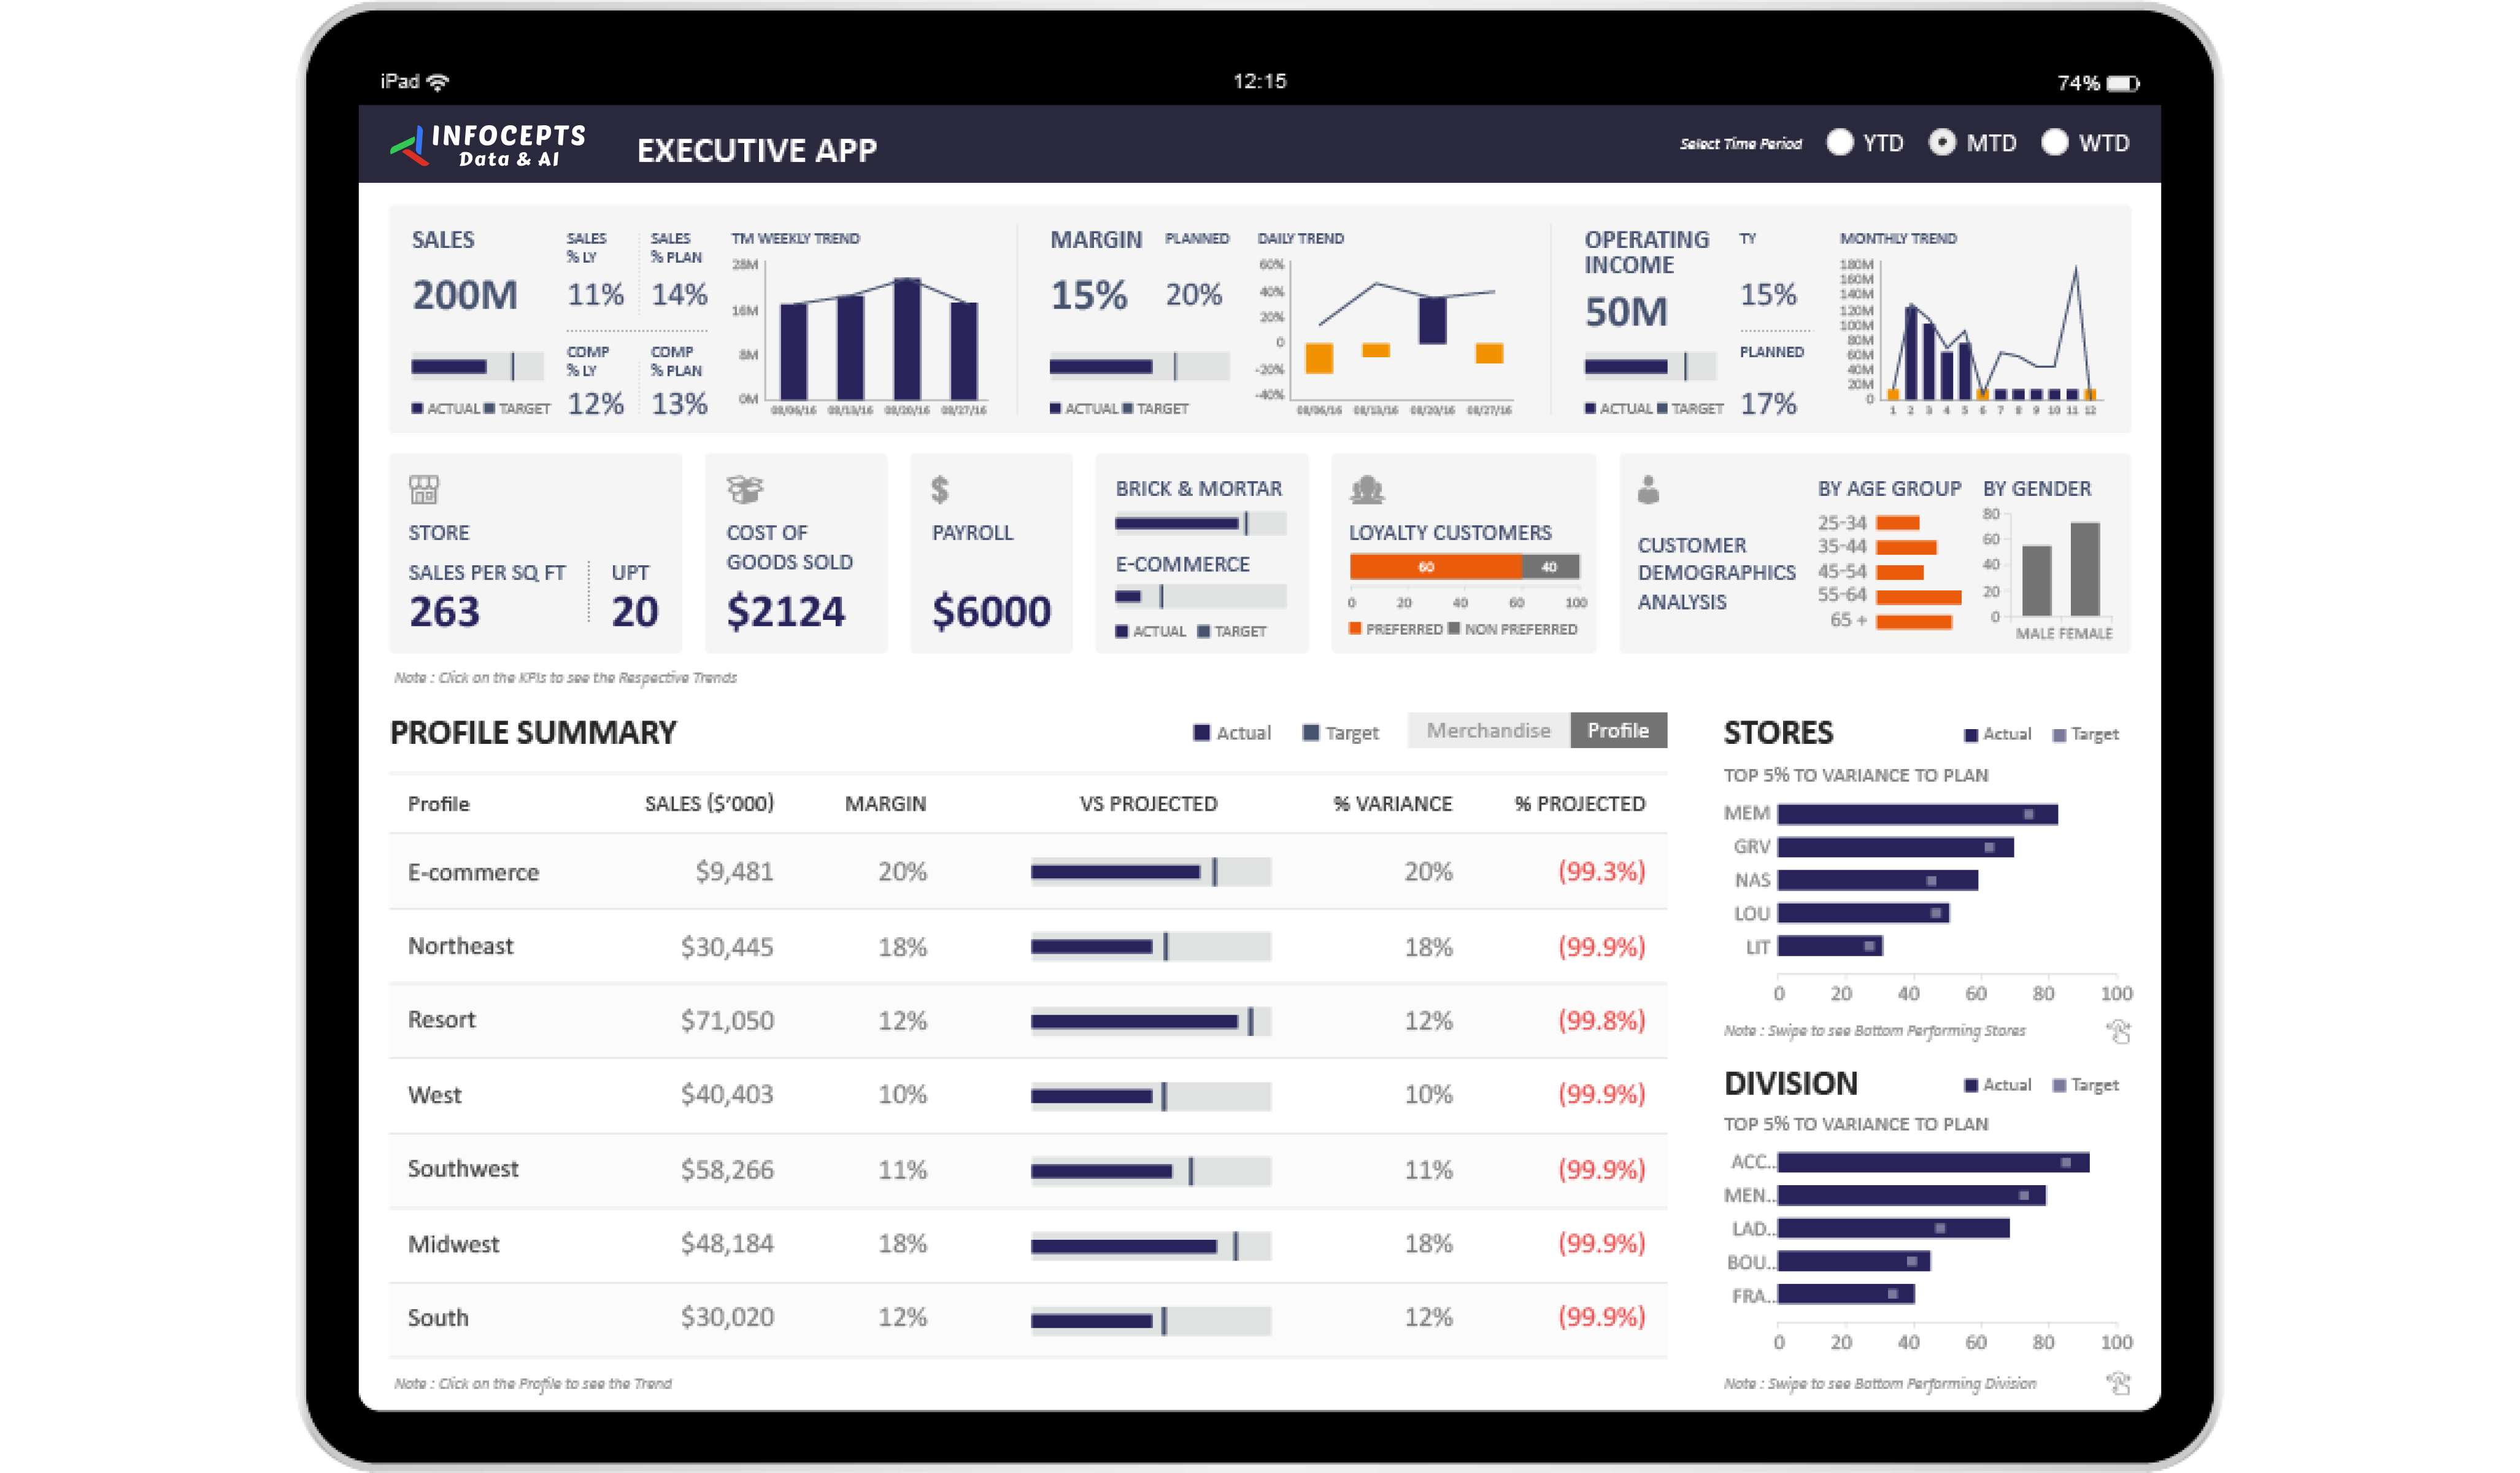
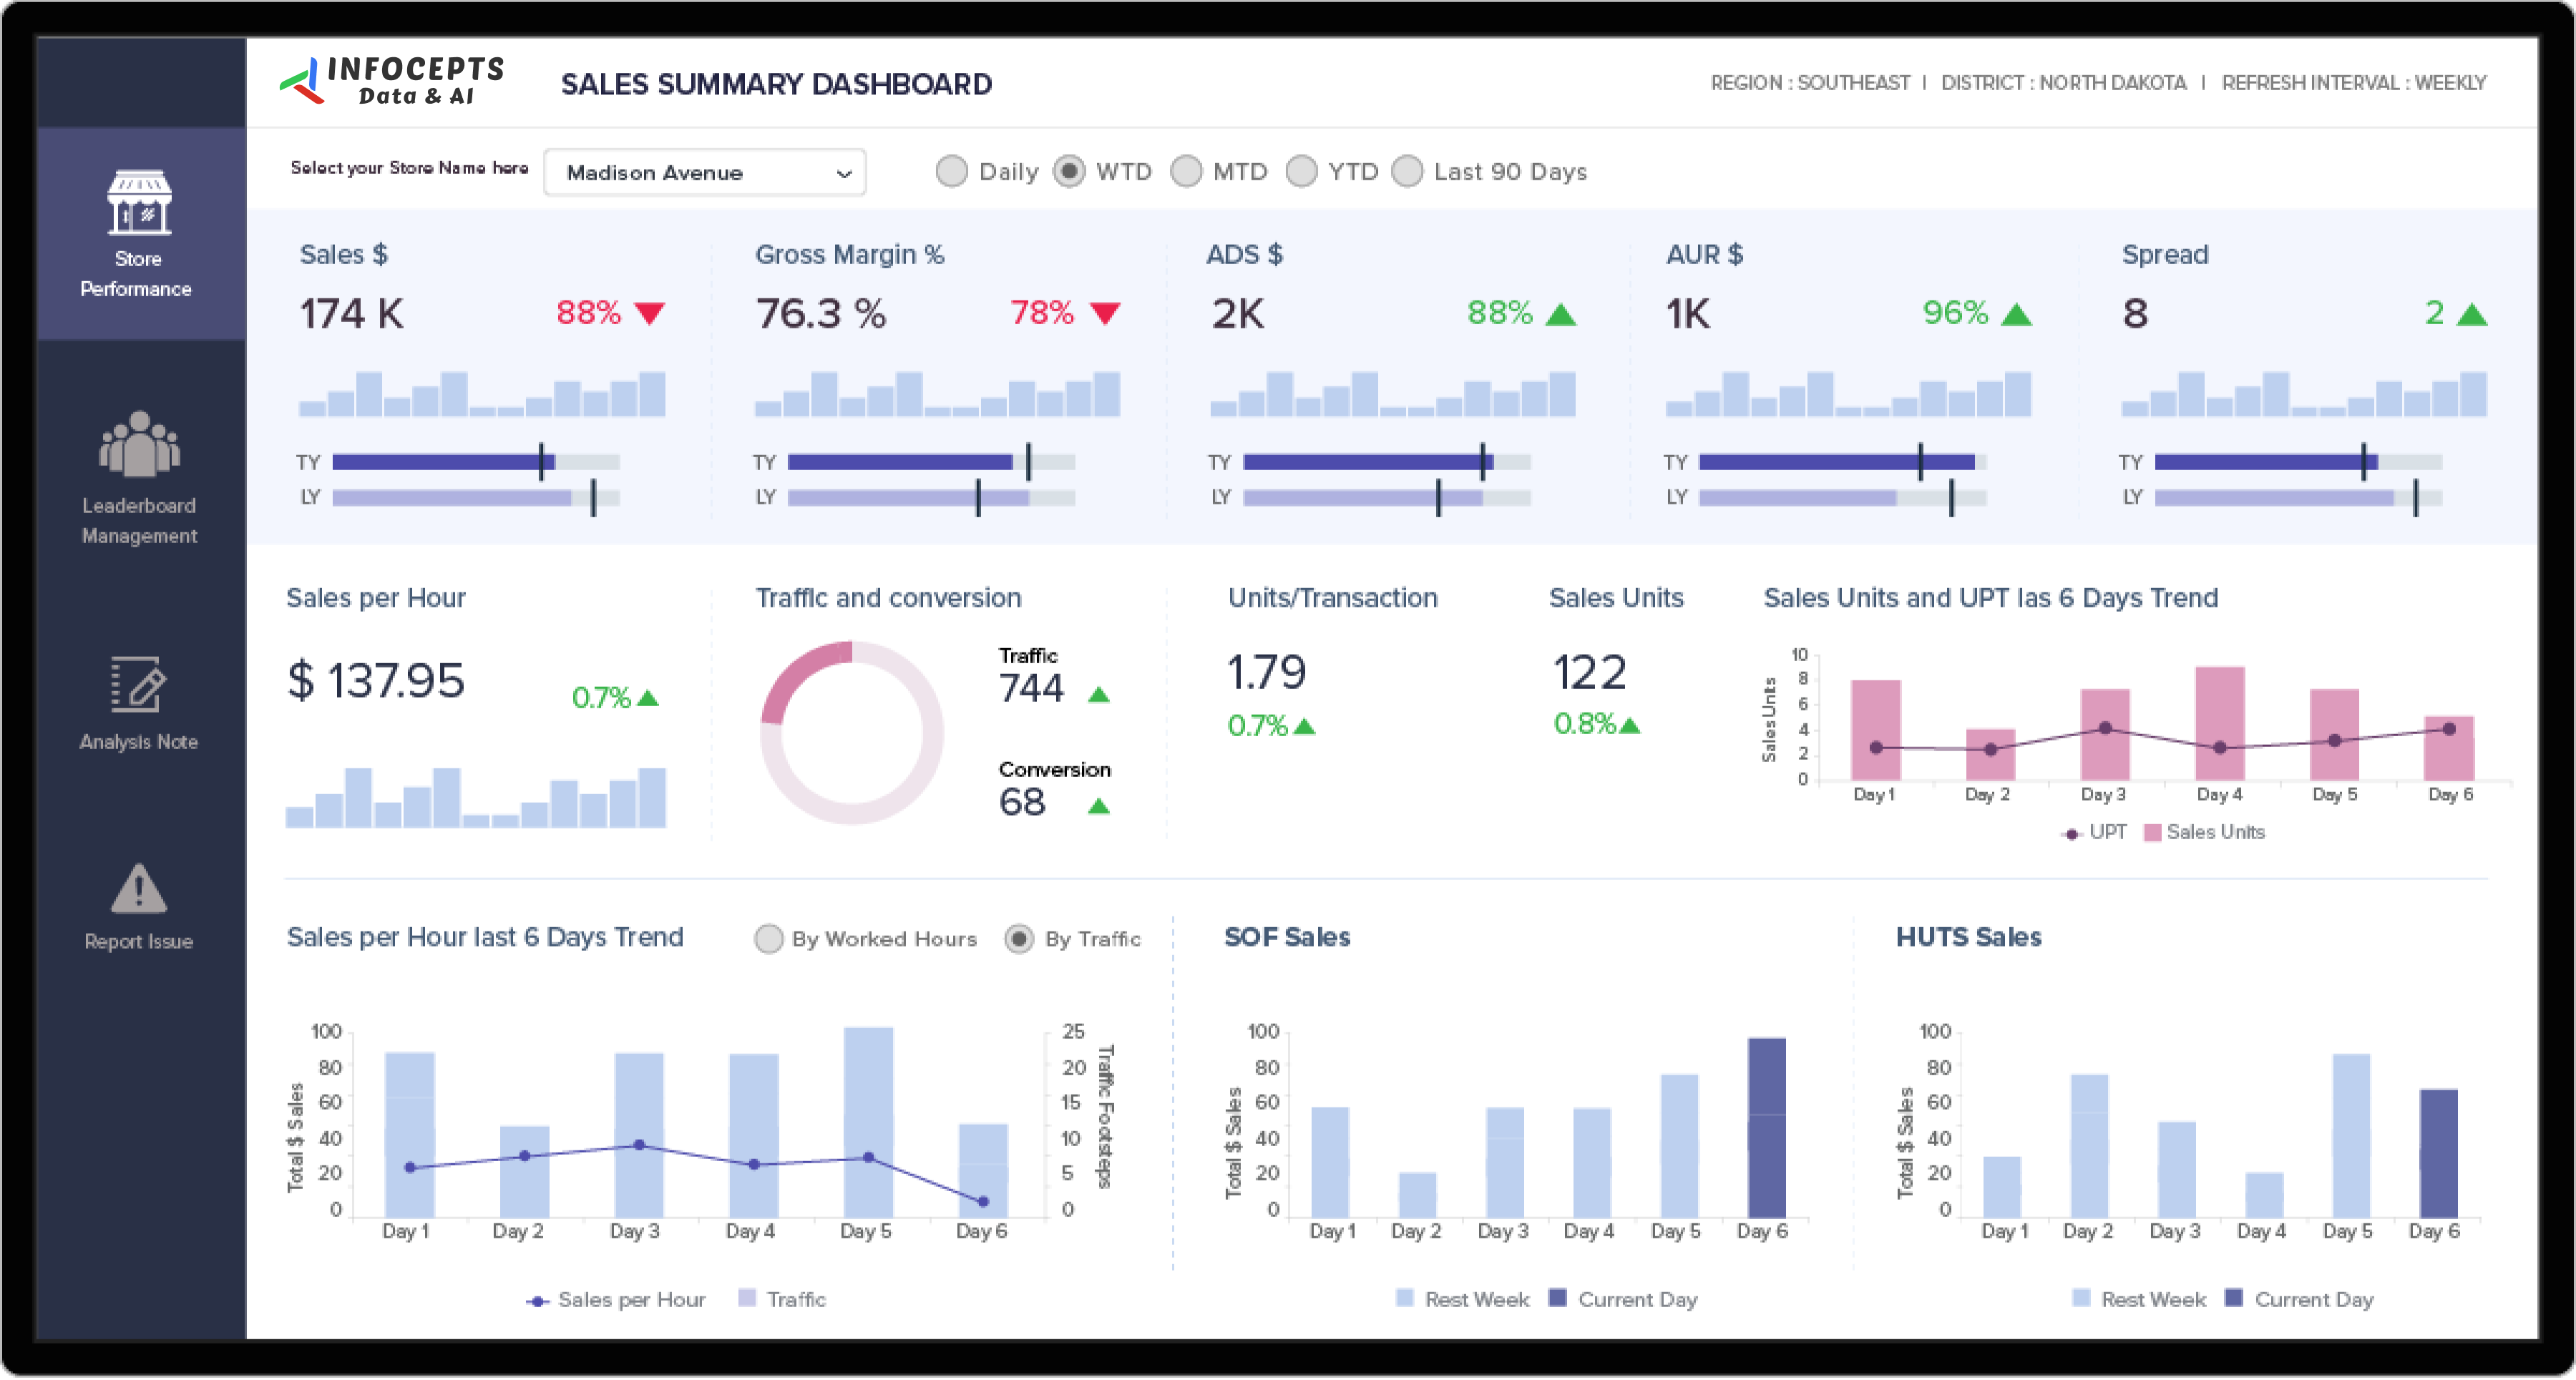
In the fast-paced retail environment, understanding and optimizing store performance is crucial for sustained growth. The 360-degree Store Performance Dashboard from Infocepts empowers store managers and decision-makers with comprehensive, actionable insights on sales performance across multiple locations.
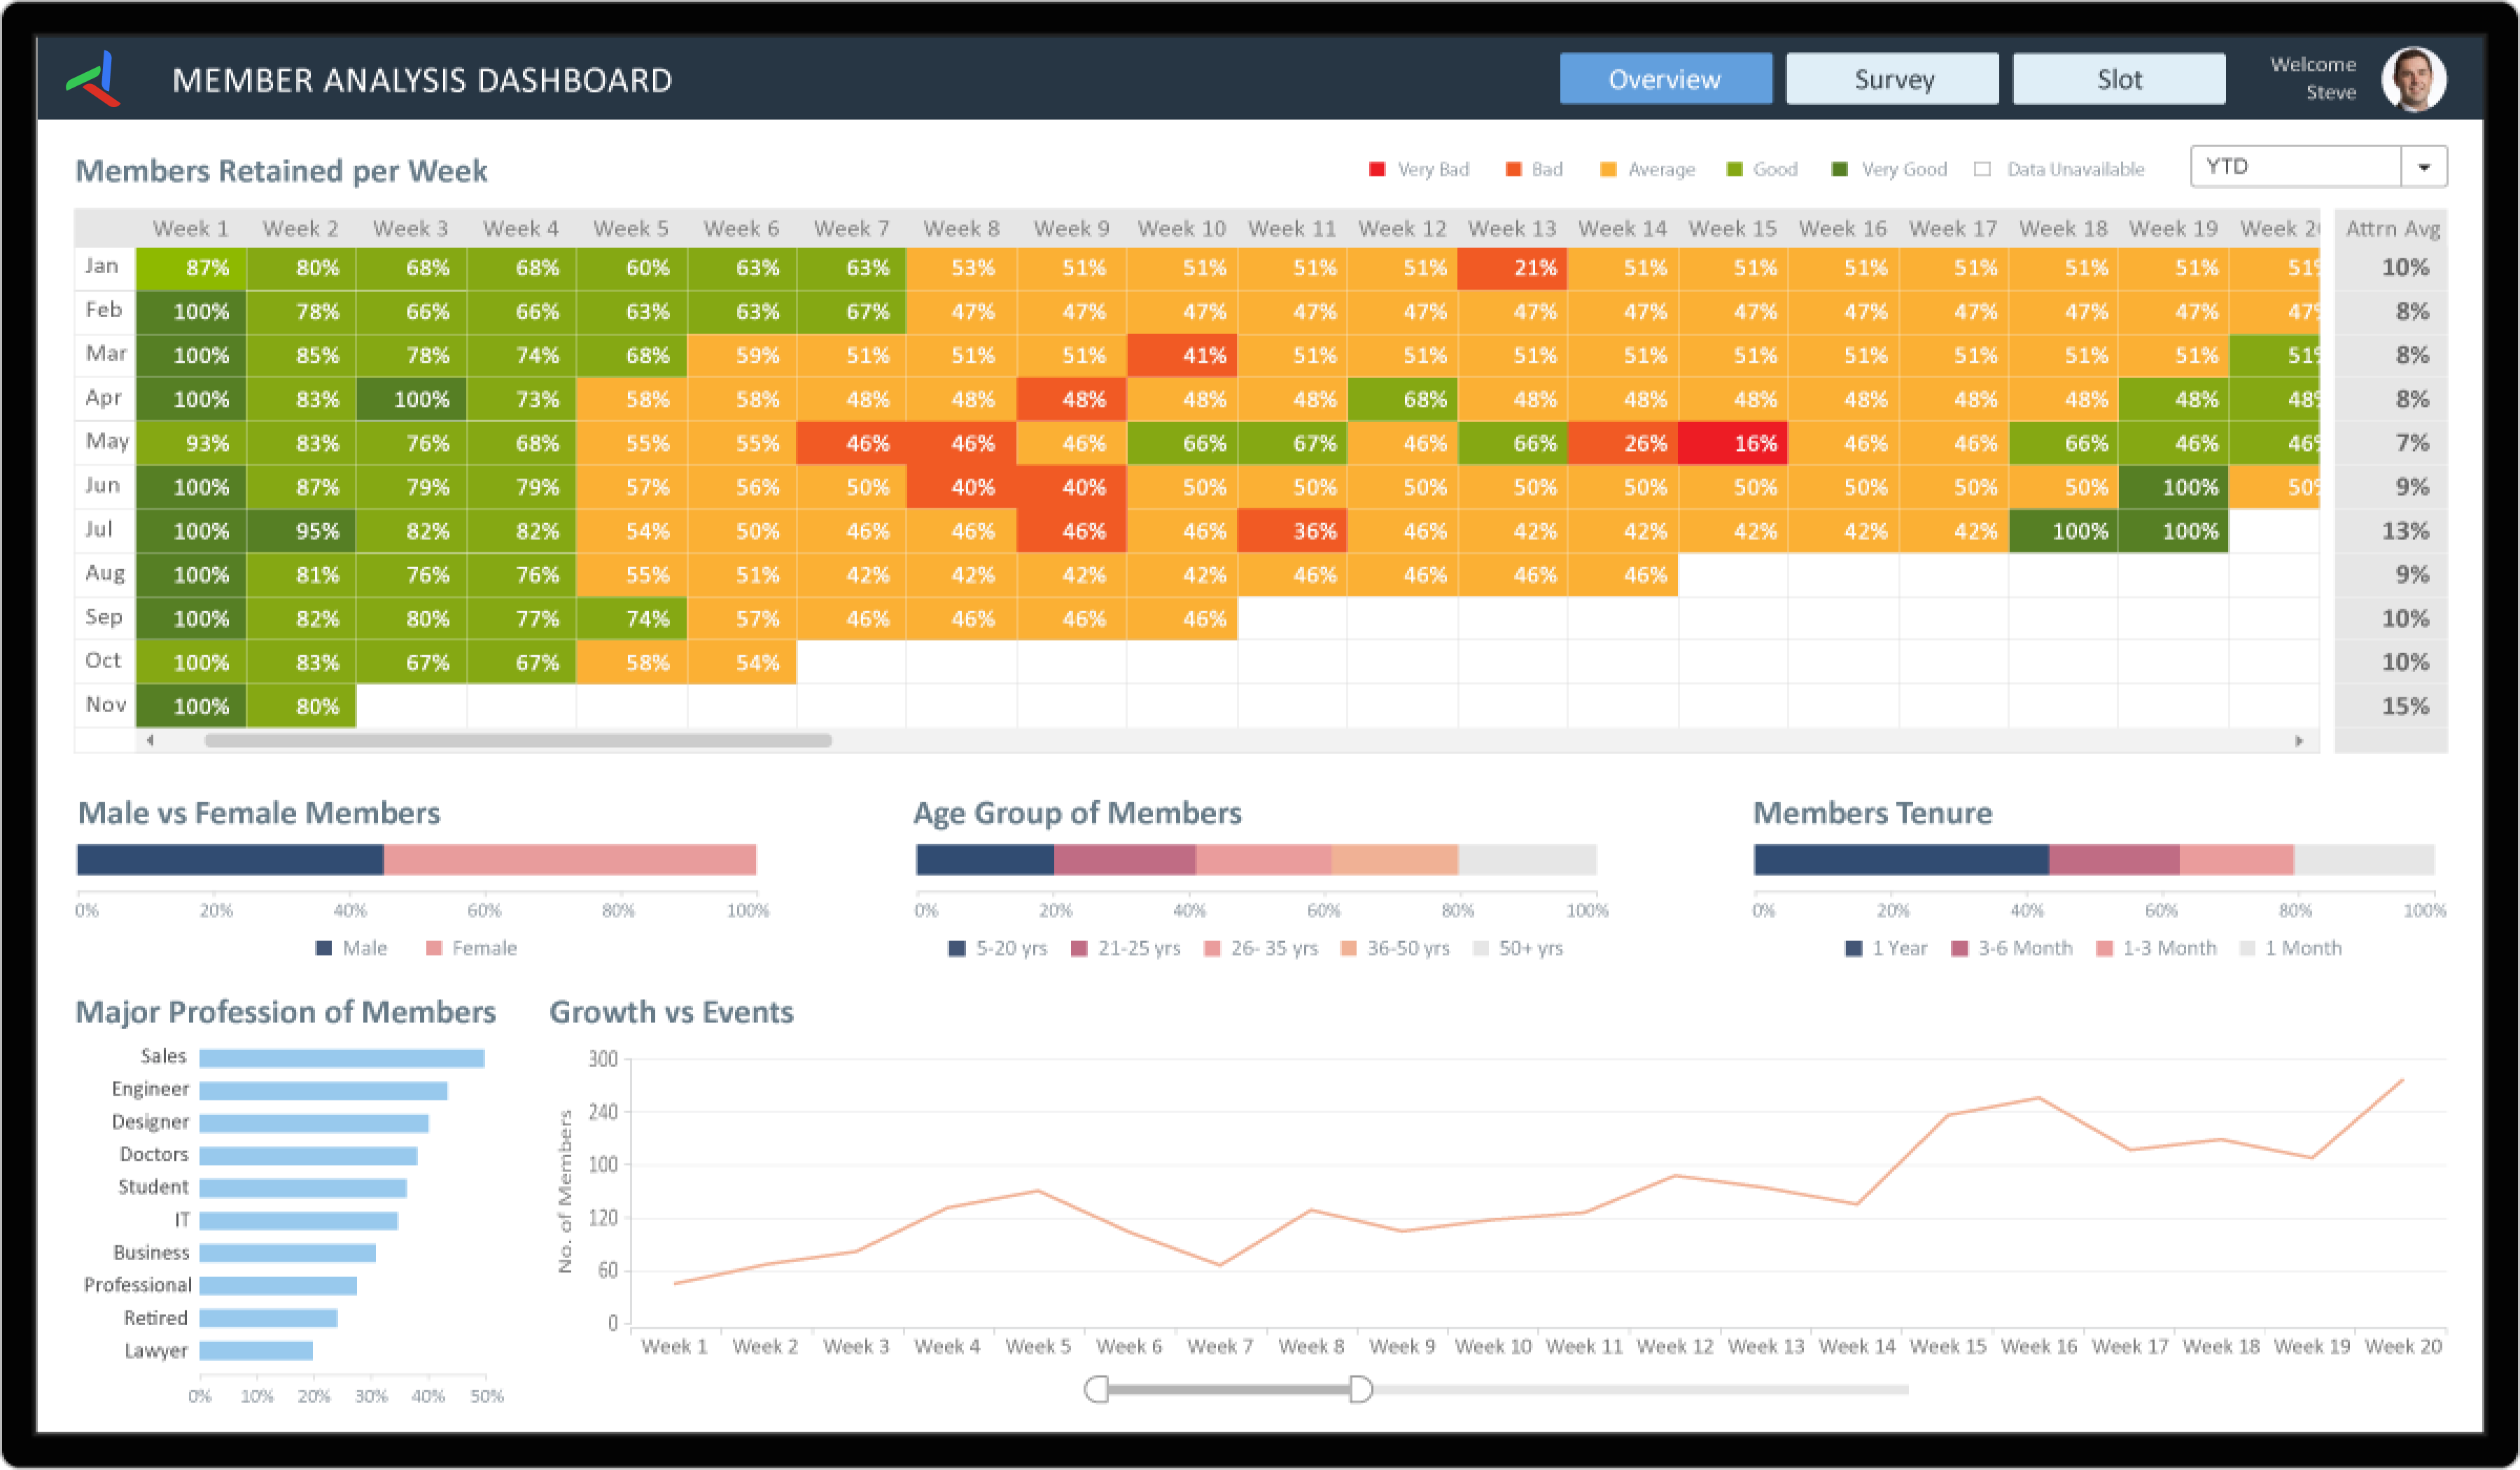
This dynamic dashboard provides a holistic view of key performance indicators (KPIs), segmented by different store locations, sales categories, and more. With an intuitive design and best-in-class data visualization practices, it ensures that users can easily analyze trends, monitor performance, and make quick, informed decisions.
Frequently asked questions
It gives store managers a holistic view of sales KPIs segmented by location and category, instead of reviewing performance store by store or category by category separately.
Comparing performance across locations directly surfaces which stores are underperforming relative to peers, rather than relying on a single company-wide average.
Sales performance broken down by store location and sales category, structured around however a specific retailer already defines its performance categories.
Store managers and retail decision-makers responsible for performance across multiple locations.
Faster identification of underperforming stores or categories lets leadership act on a growth opportunity or a decline while there is still time to change course.
By connecting sales data across locations into a BI platform through Business Analytics services, for Retail & CPG organizations.

 Pranali Lanjewar