



85%
Accuracy Achieved in Operational Insights
90%
Adherence to Regular Business Hours Across Stores
82%
Efficiency in Delivering Actionable Operational Insights
70%
Reduction in Unplanned Overtime Cases
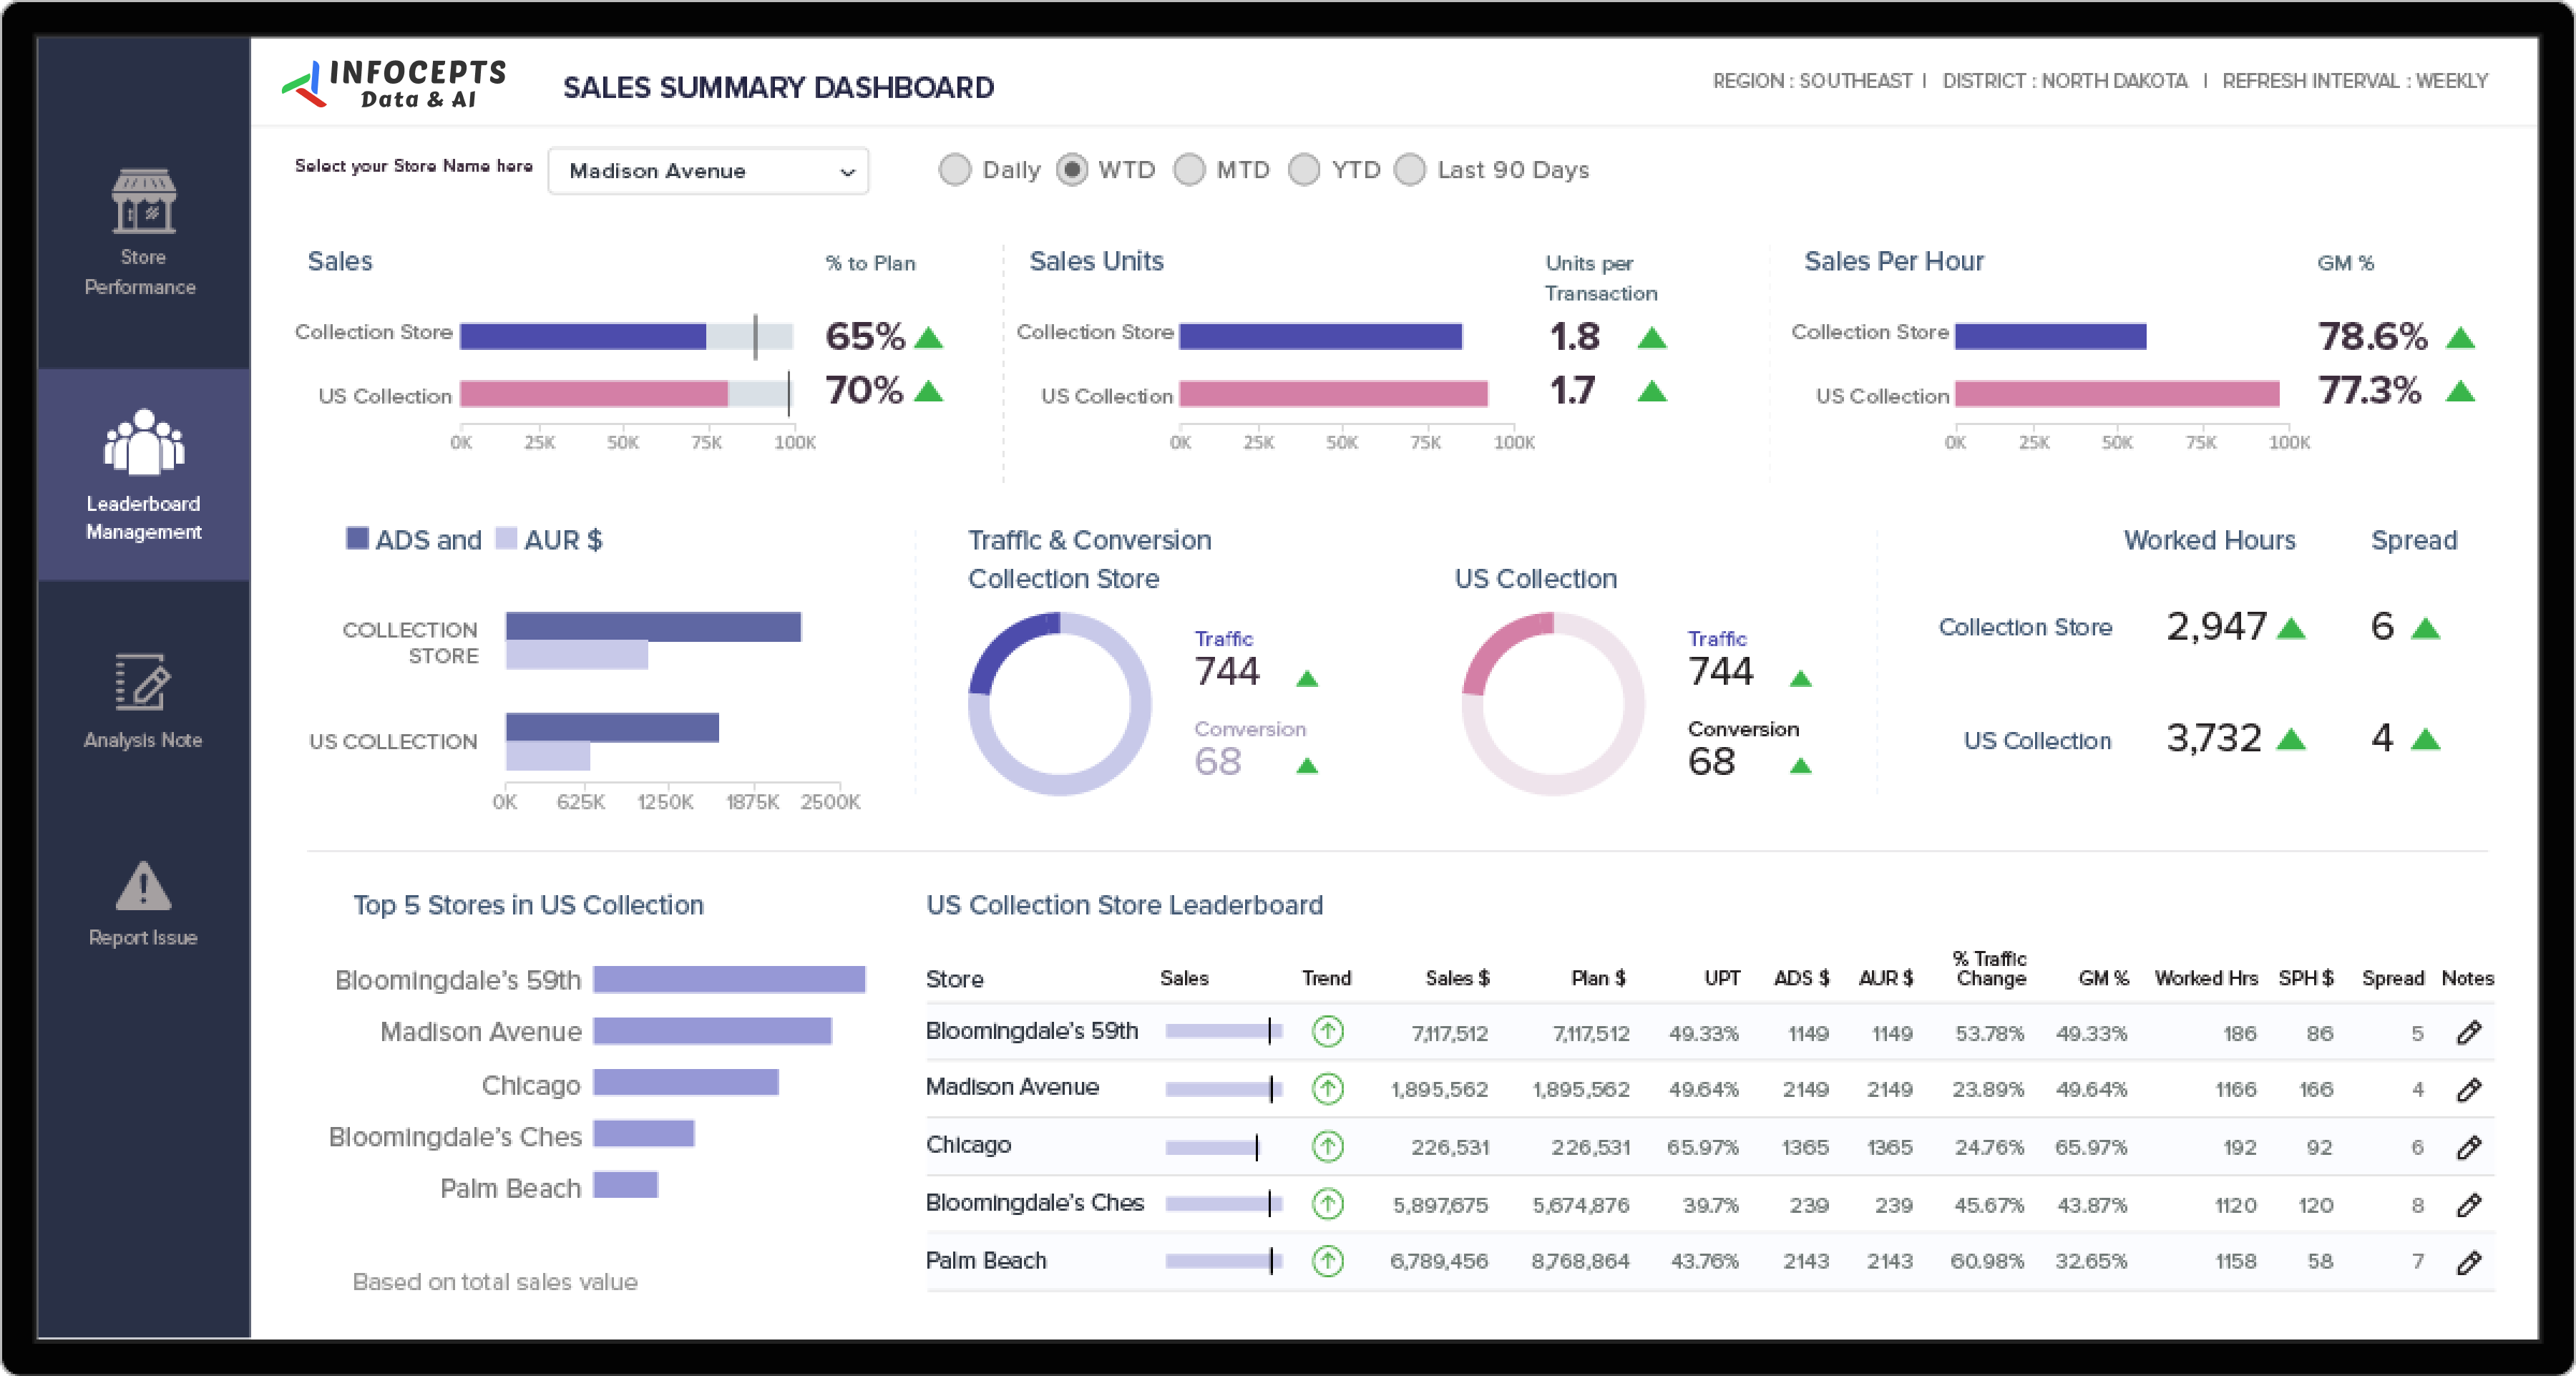
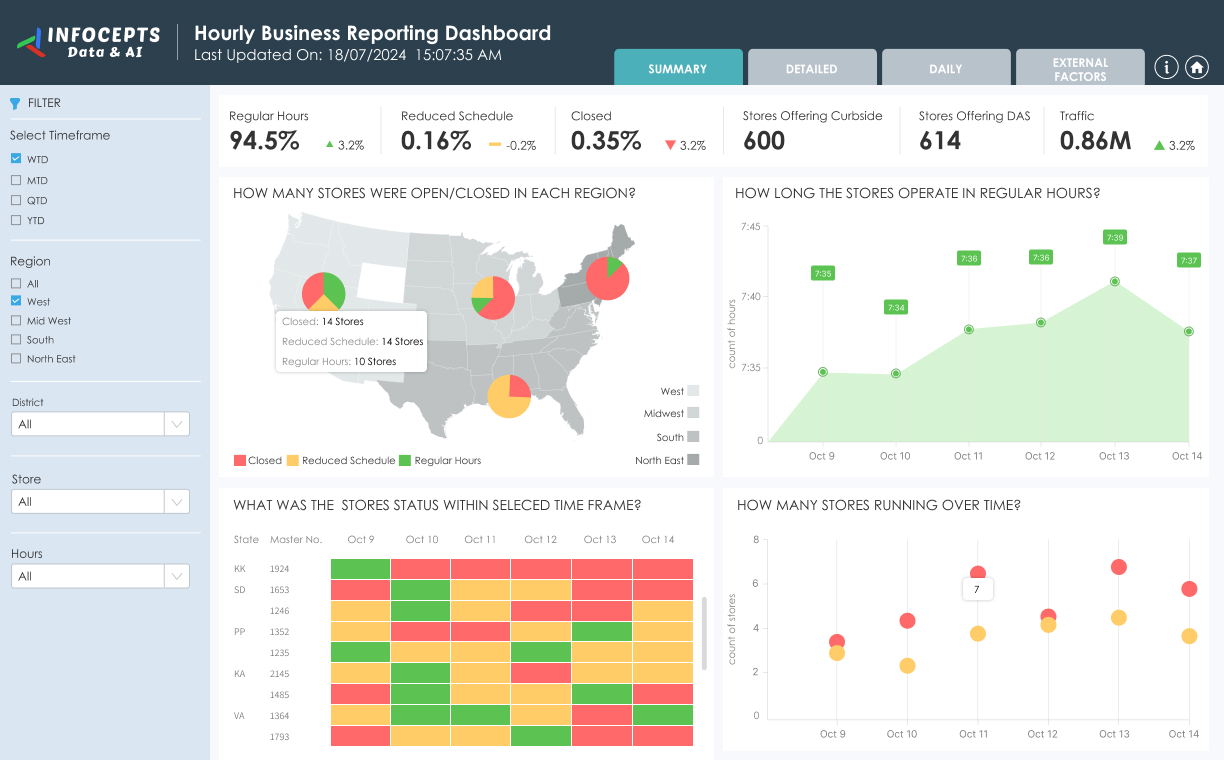
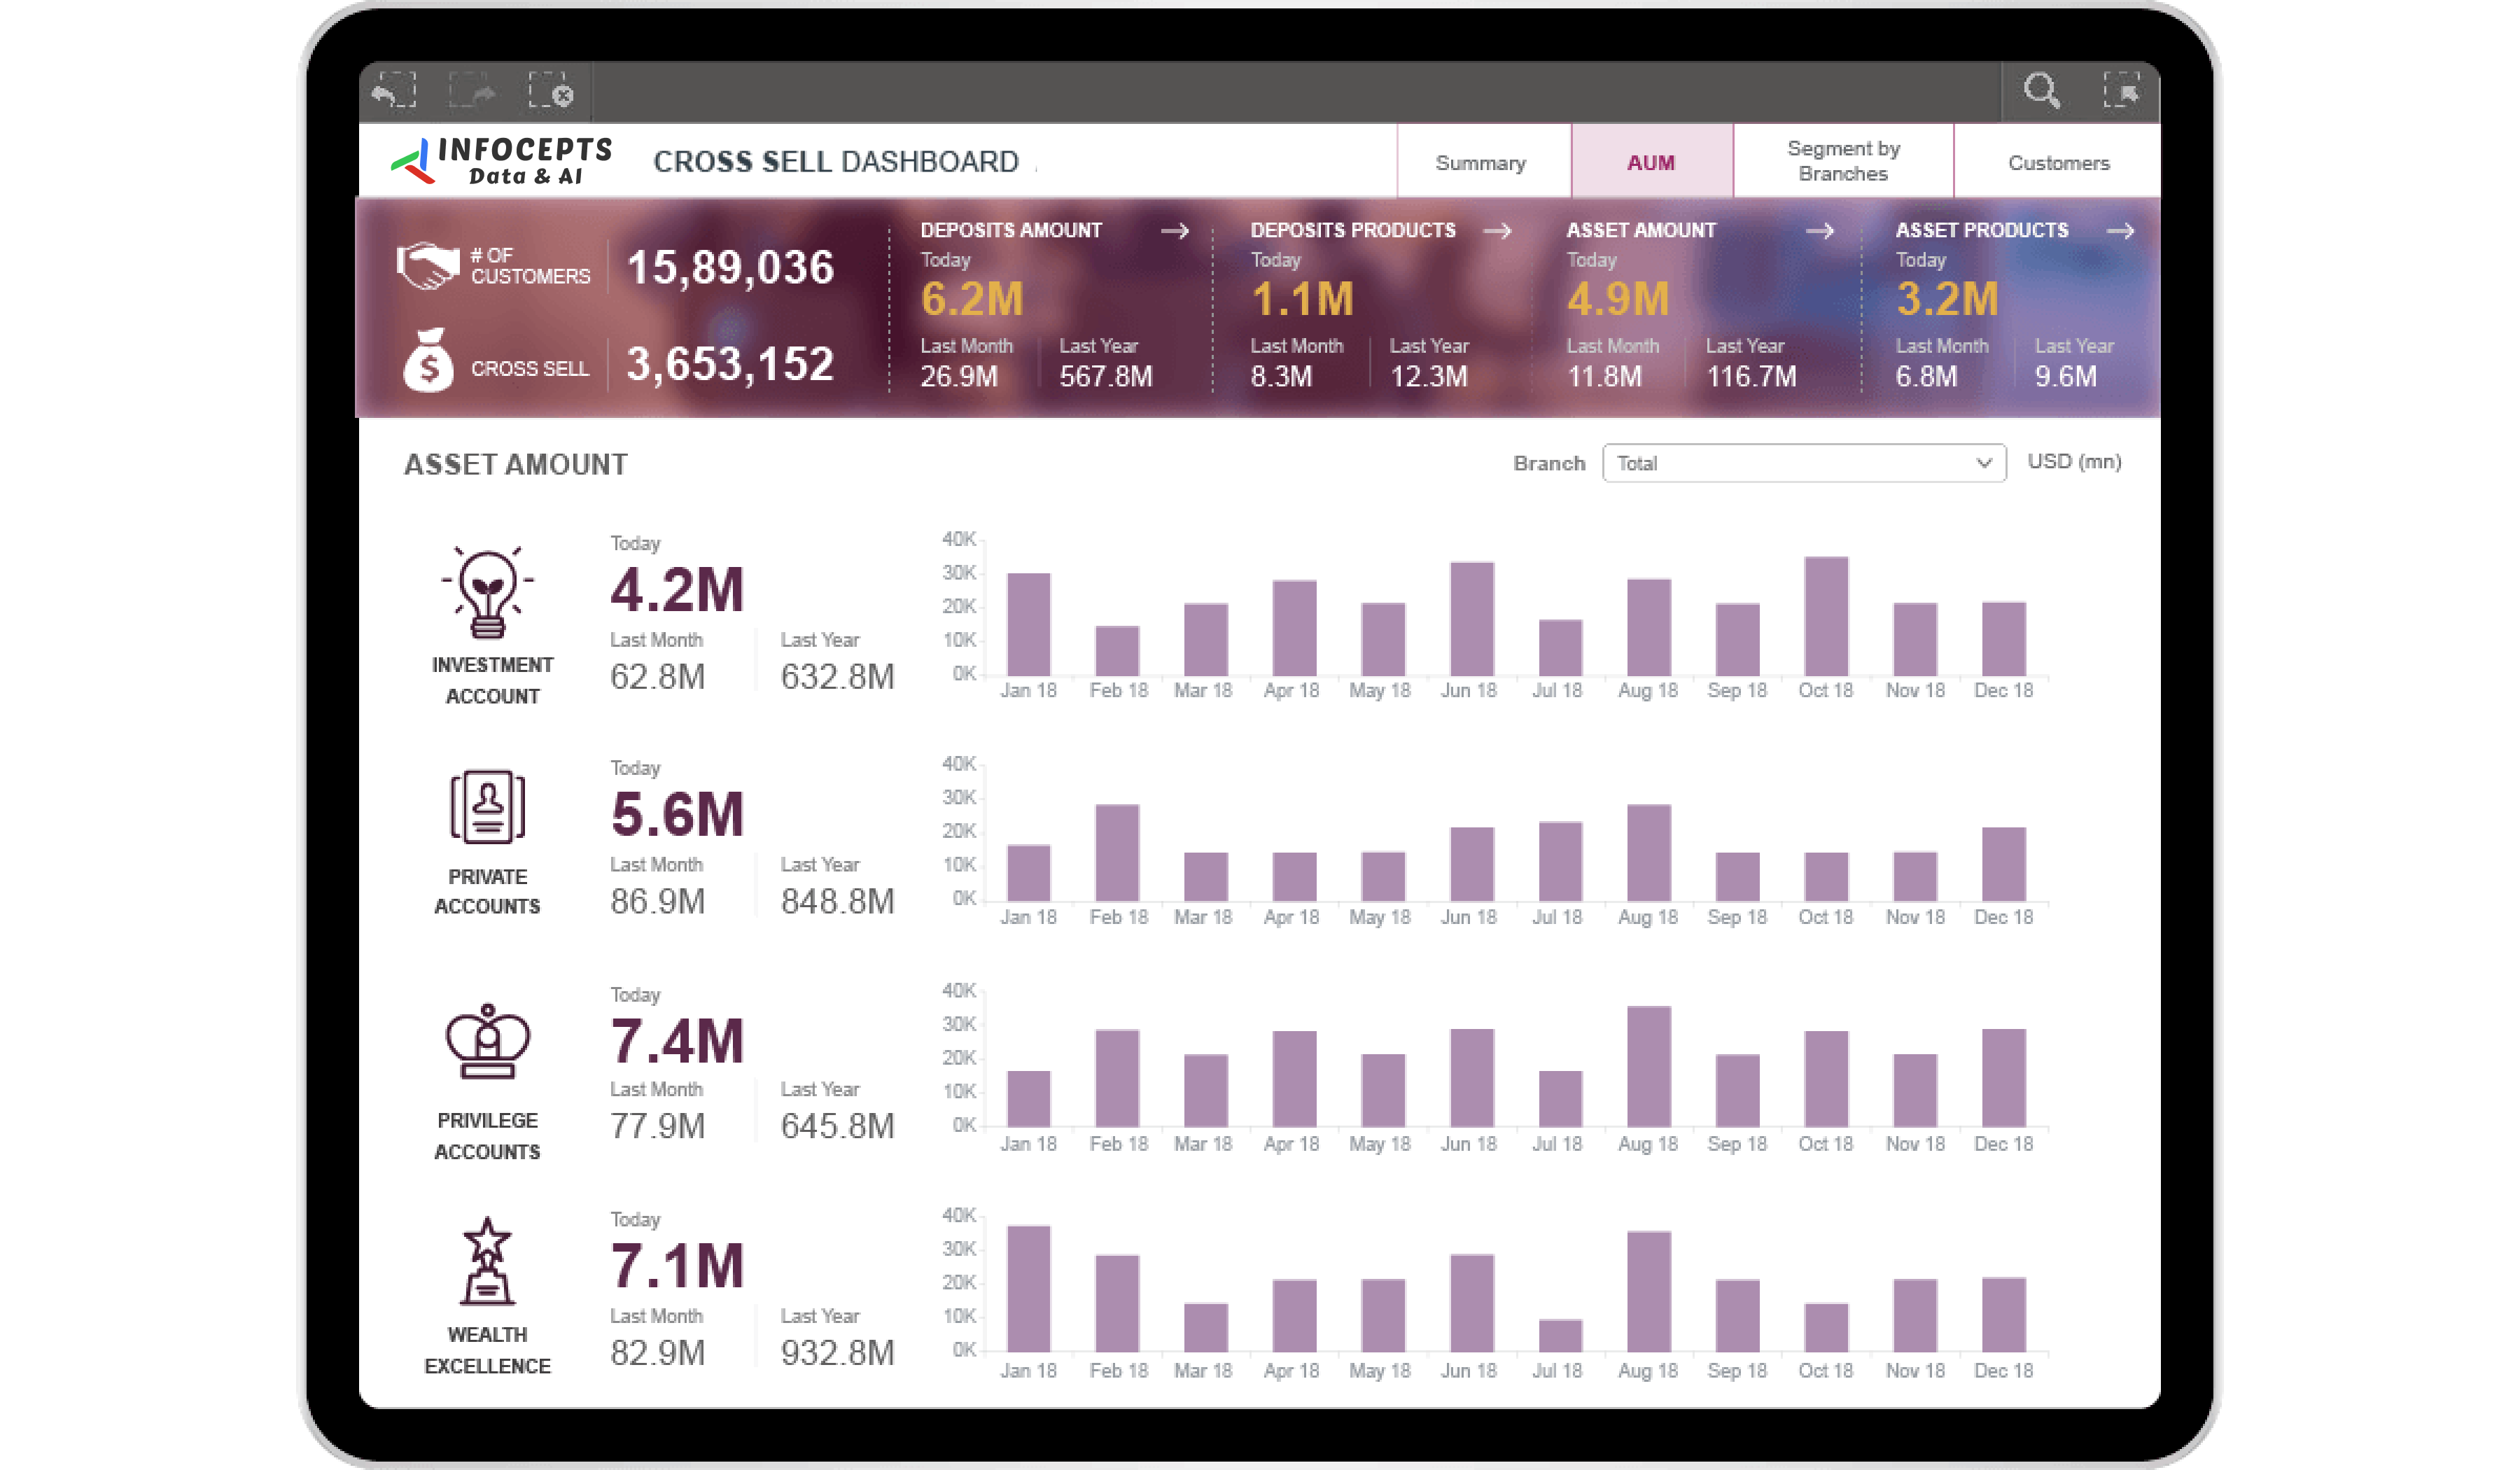
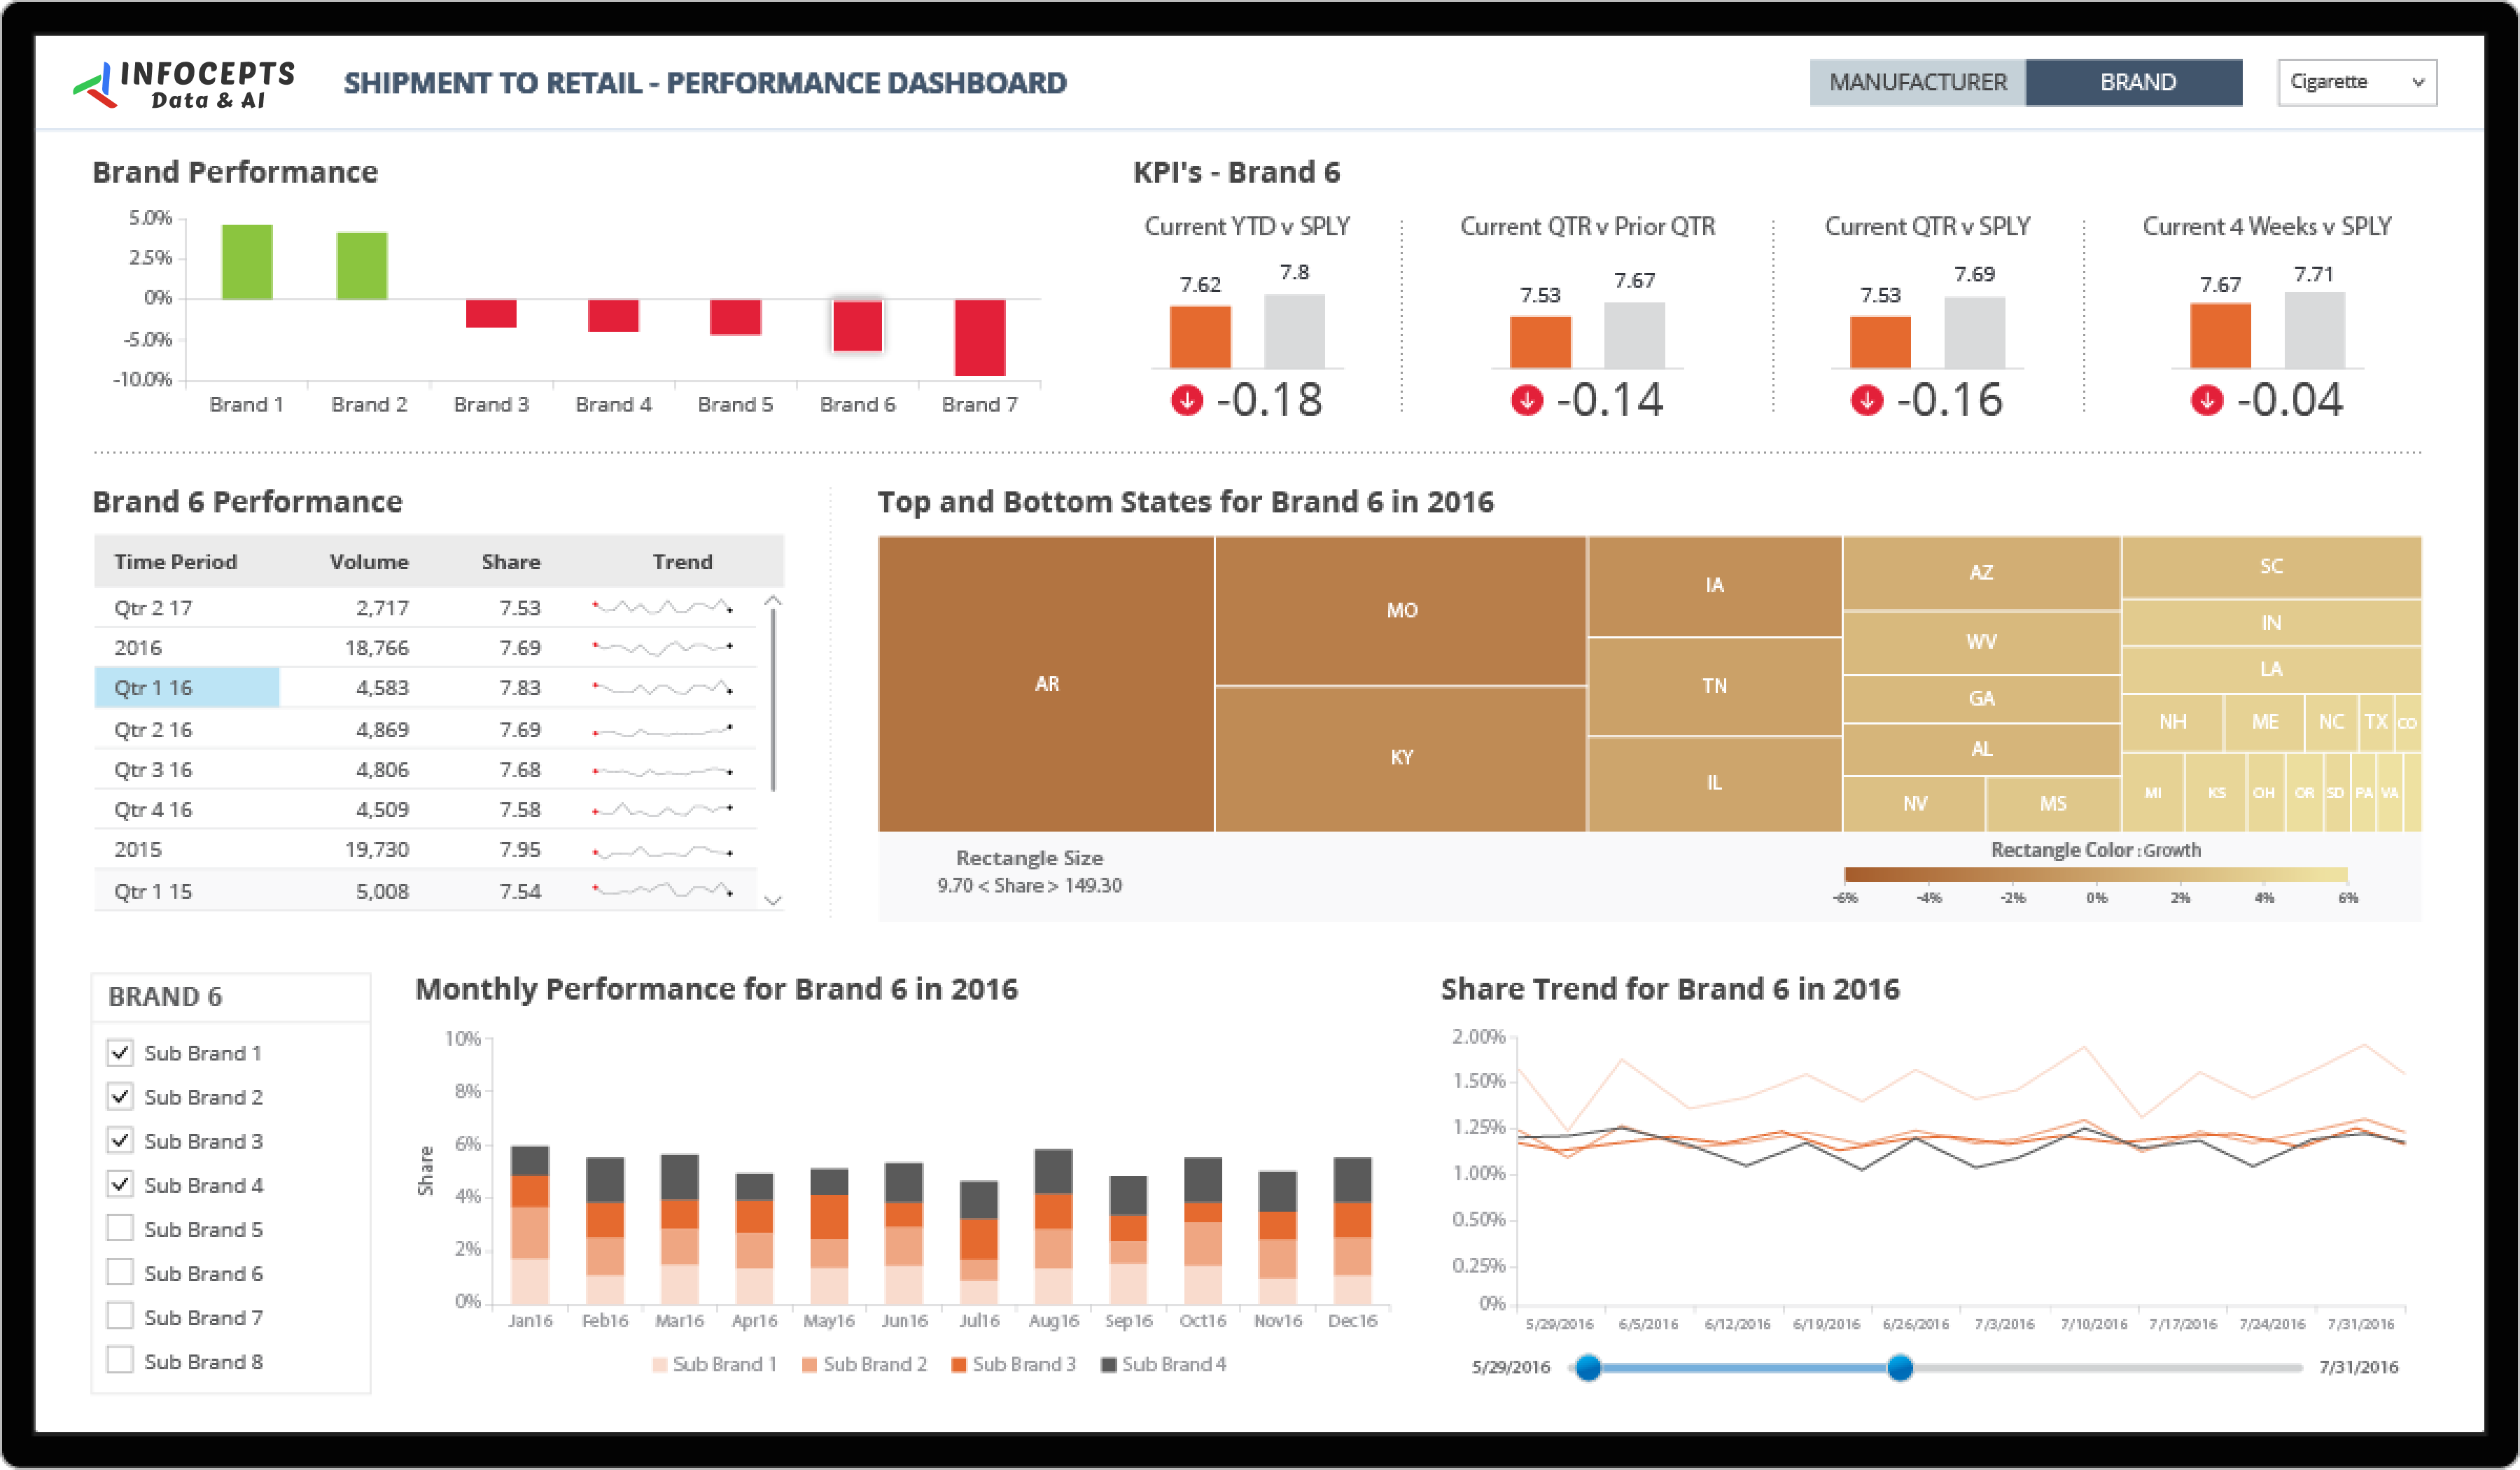
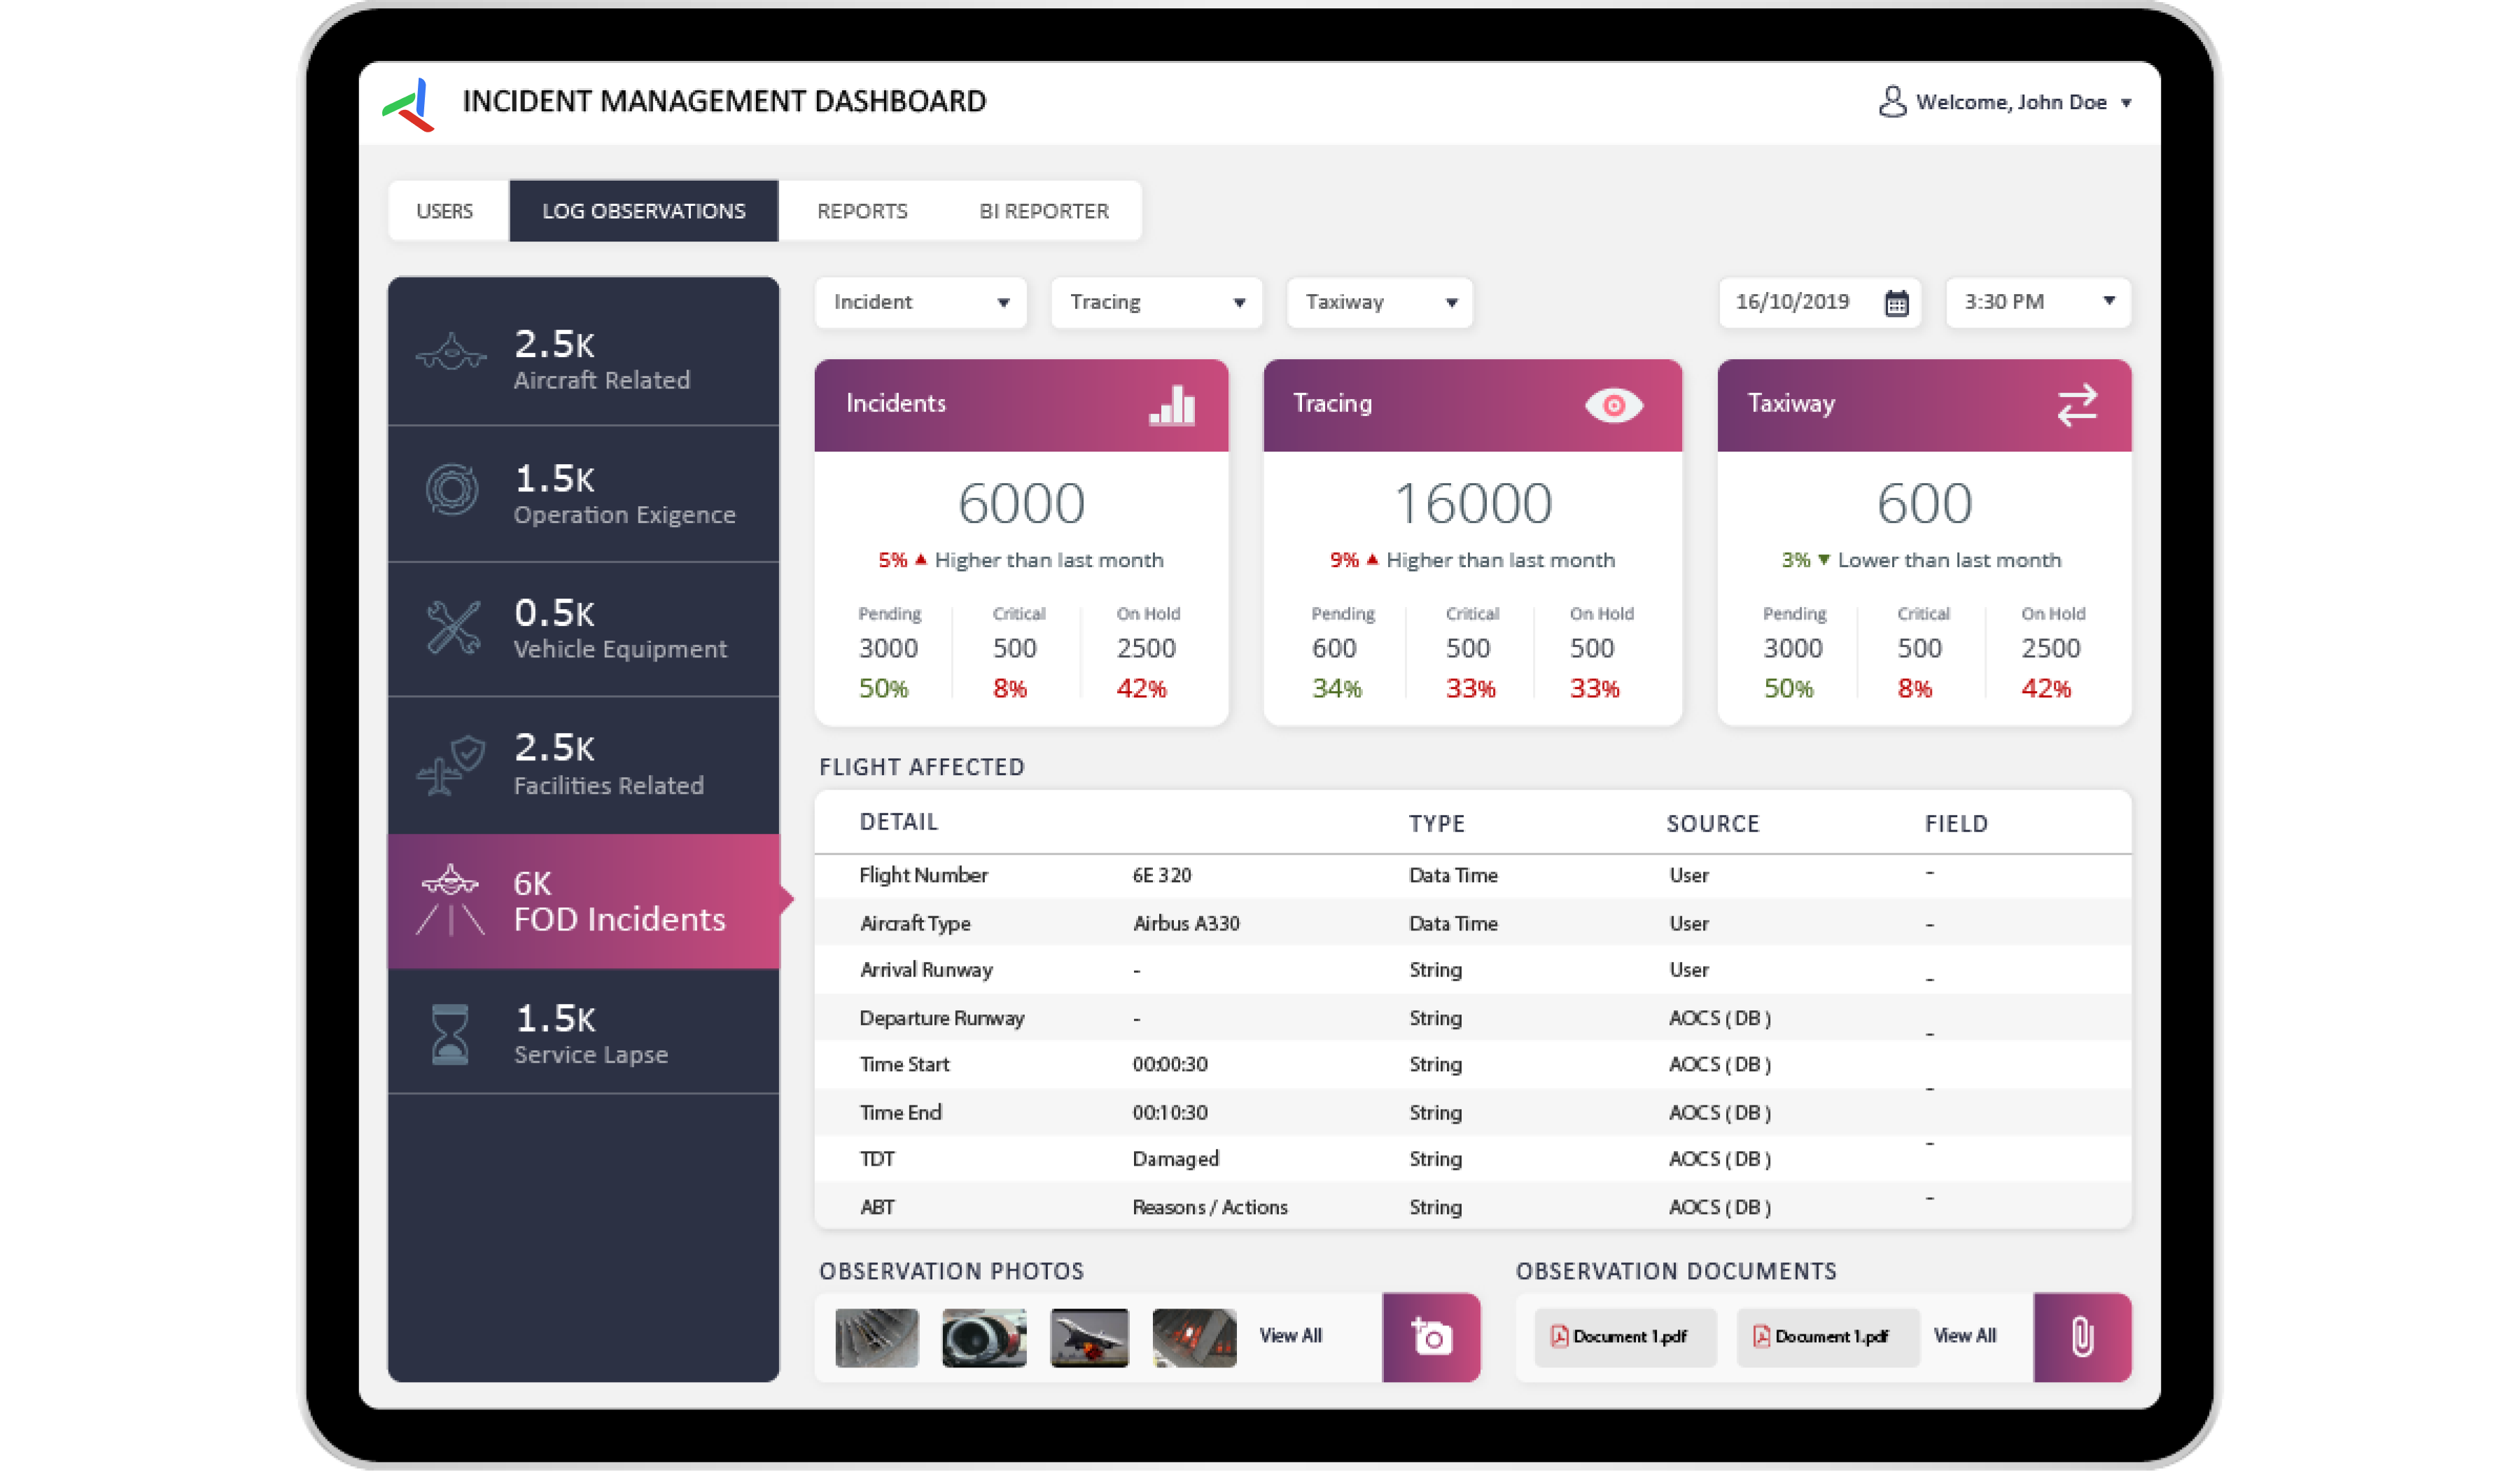
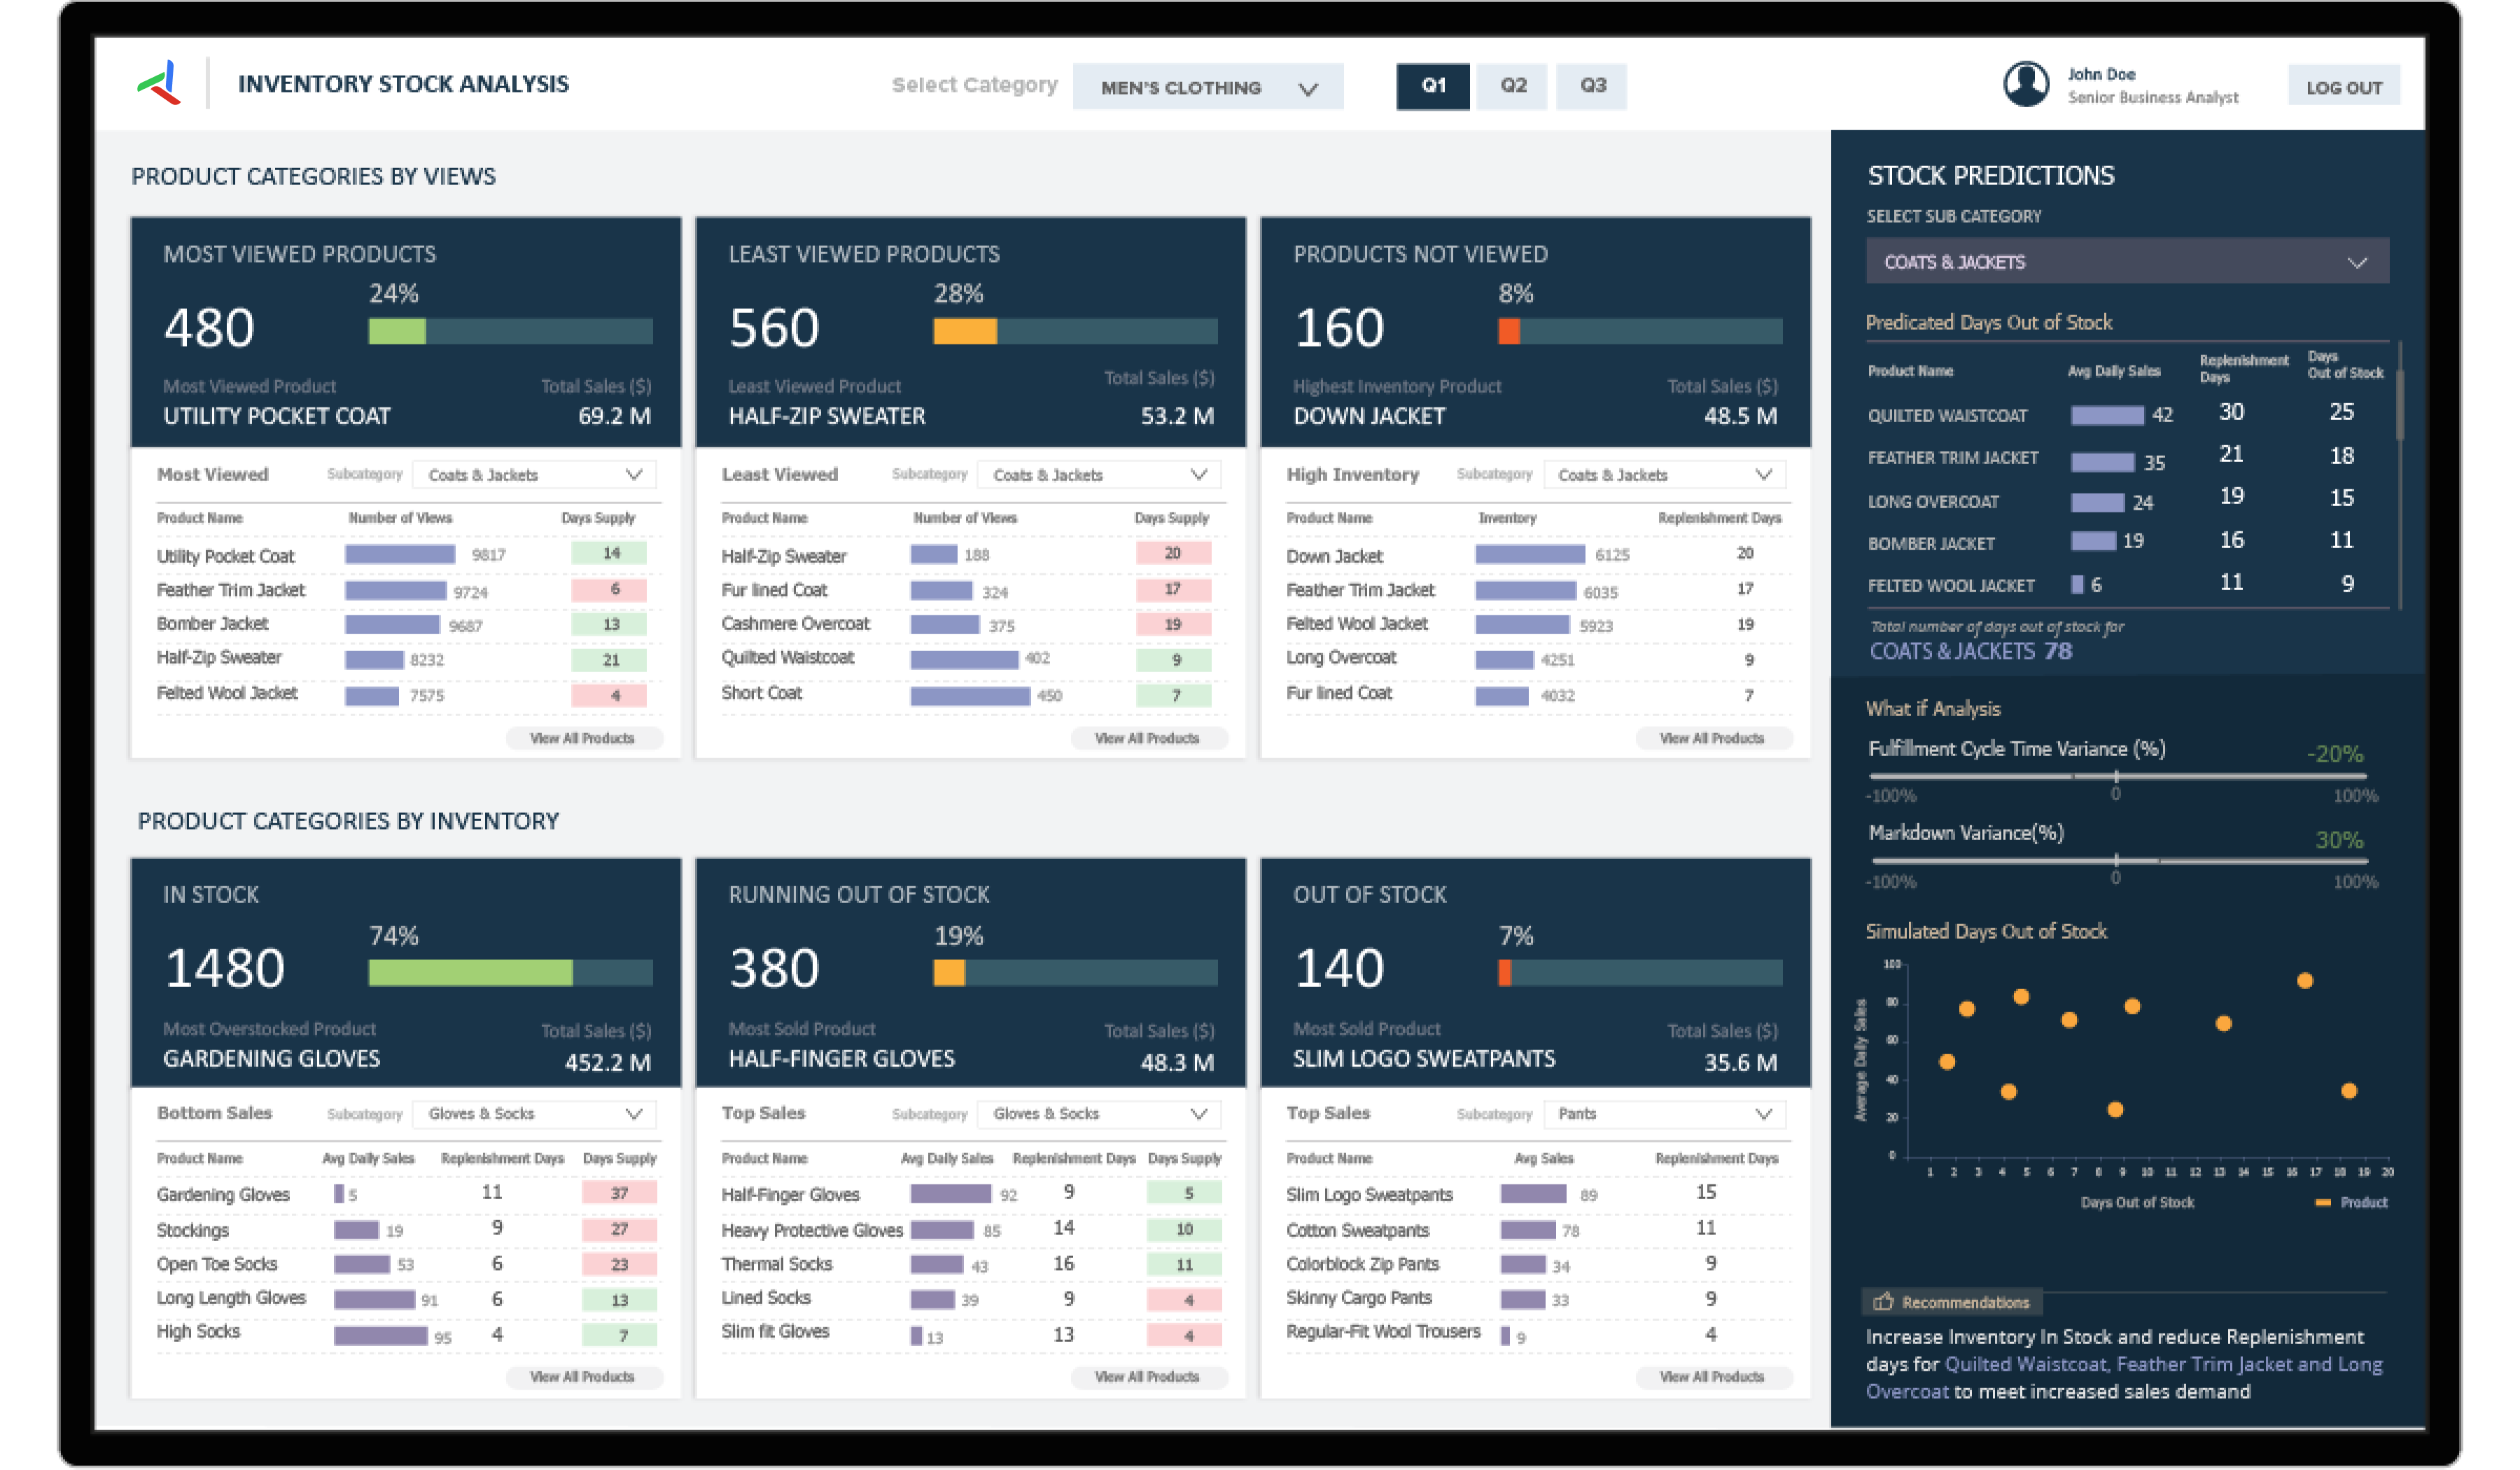
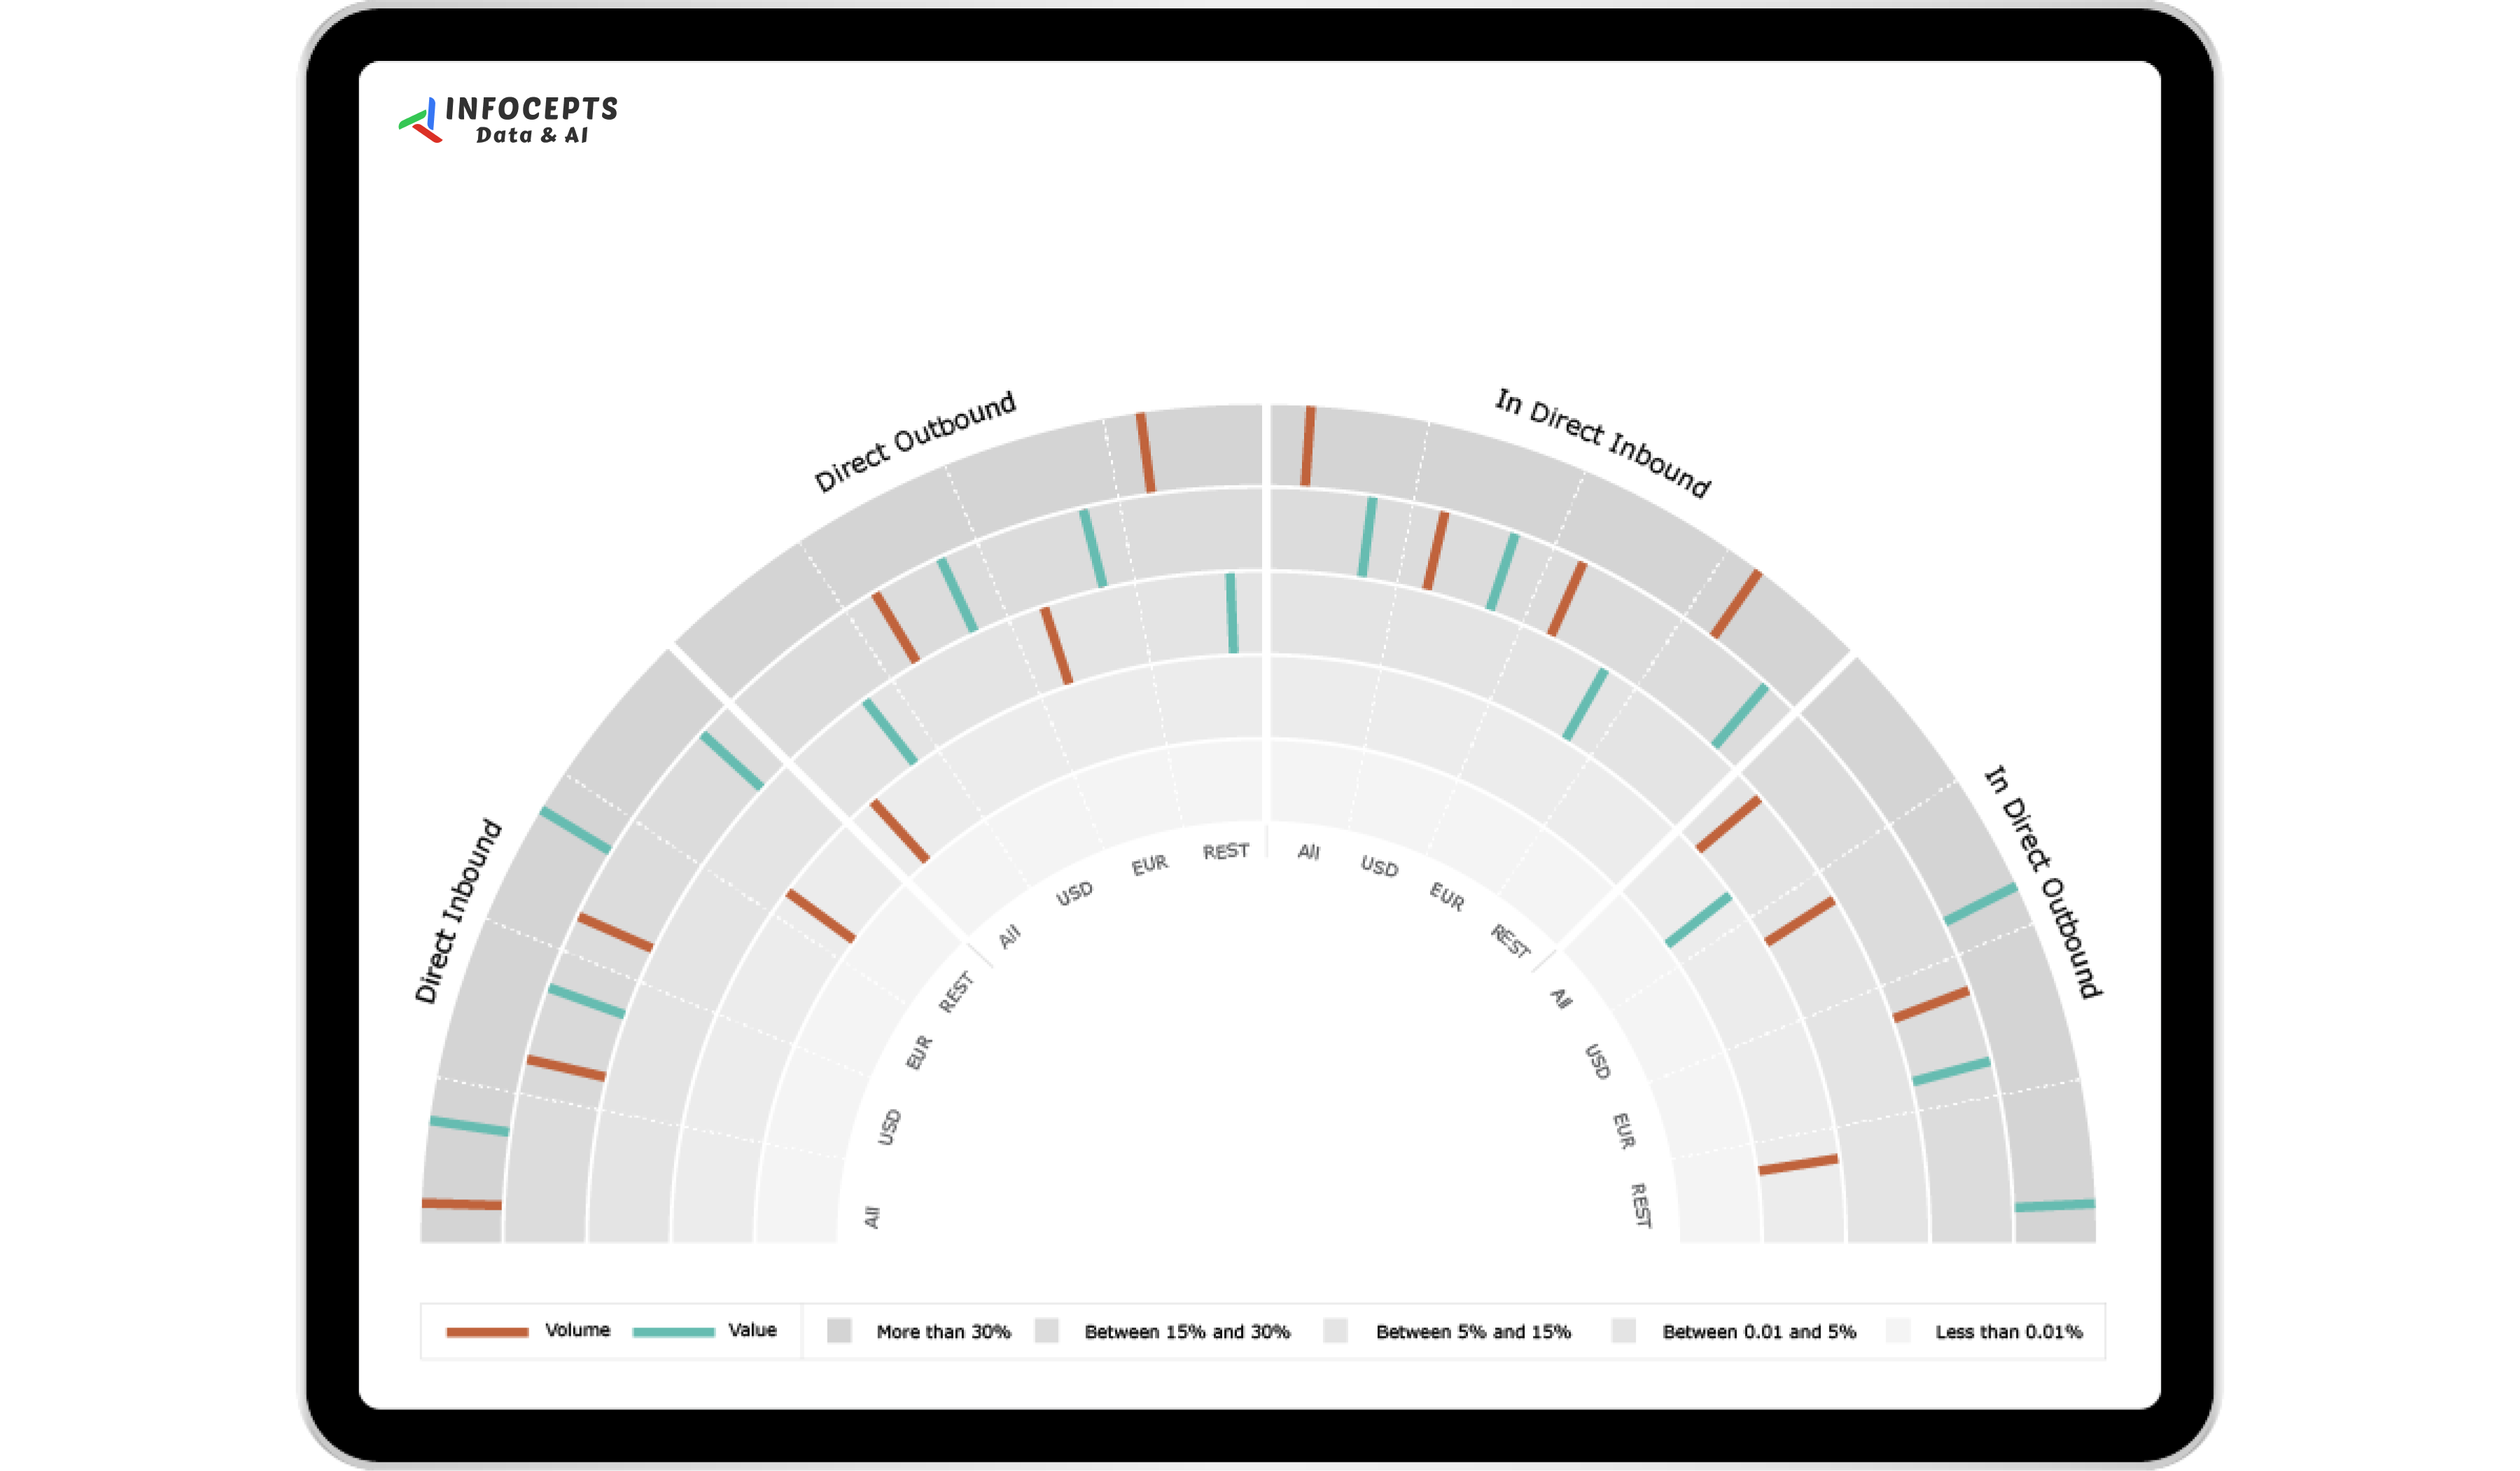
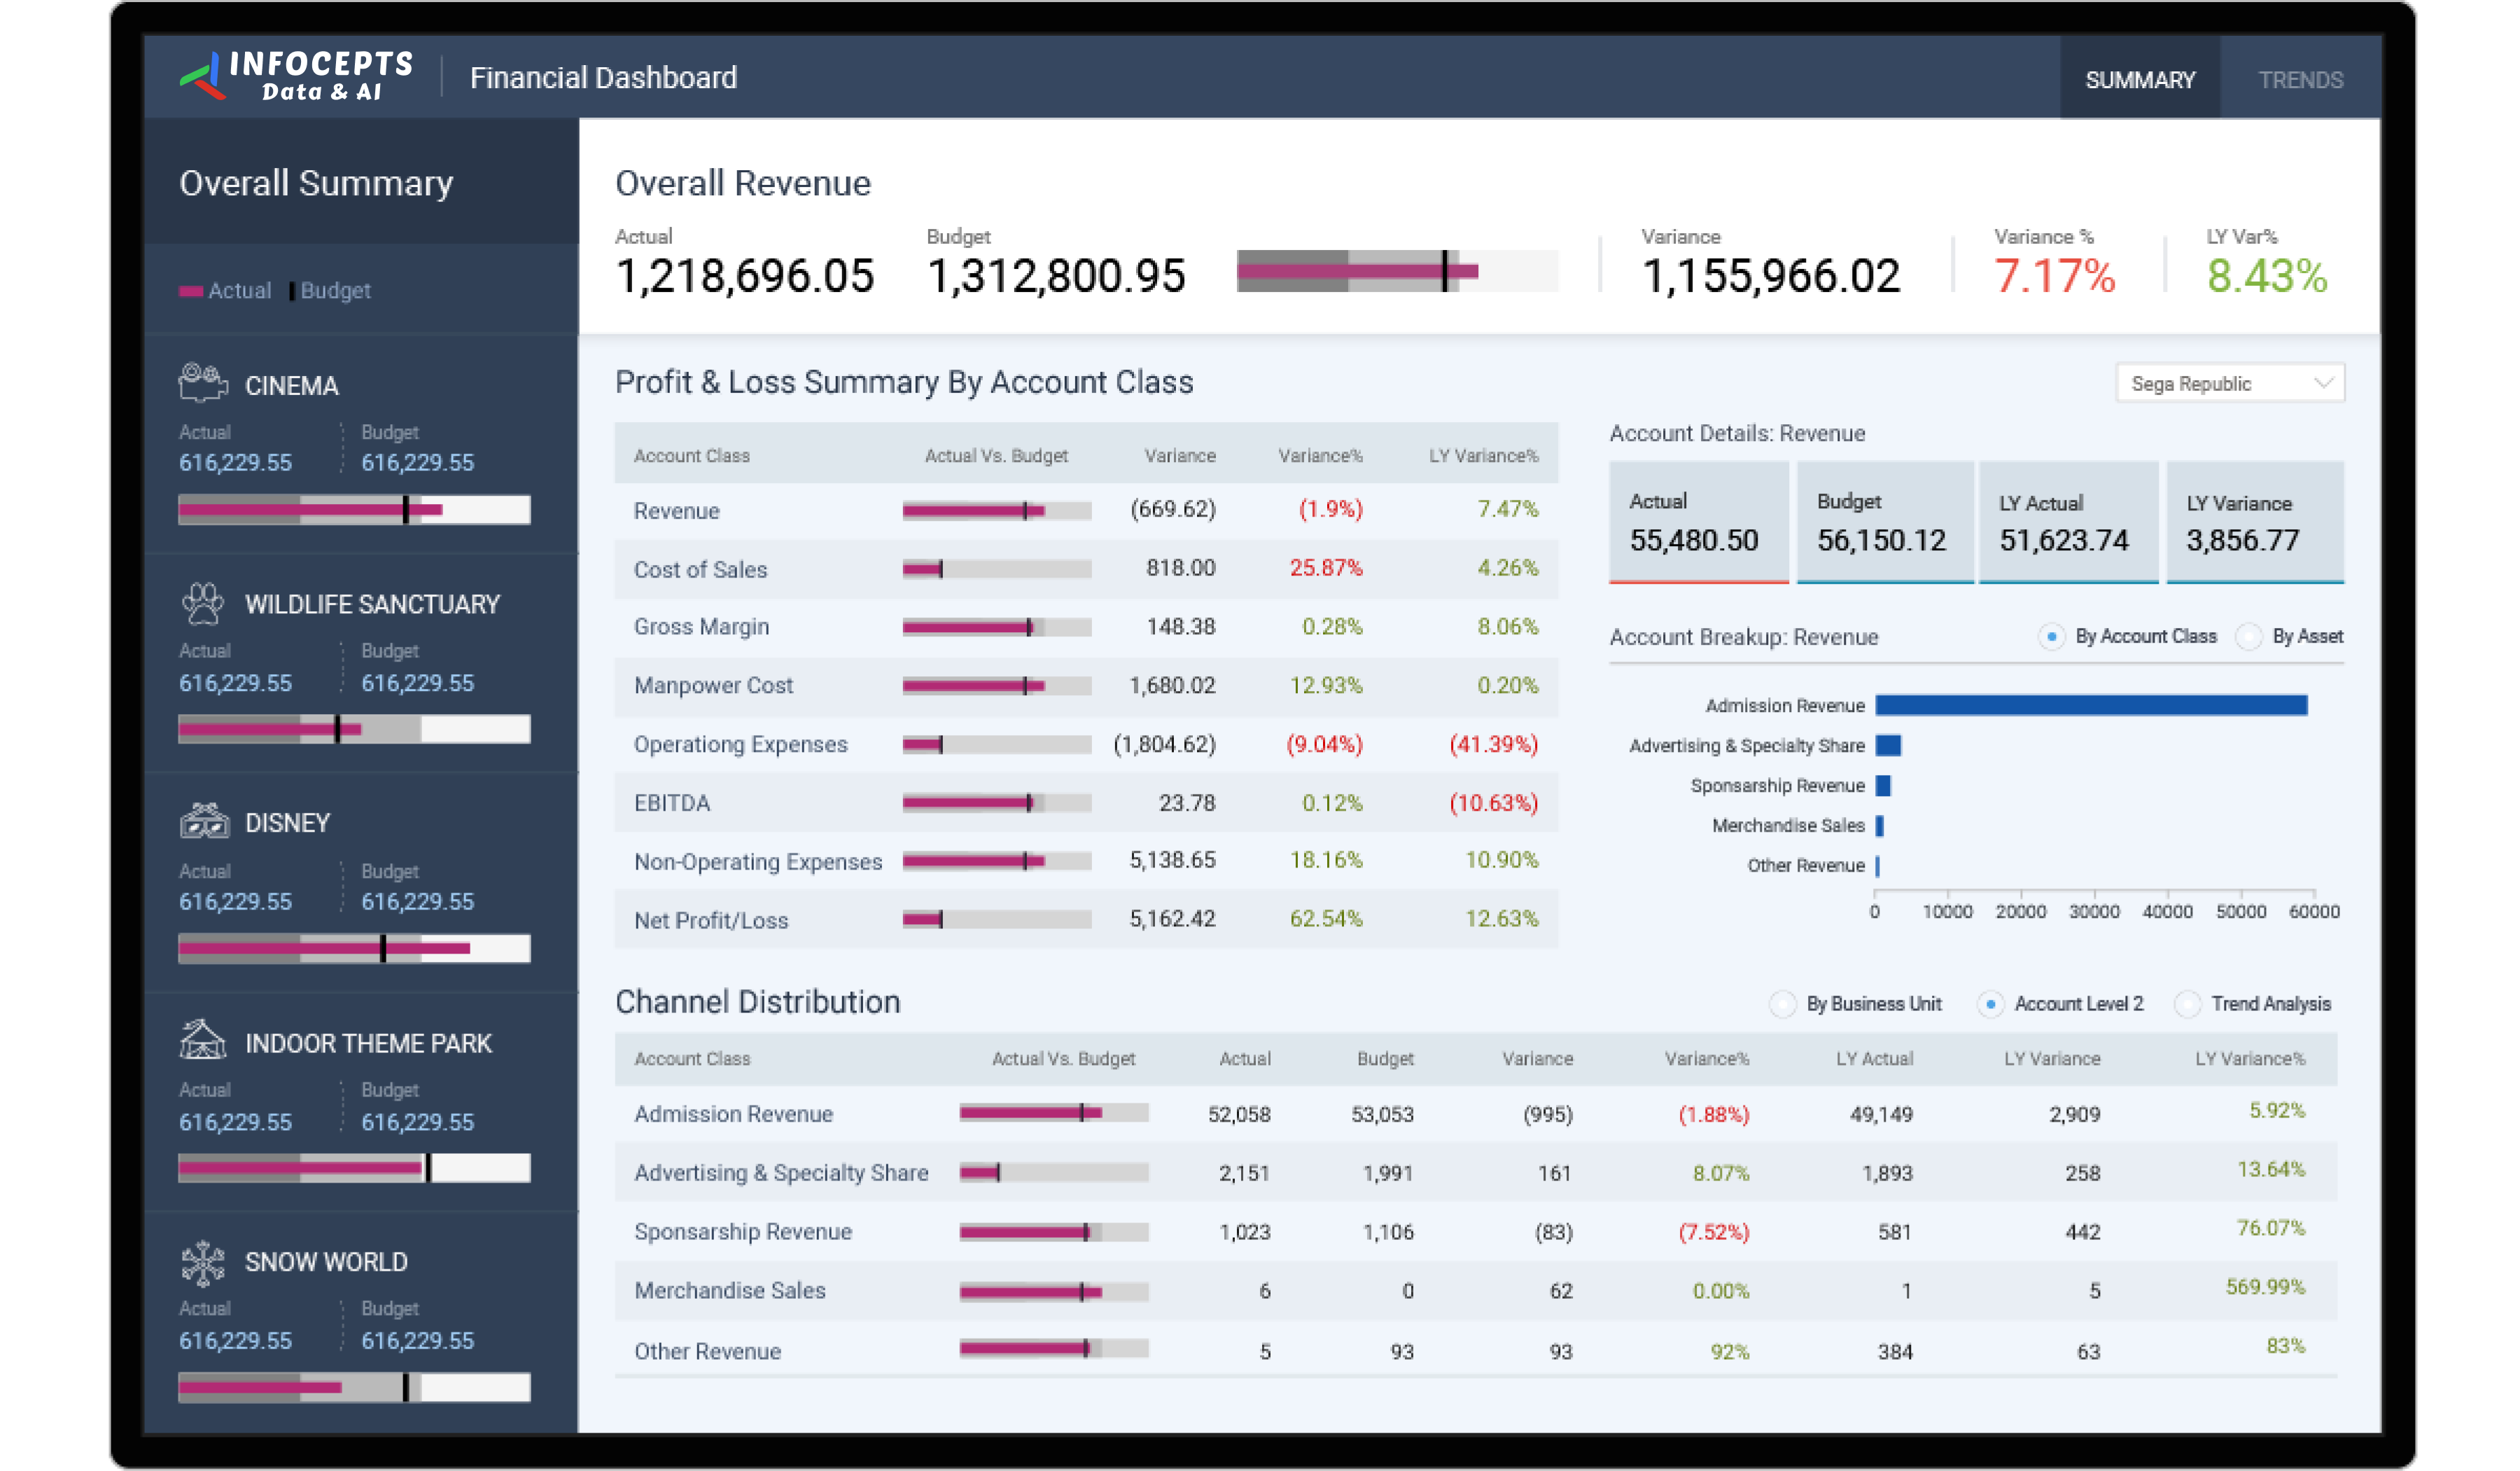
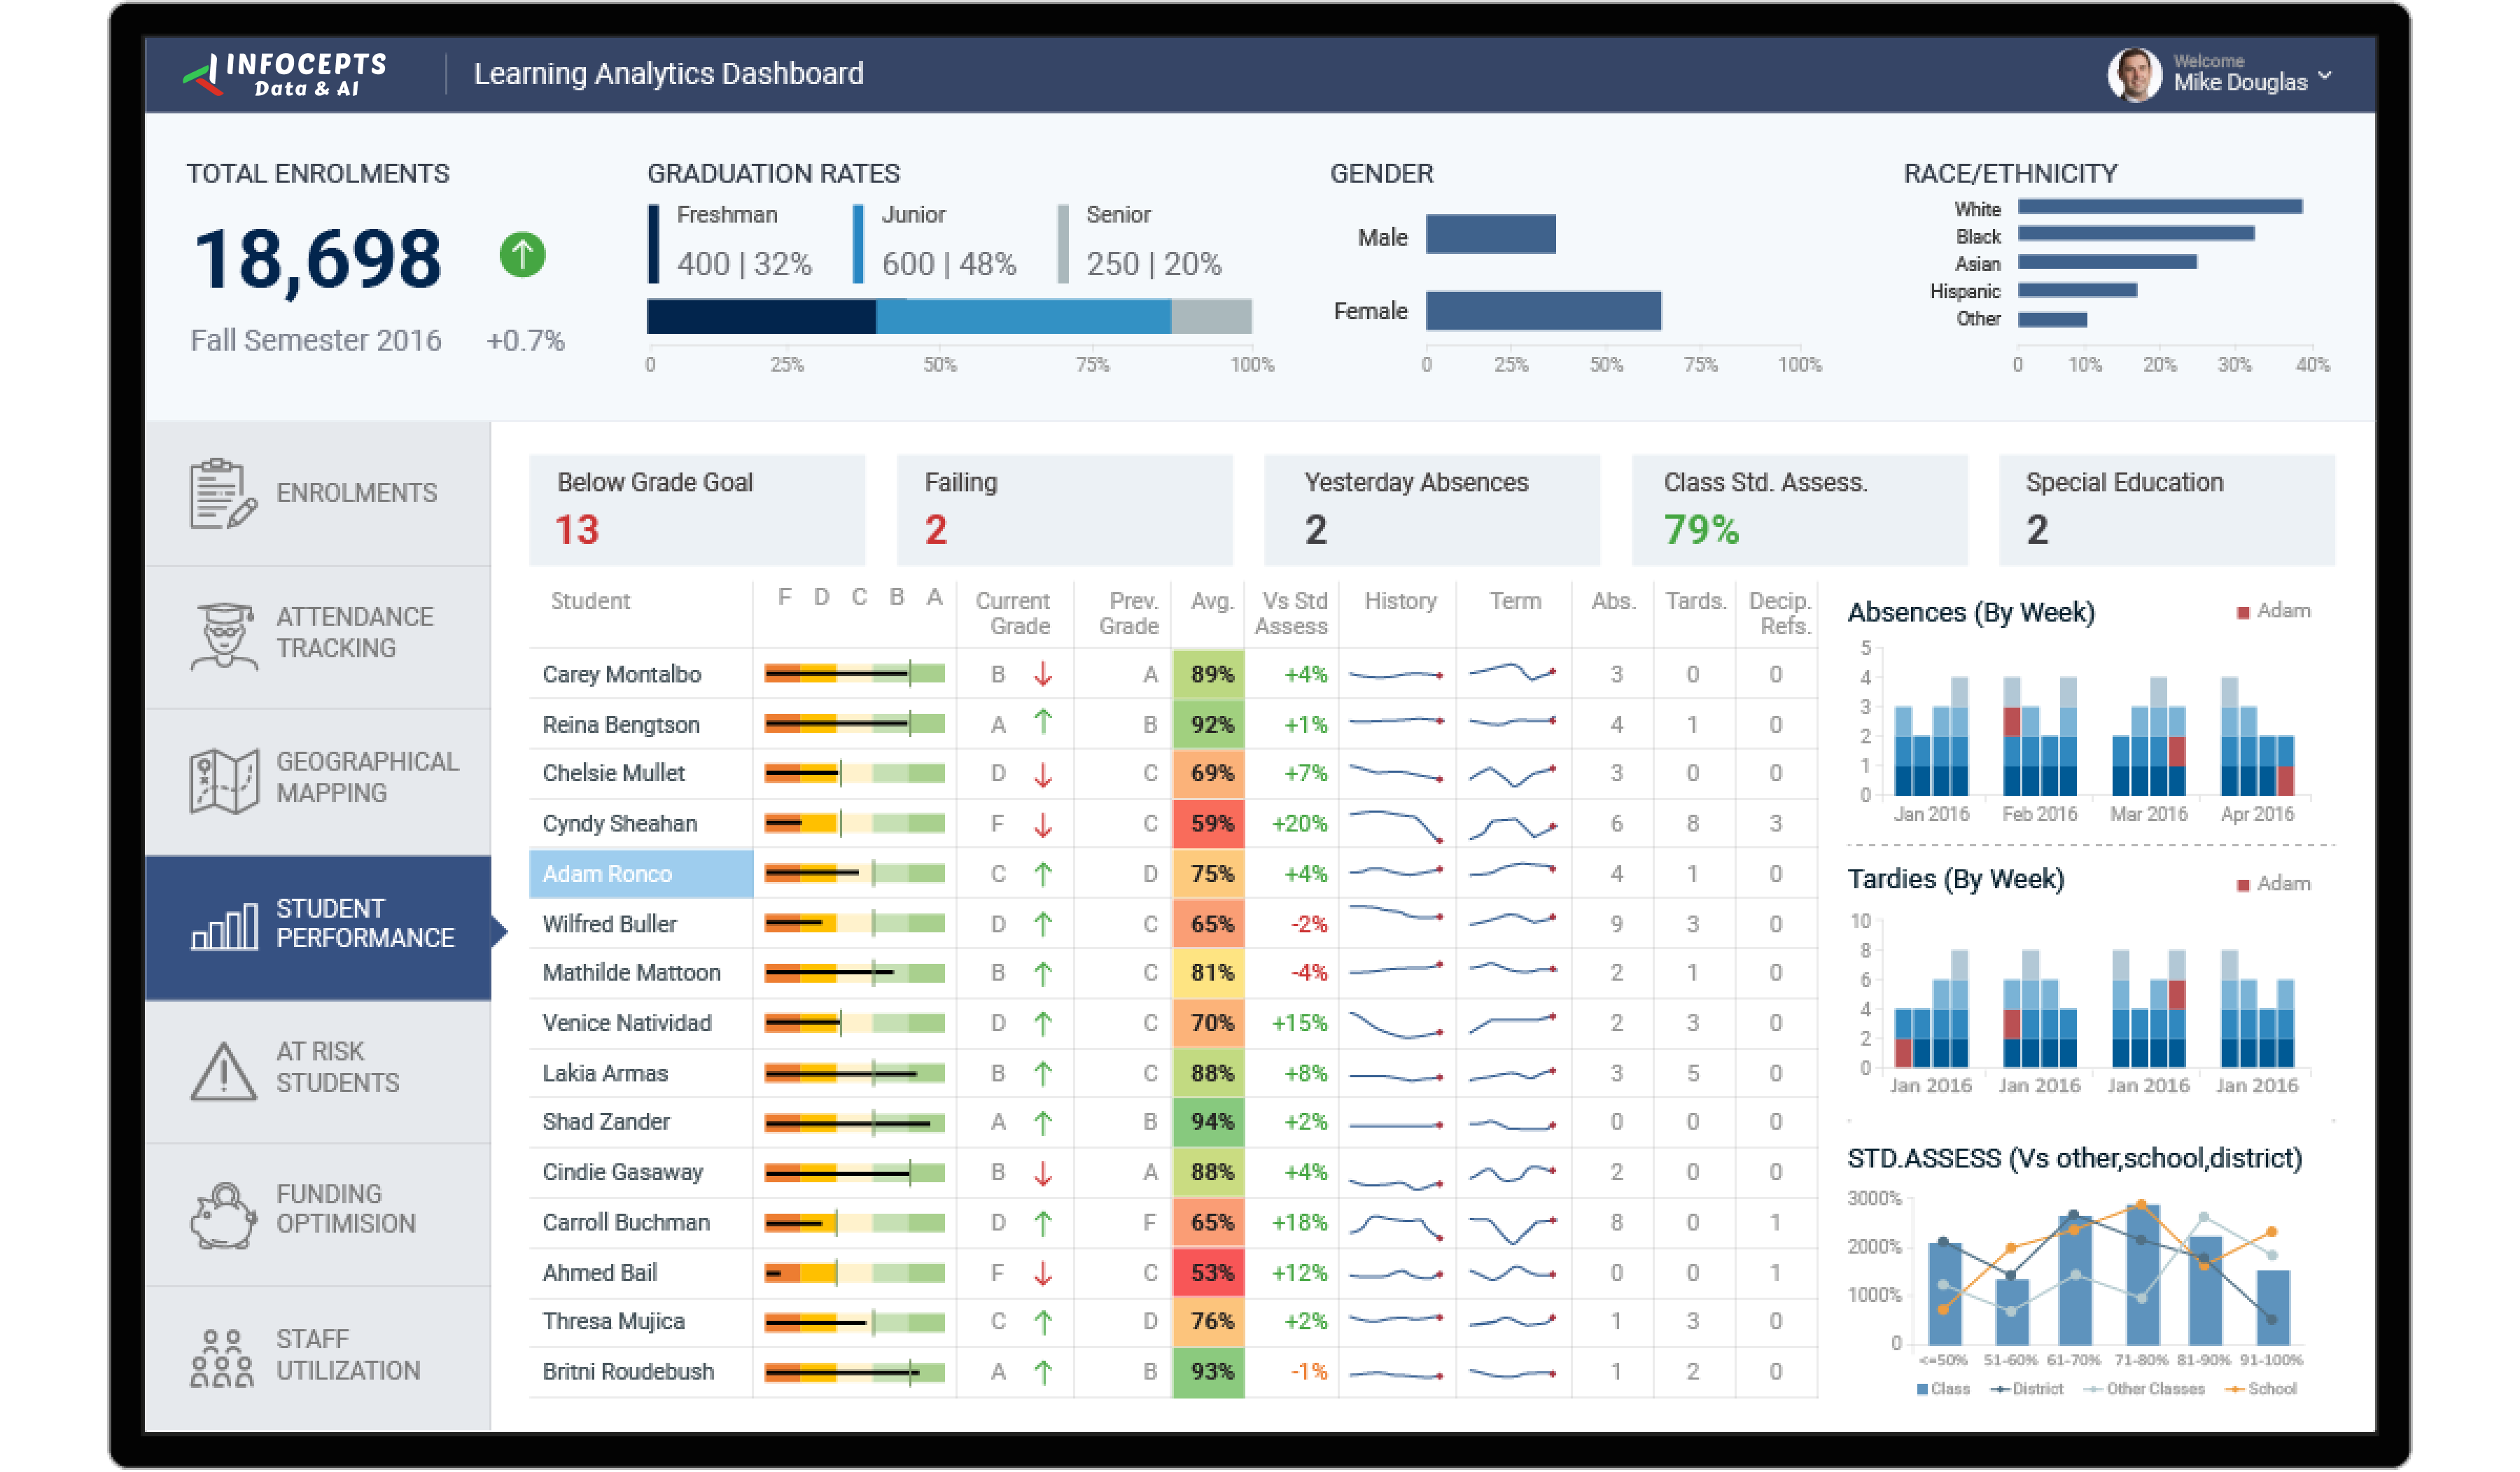
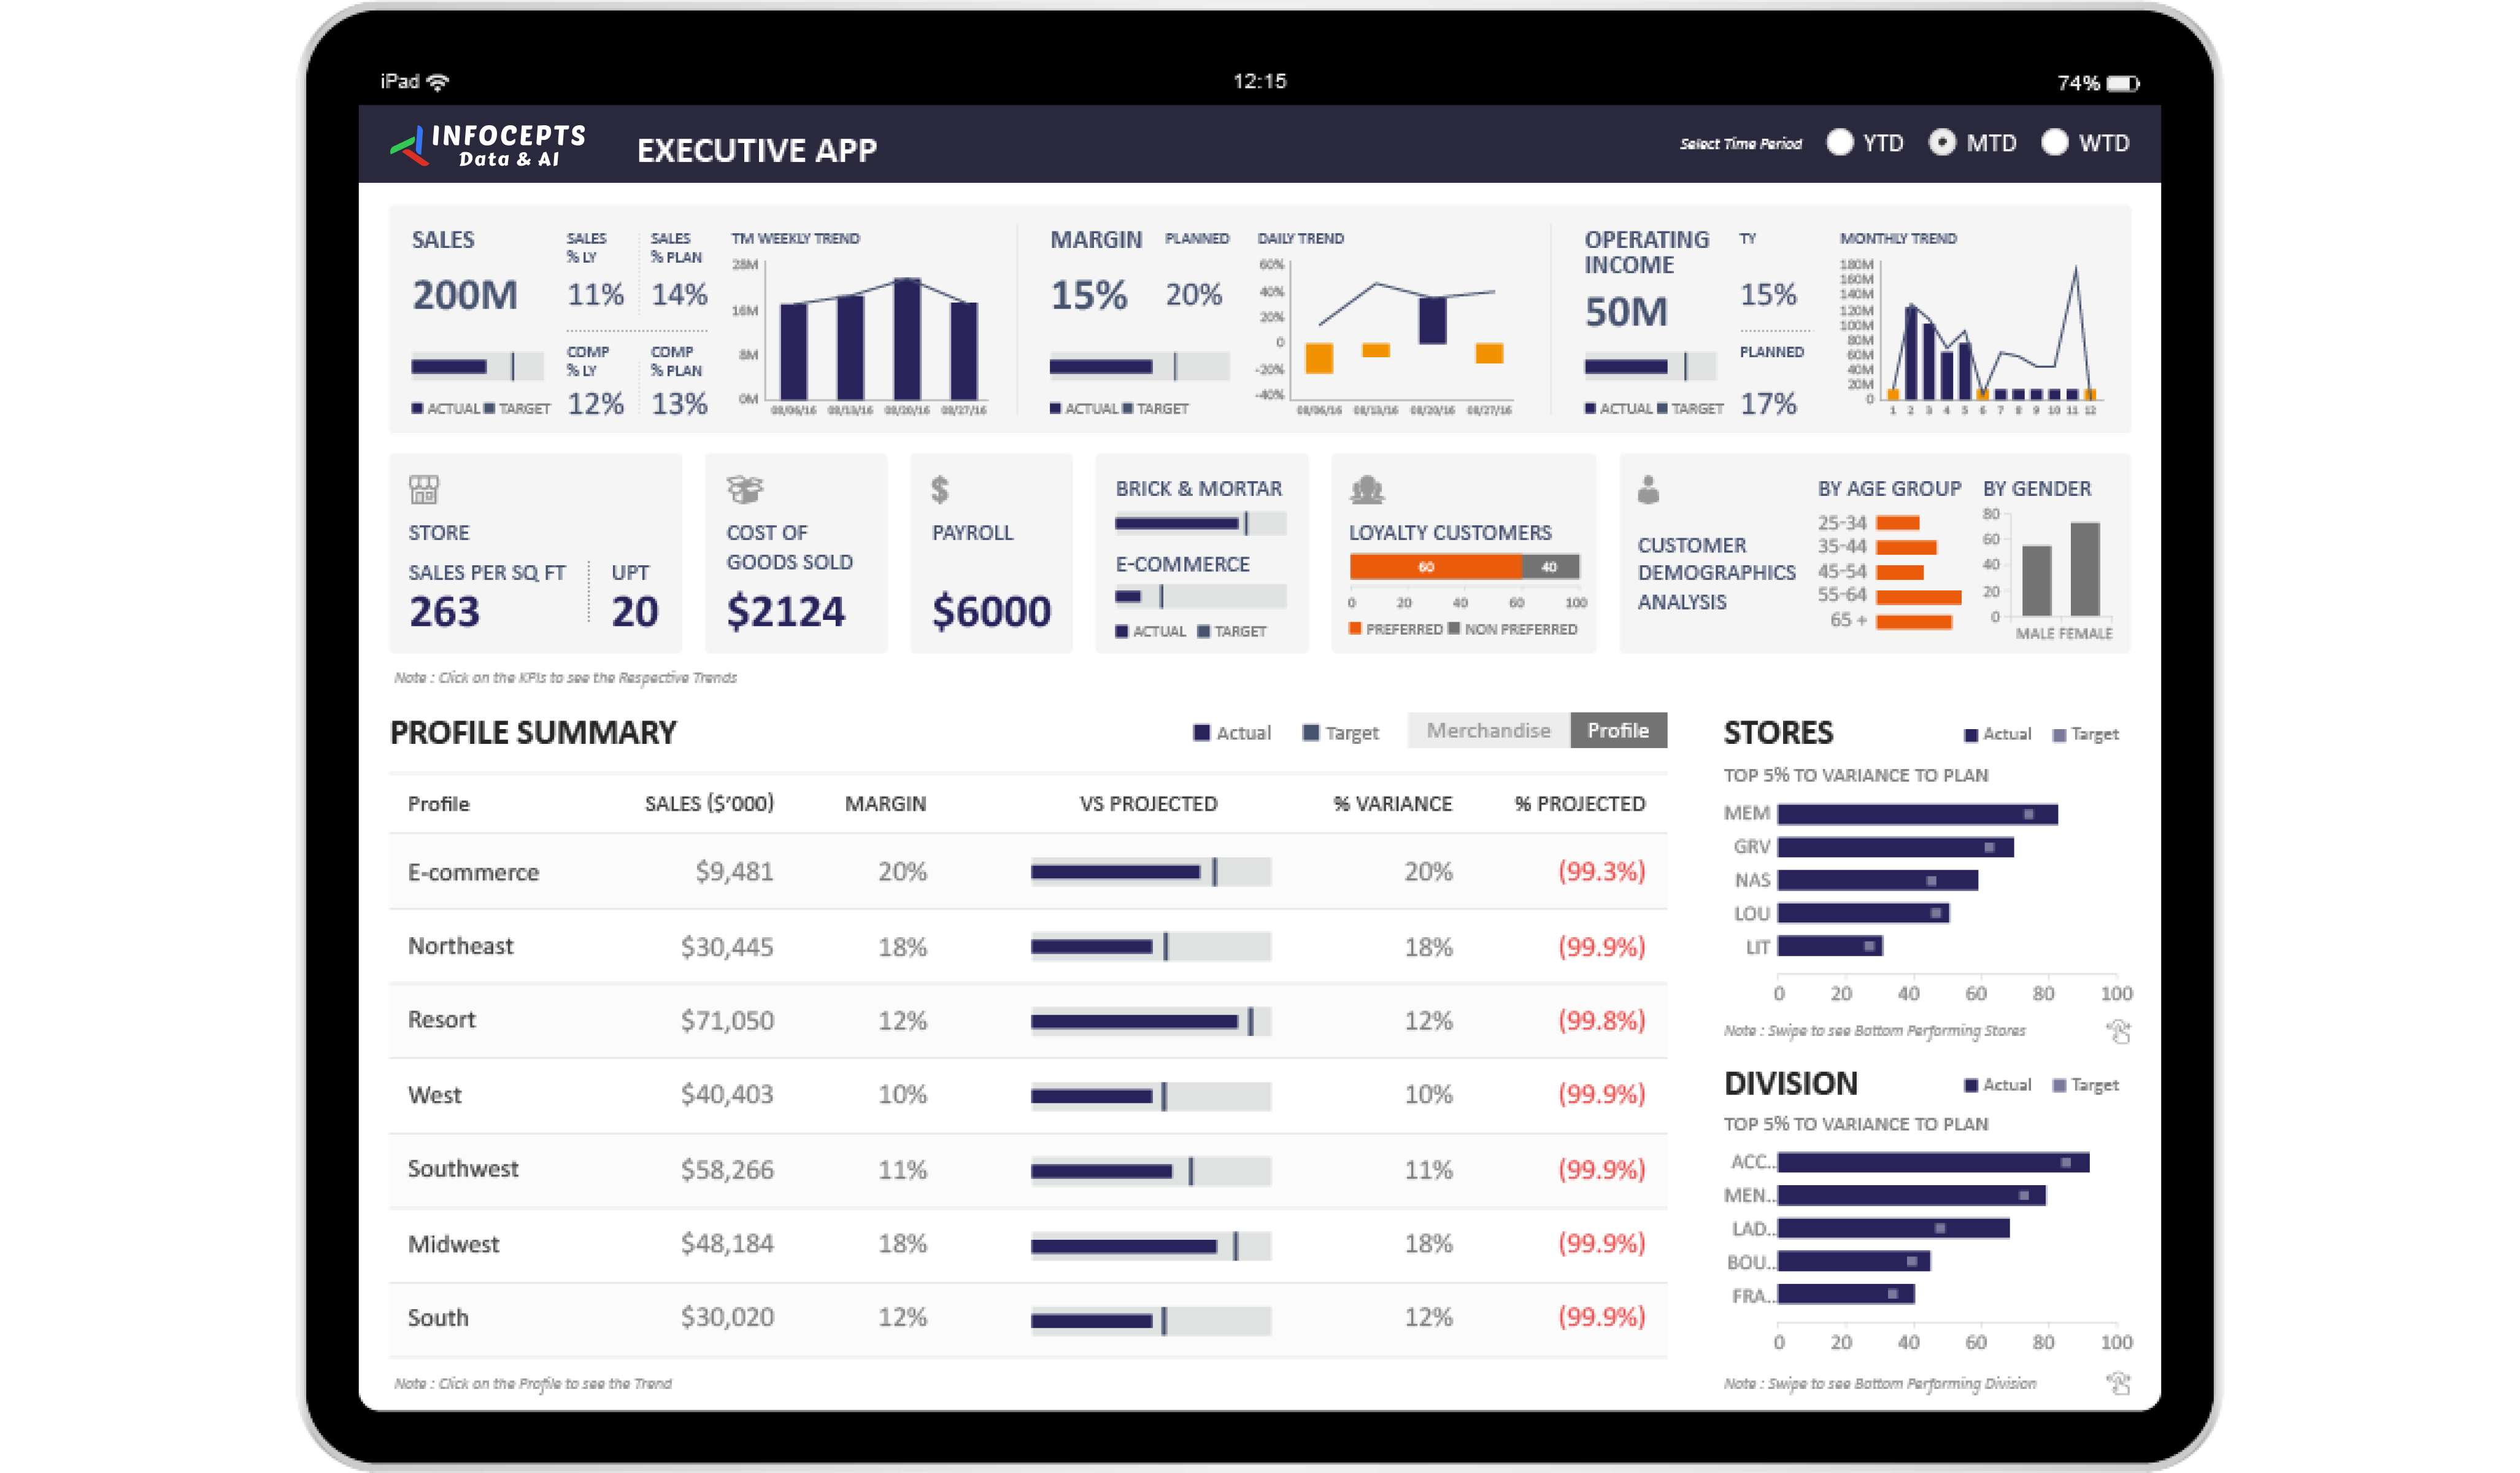
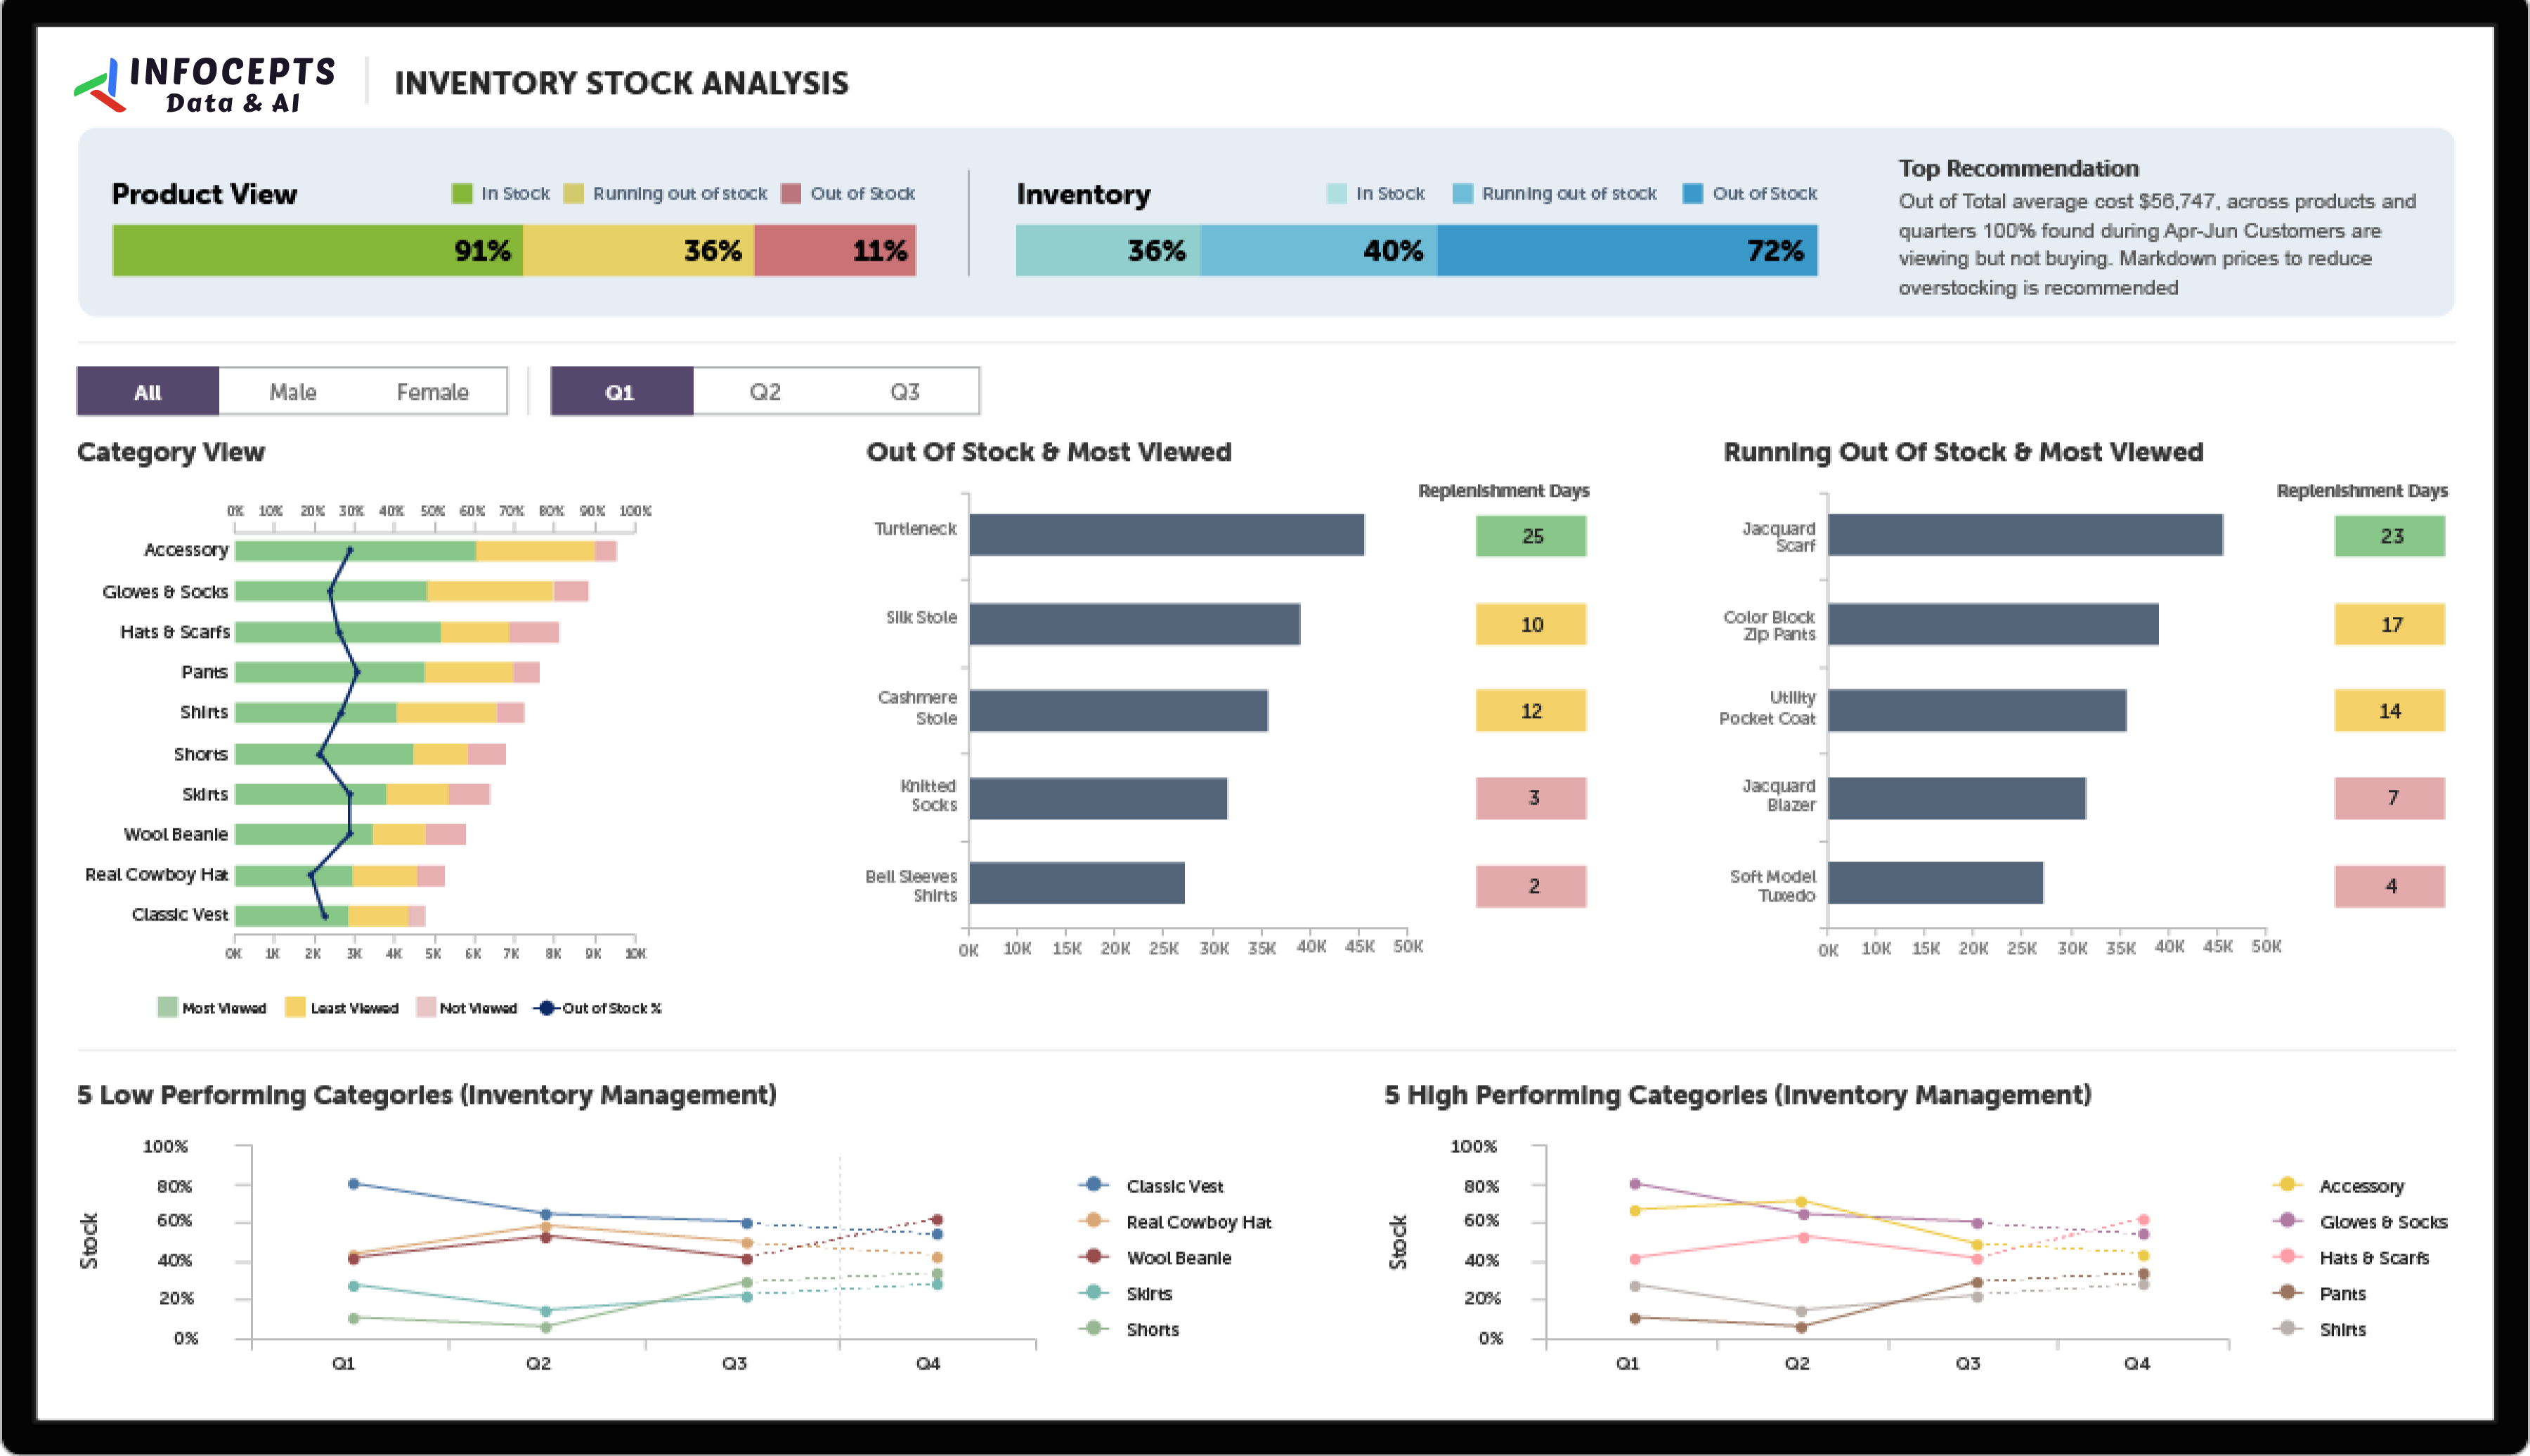
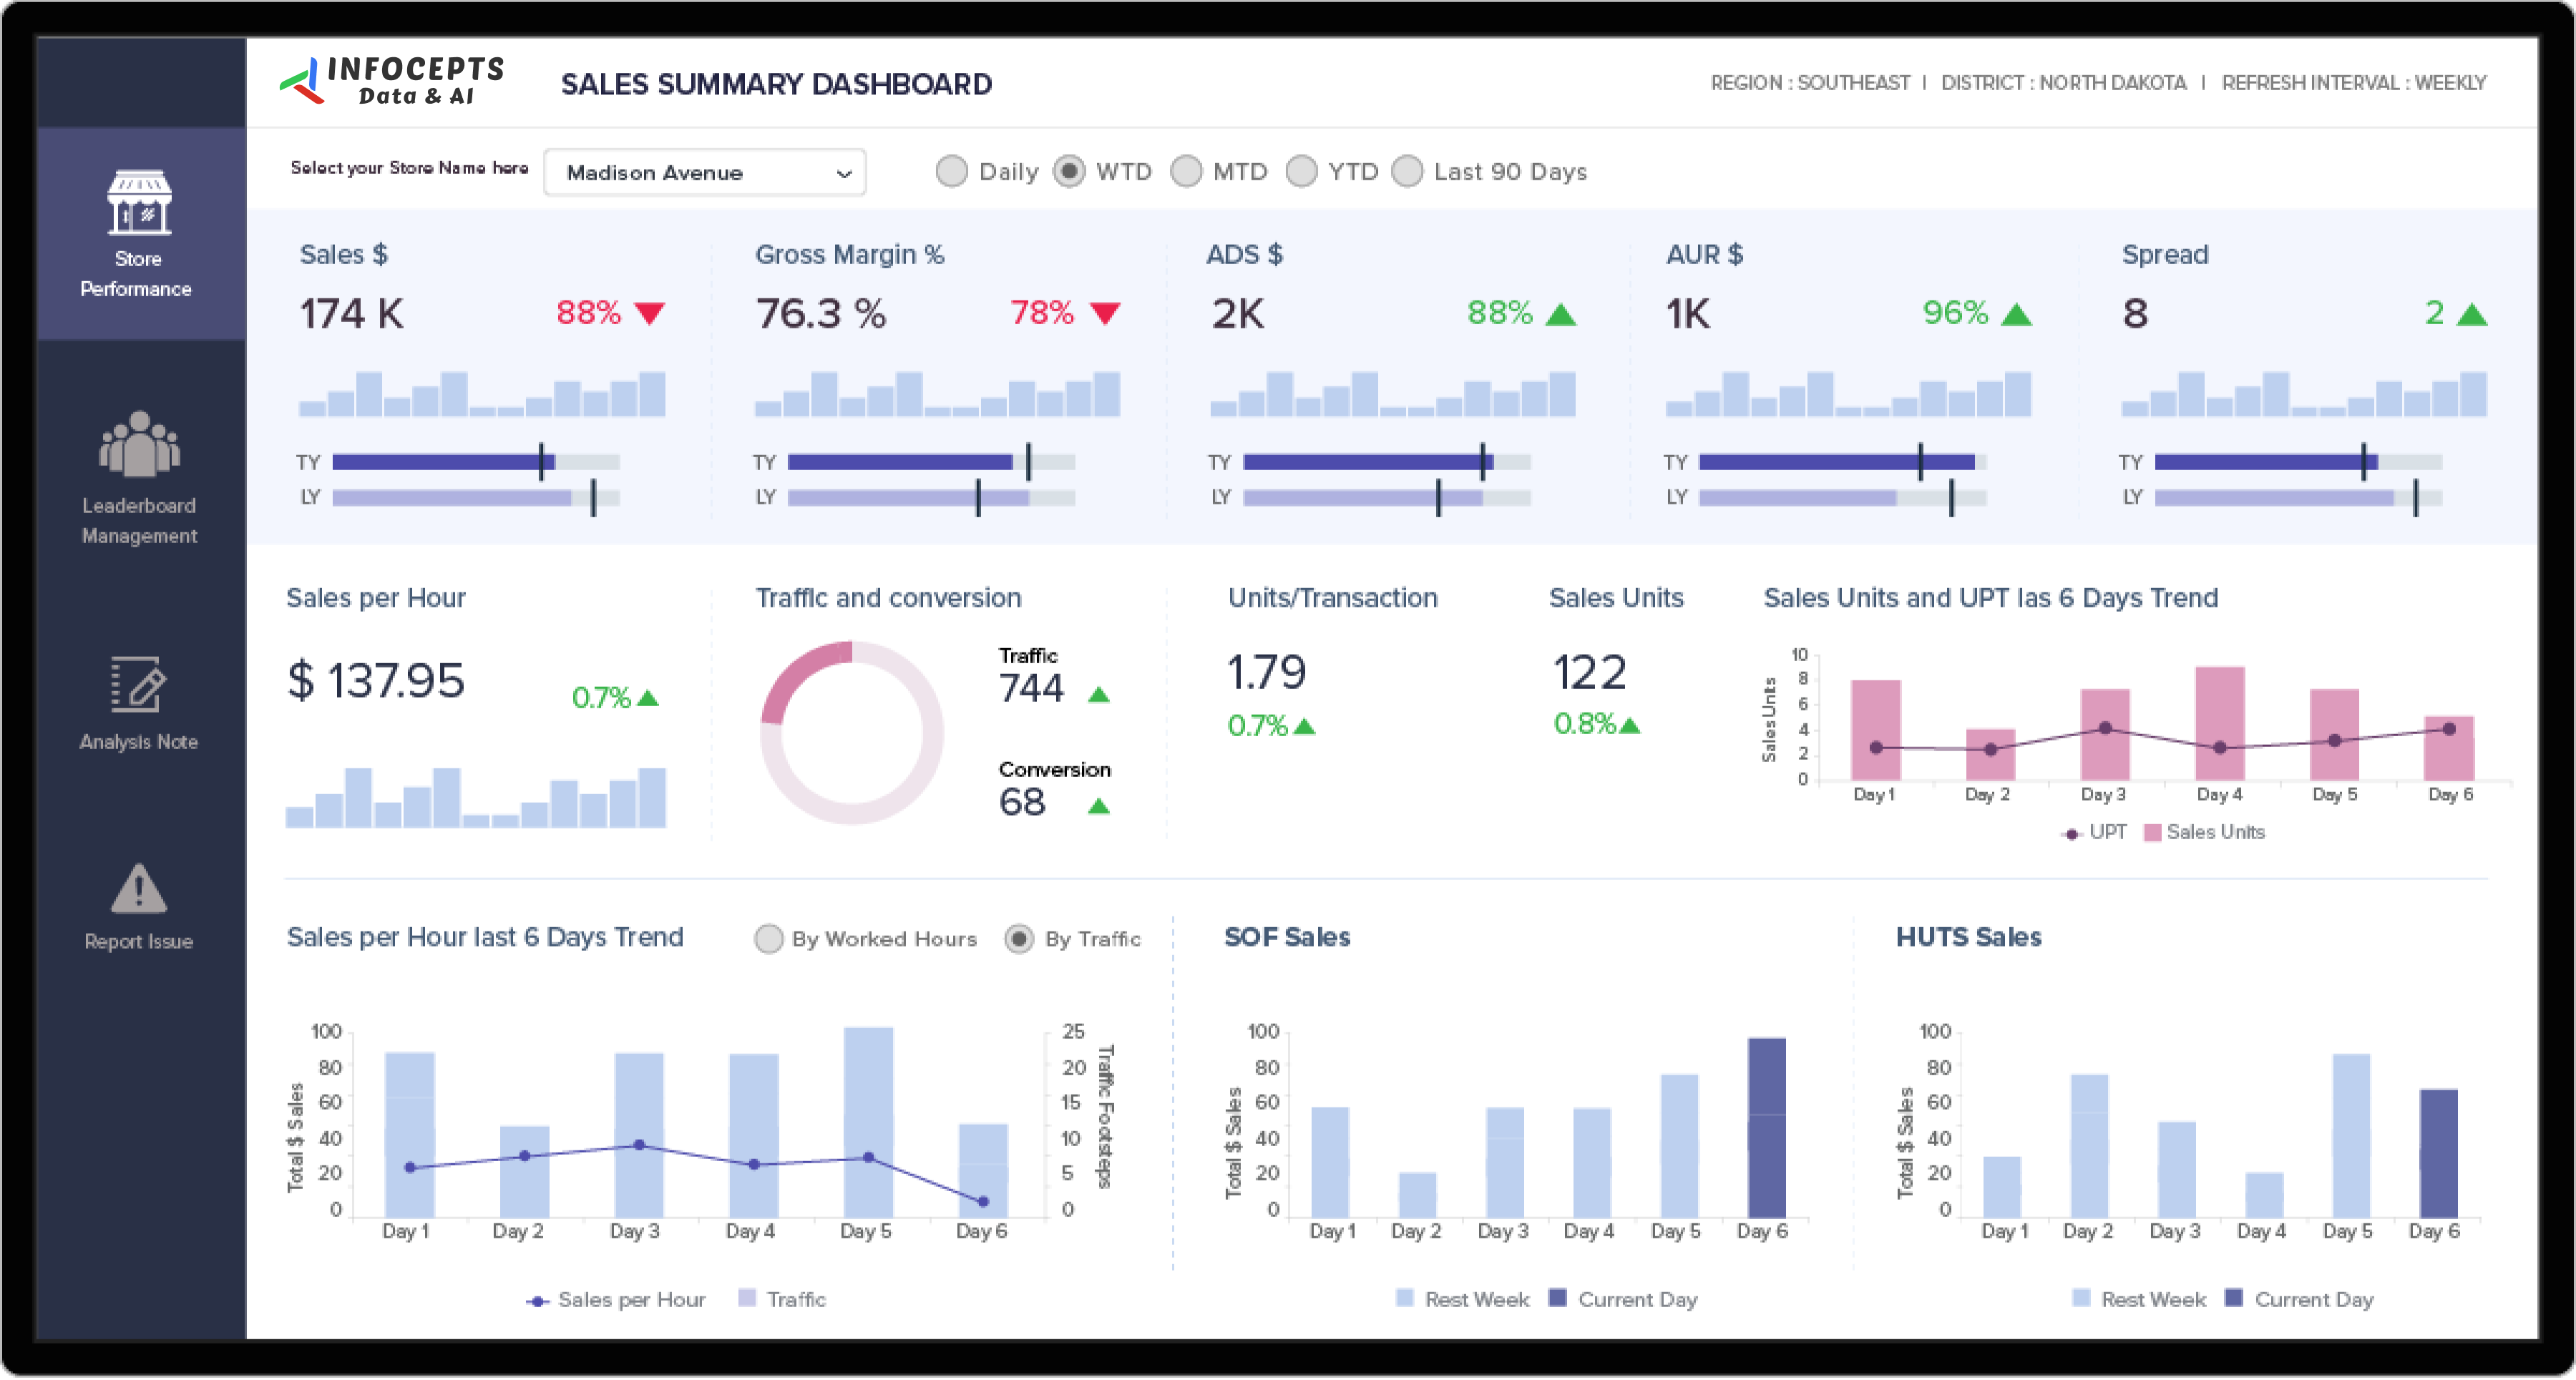
The Hourly Business Reporting Dashboard provides real-time insights into store operations across regions (East, West, Mid-East, South) with detailed district and store-level views. Users can track store openings and closures within specific timeframes (MTD, QTD, YTD, WTD), monitor operational hours, and identify overtime occurrences. With an intuitive UX design, the dashboard offers interactive visualizations, dynamic filters, and drill-down capabilities, enabling store managers and business leaders to enhance operational efficiency and make data-driven decisions.
Frequently asked questions
It tracks store operations, hours, and overtime at district and store level across regions, refreshed on an hourly basis rather than reviewed once a day or week.
Comparing MTD, QTD, YTD, and WTD views shows whether an issue is a one-off or a developing trend, which changes how urgently leadership needs to respond.
Flagging overtime occurrences as they happen, broken down by store and district, lets managers address a scheduling problem before it becomes a recurring cost.
Store managers and business leaders responsible for operational efficiency across multiple regions and districts.
The hourly refresh cadence means operational issues surface within the same shift, not after a reporting cycle closes.
By connecting store systems into a BI platform through Business Analytics services, for Retail & CPG organizations managing multi-region operations.

 Pranali Lanjewar