
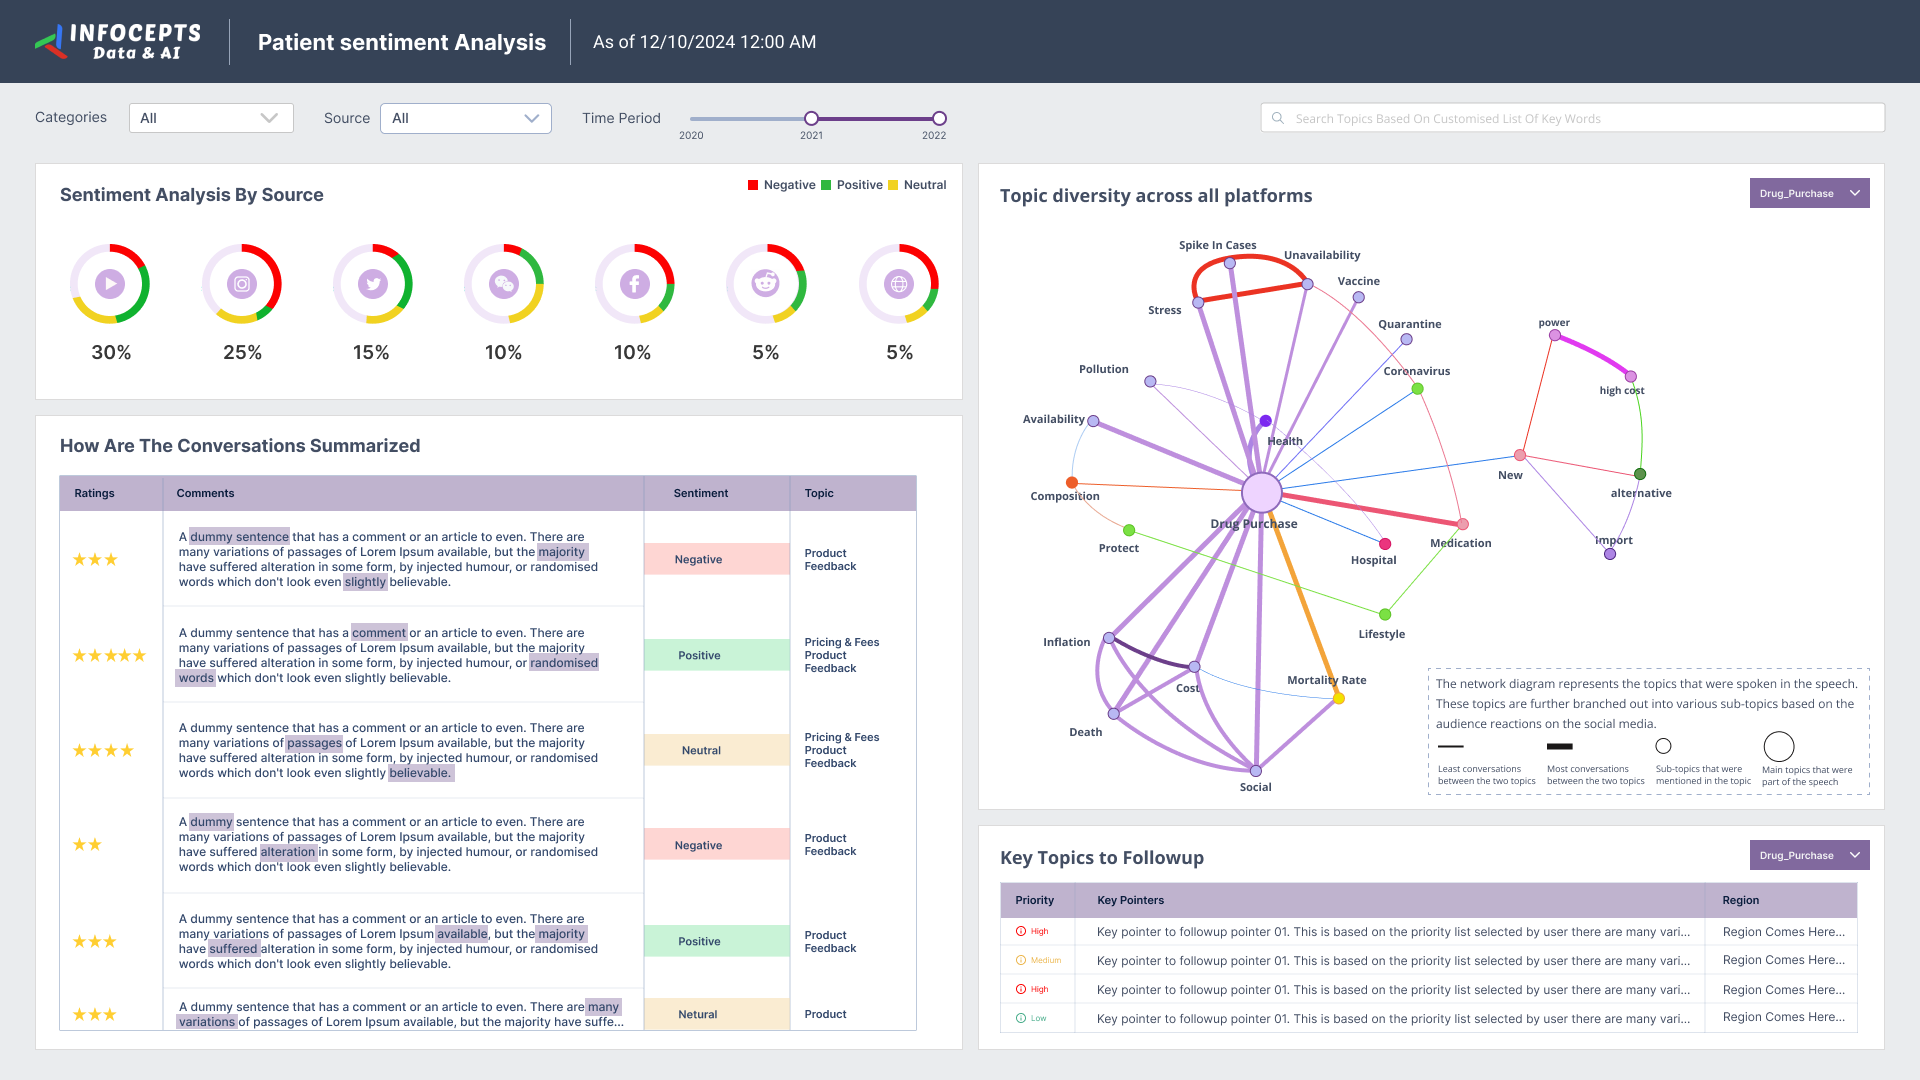
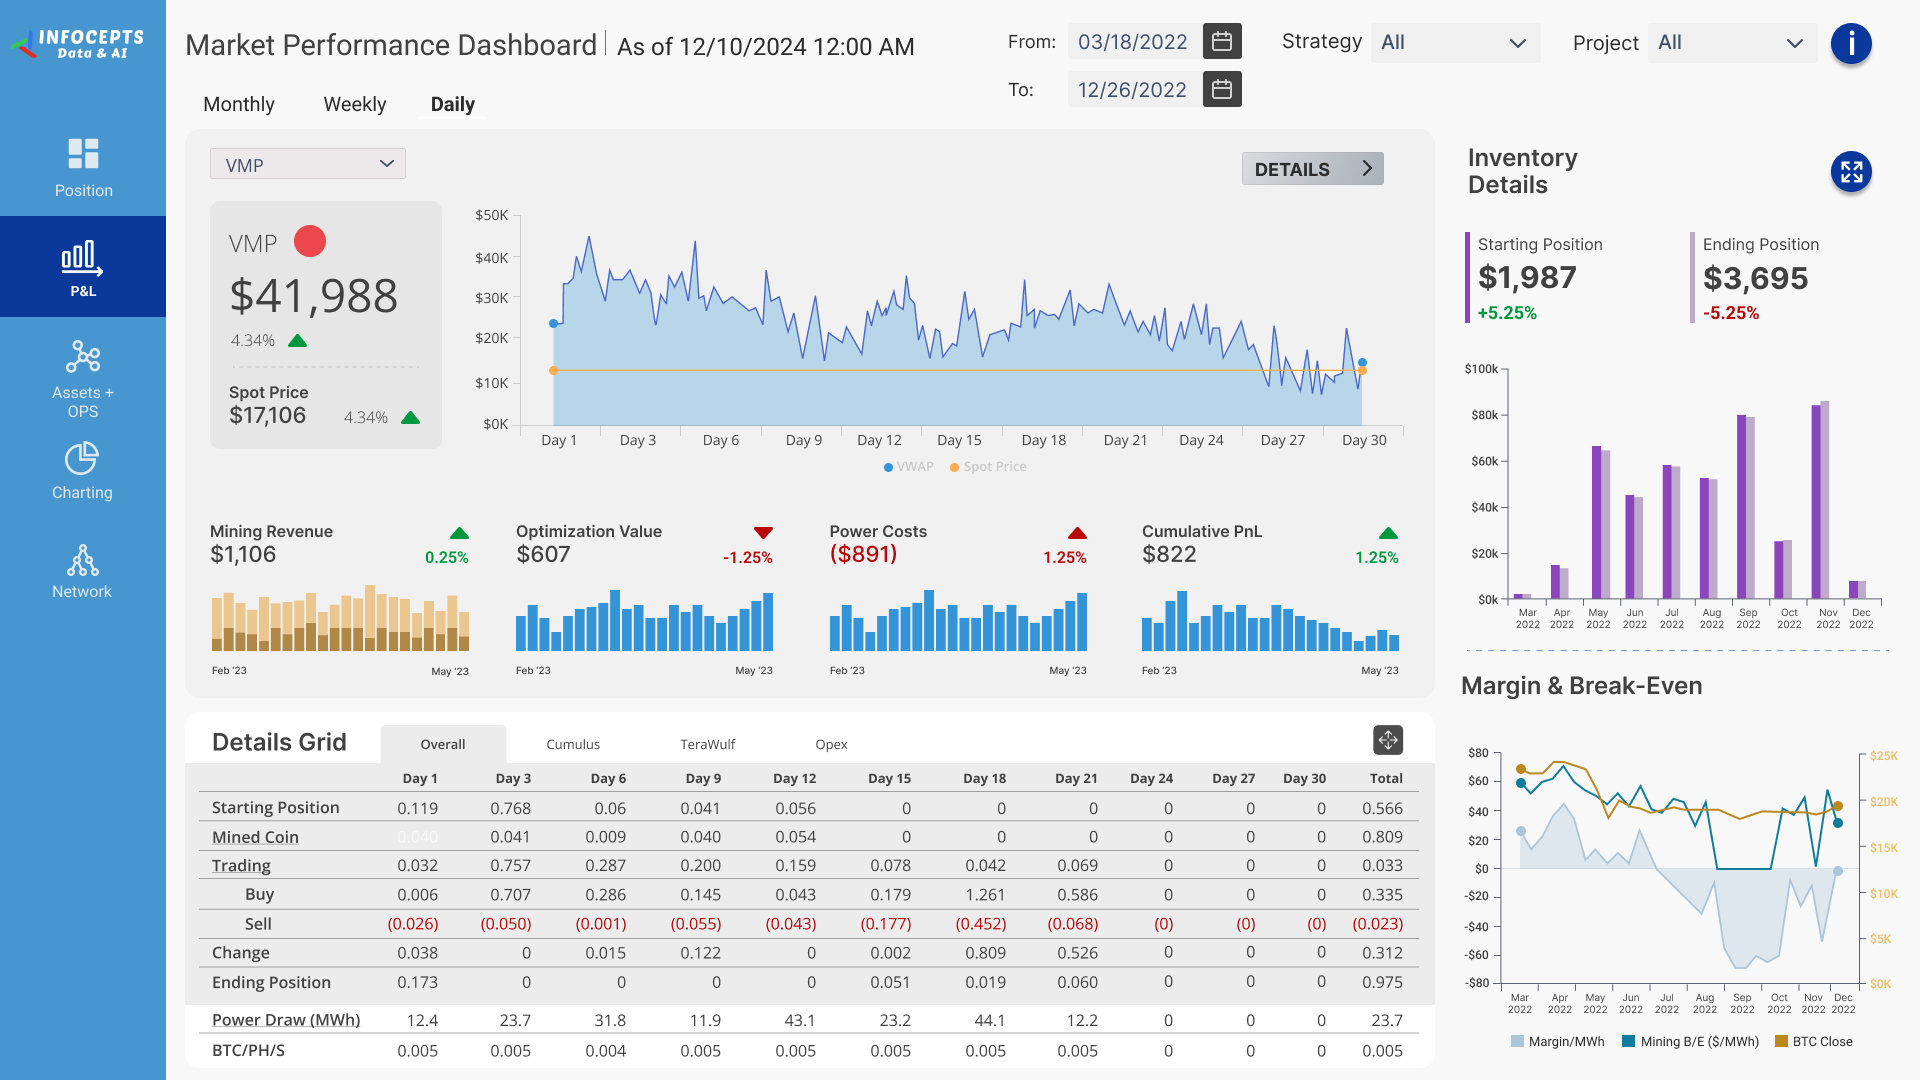
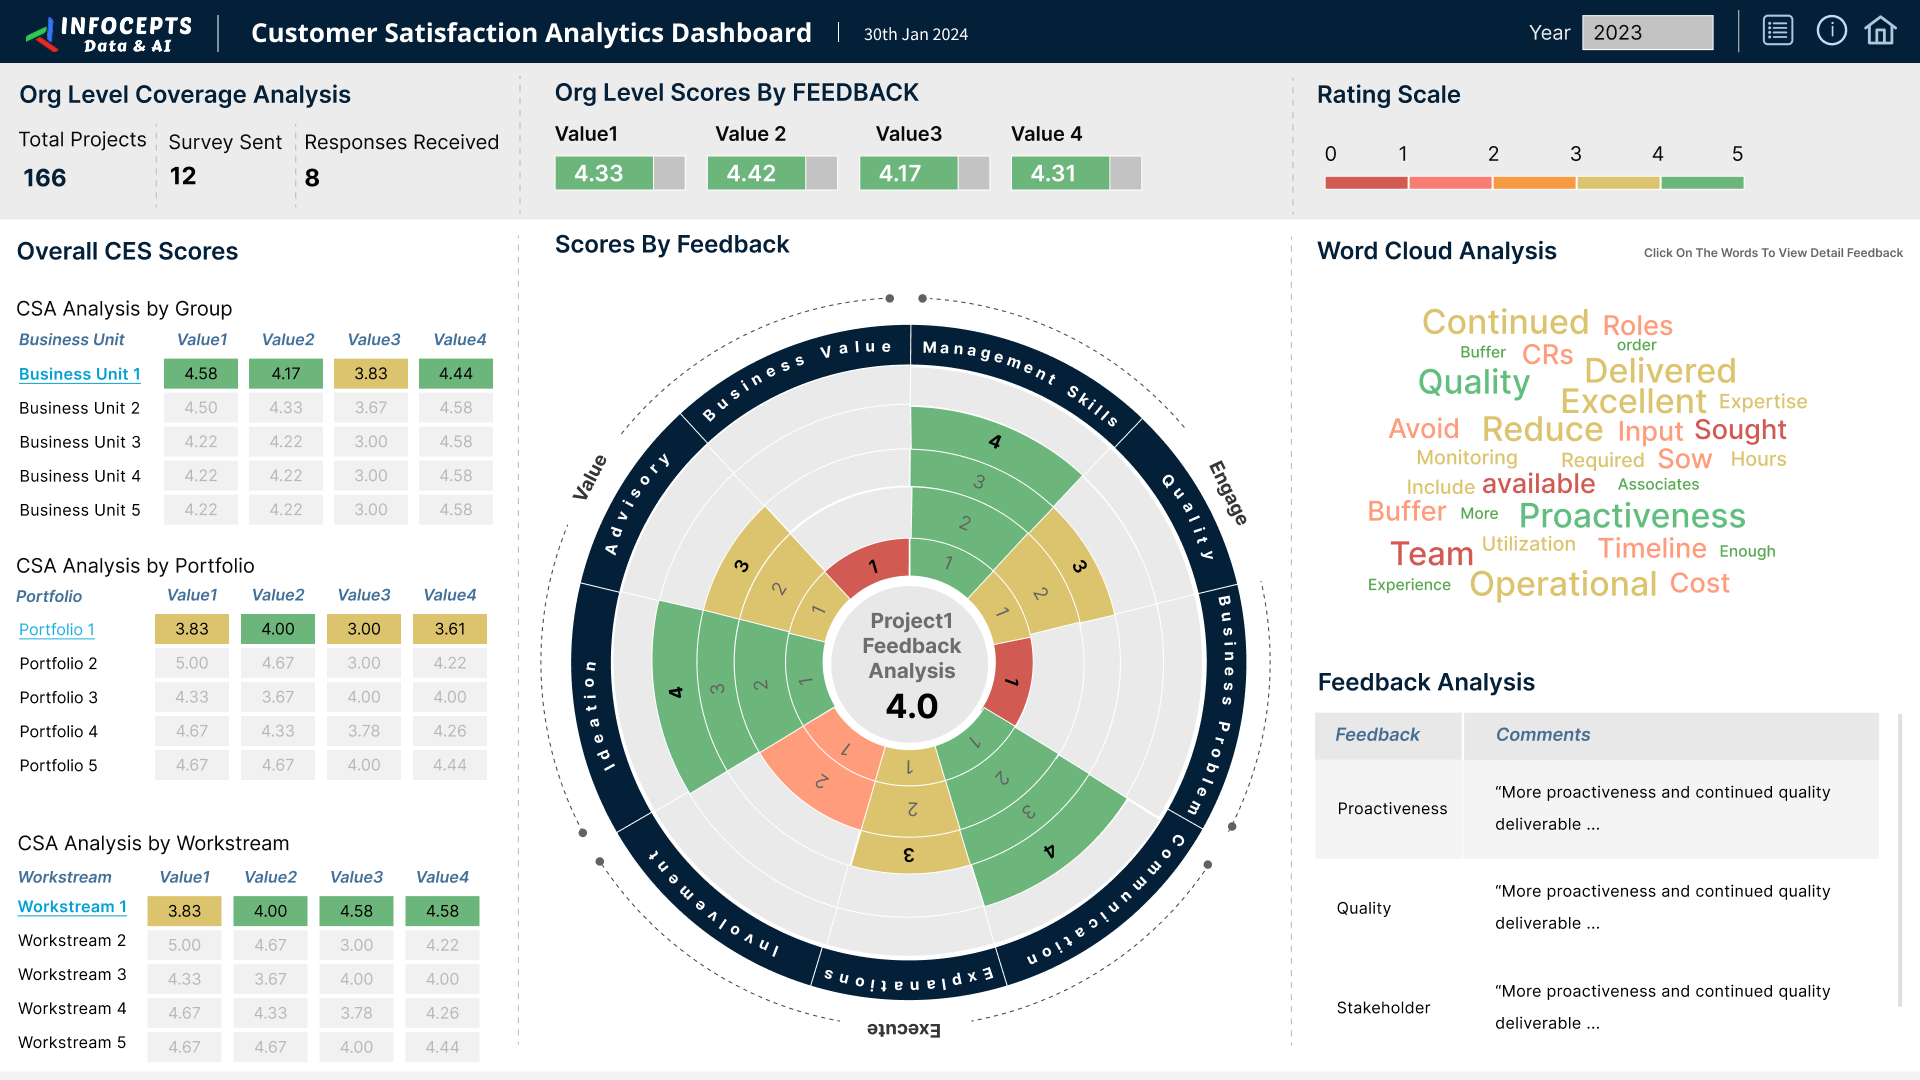
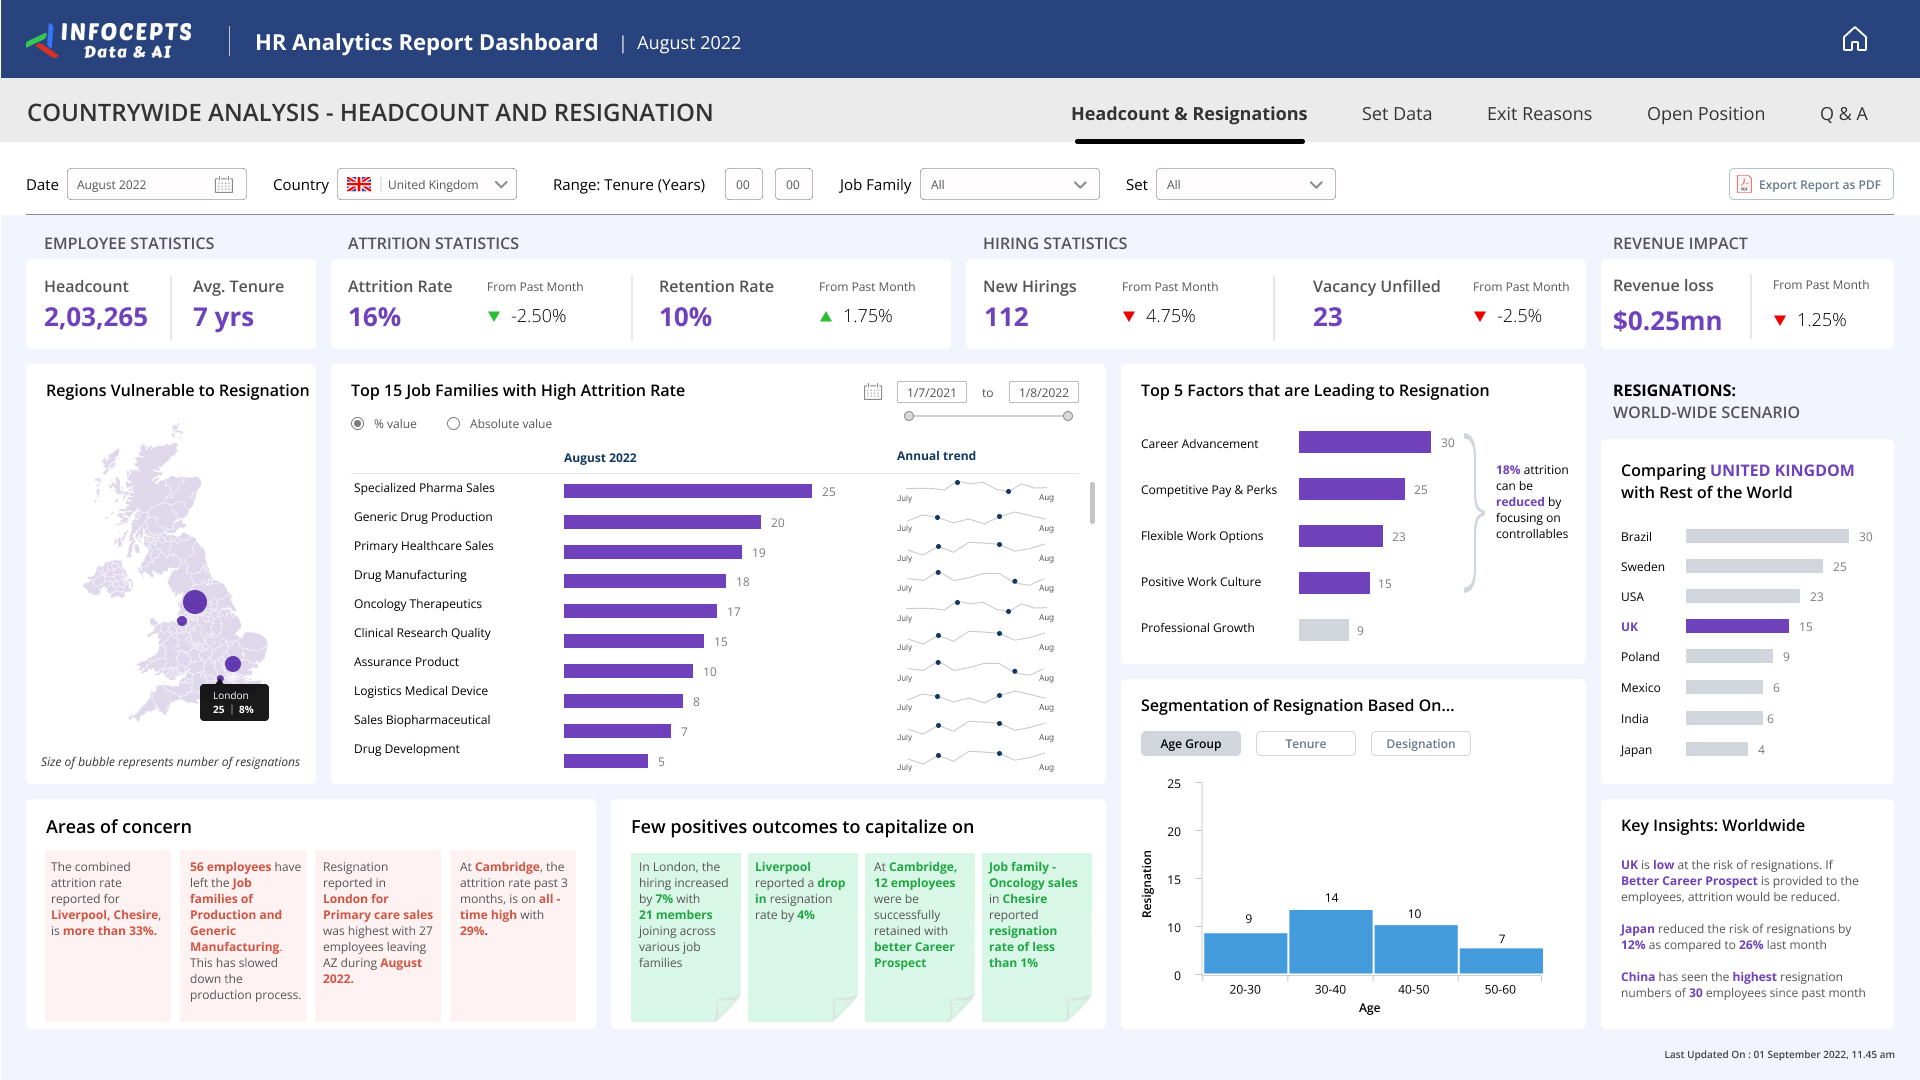




43%
Increase in Sustainability Awareness
35%
Rise in Green Technology Implementation
45%
Growth in Sustainable Practices Adoption
31%
Boost in Decision-Making Efficiency
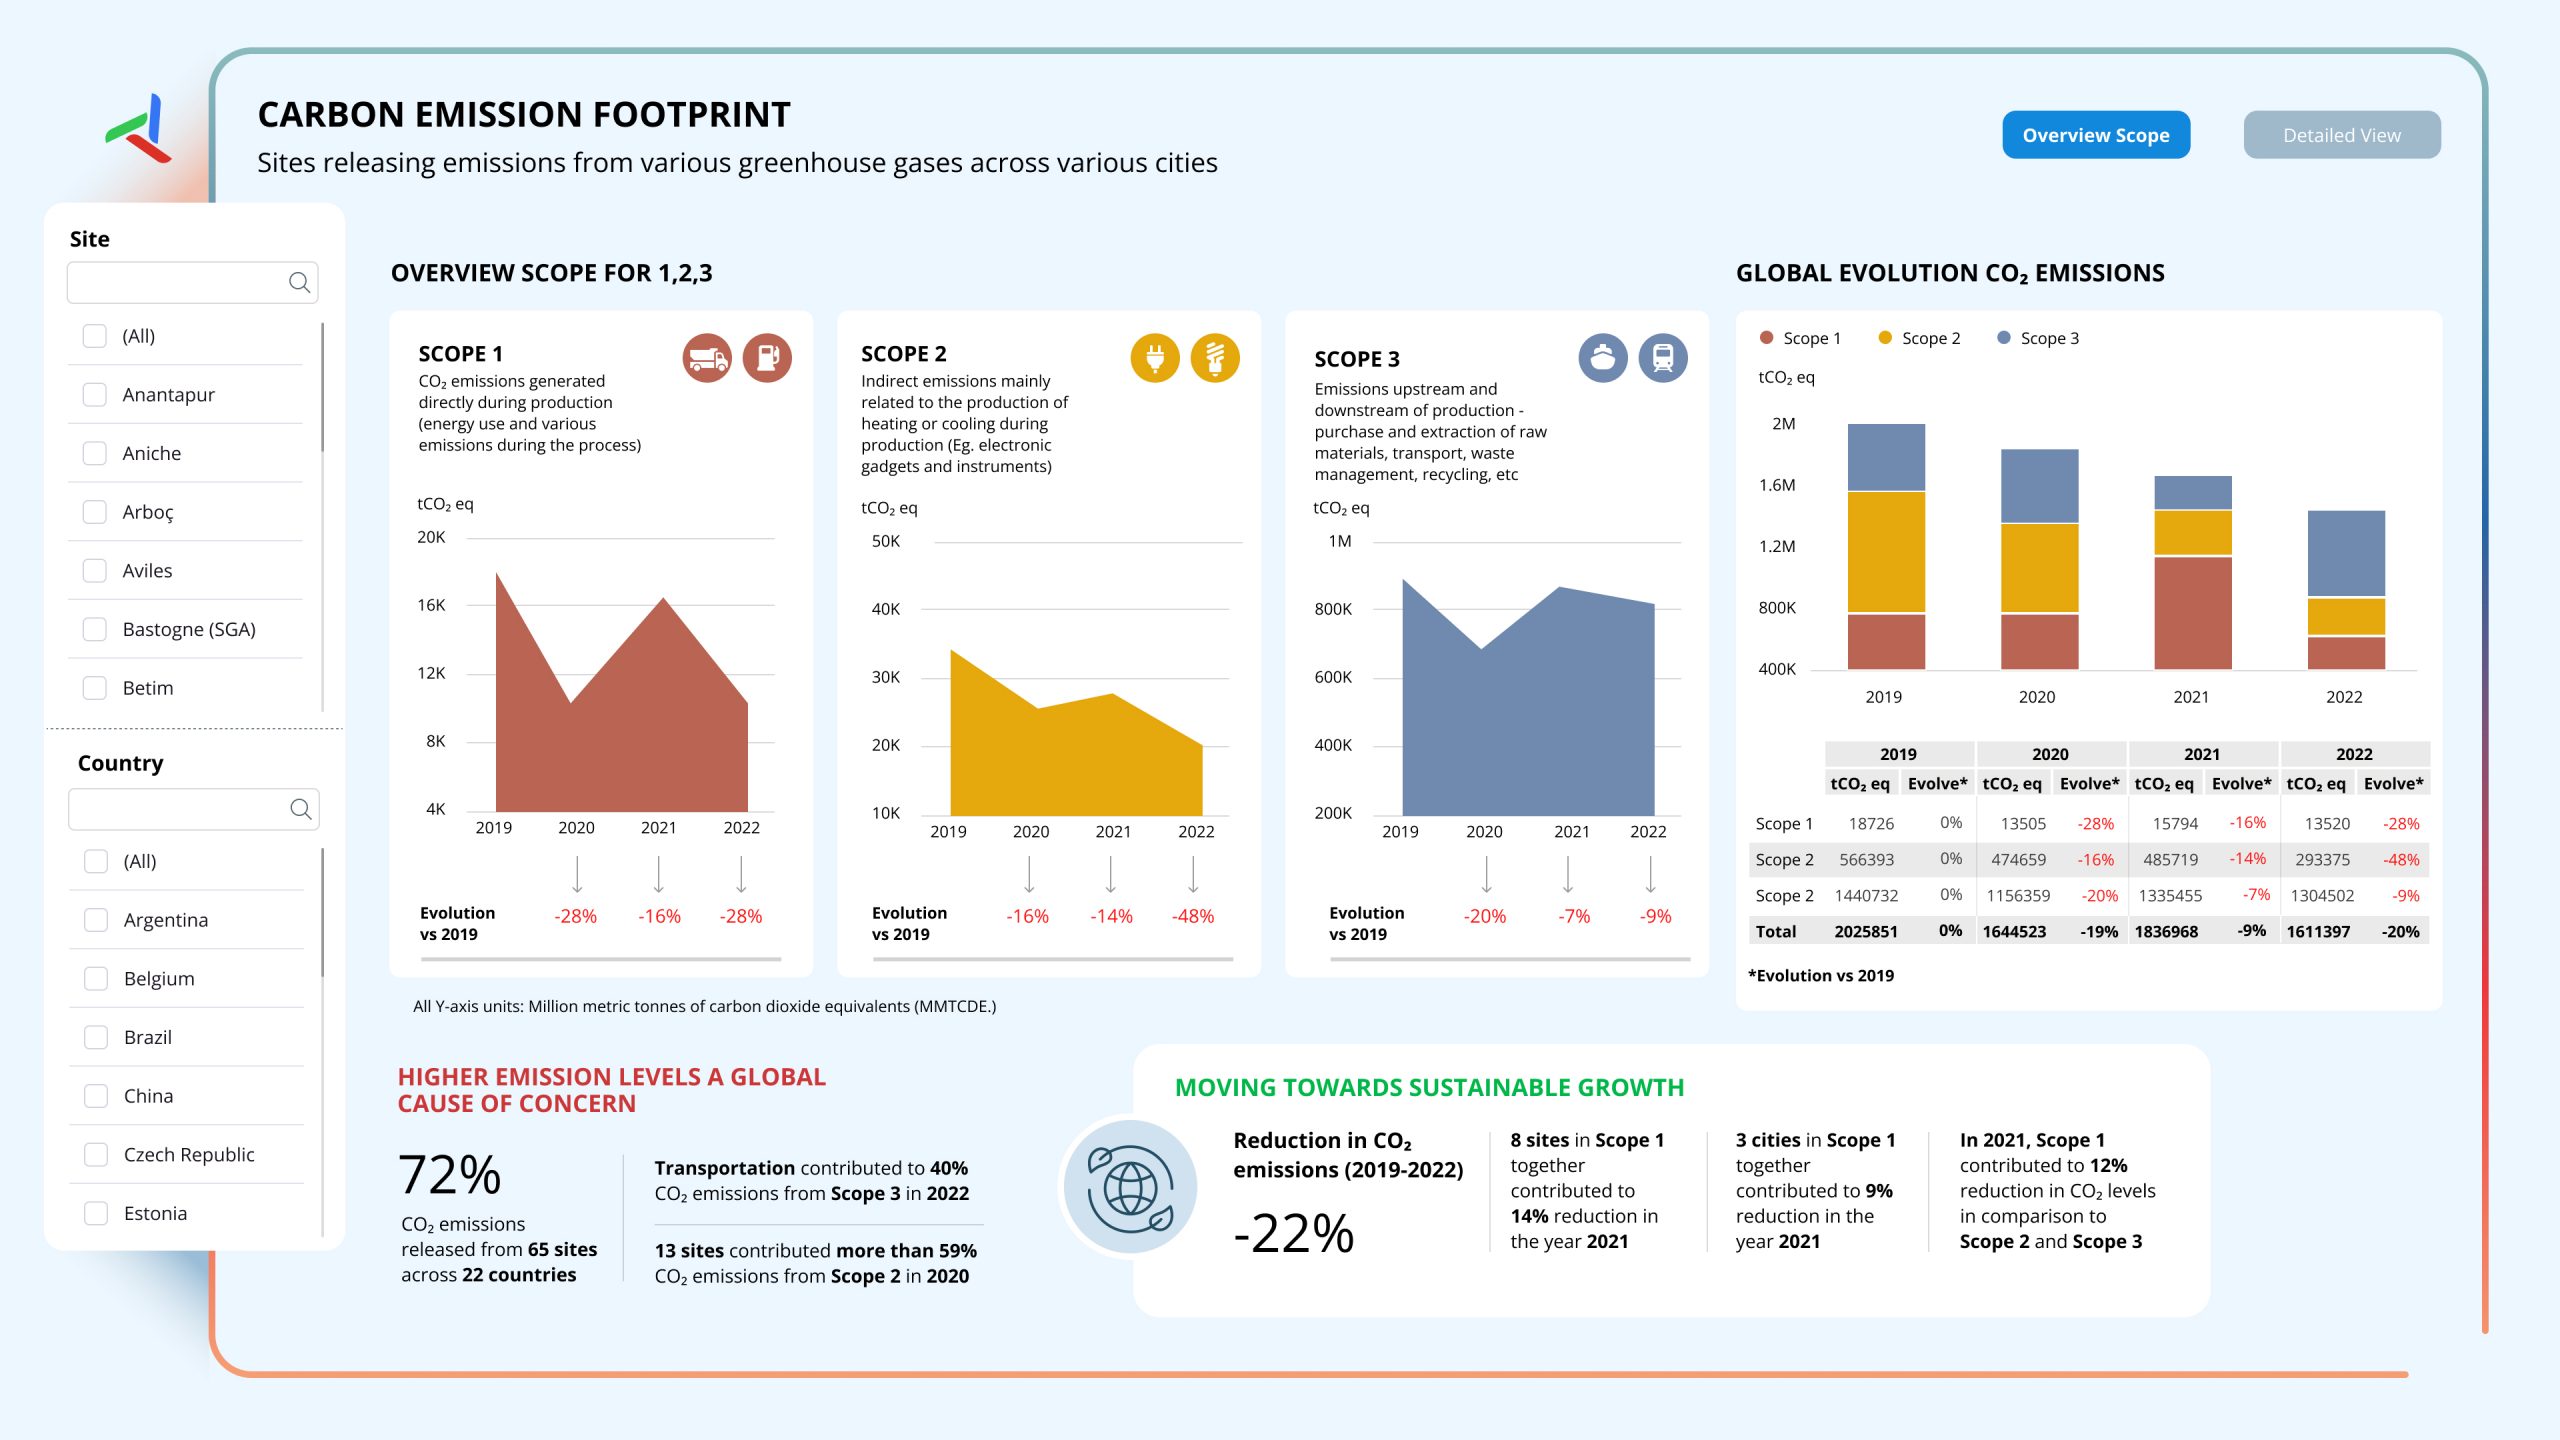
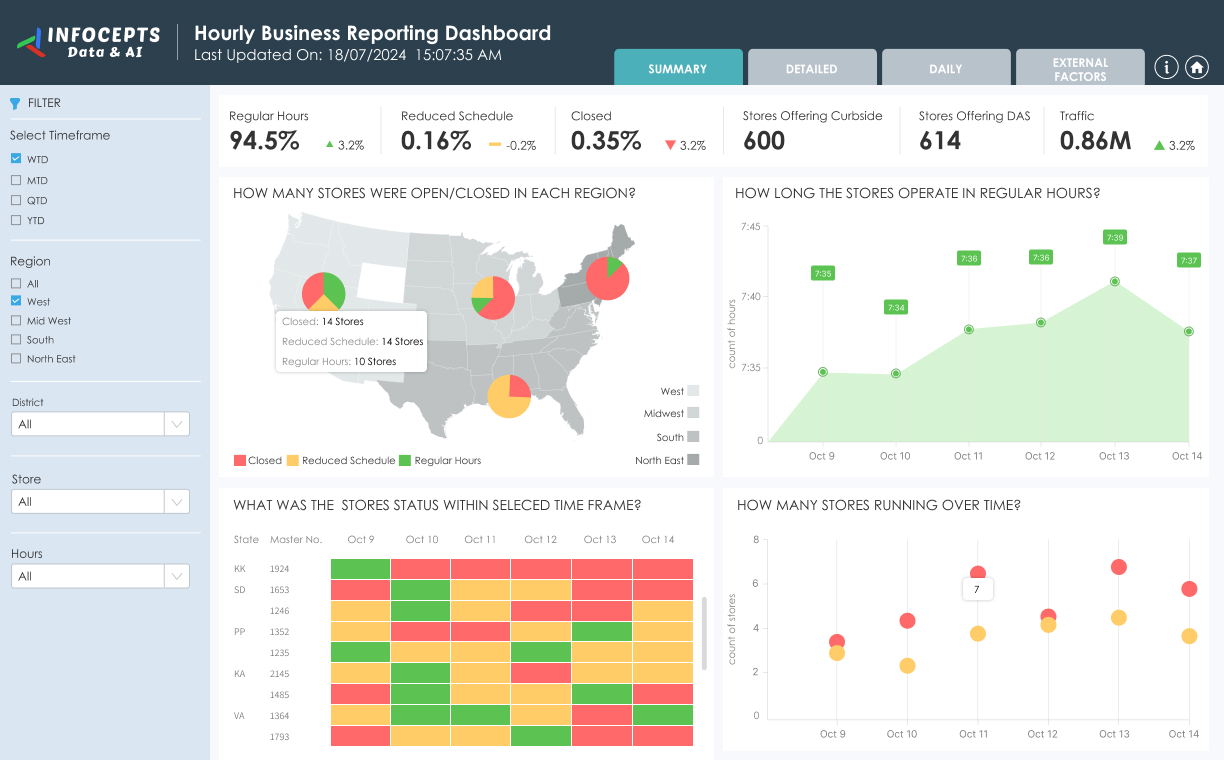
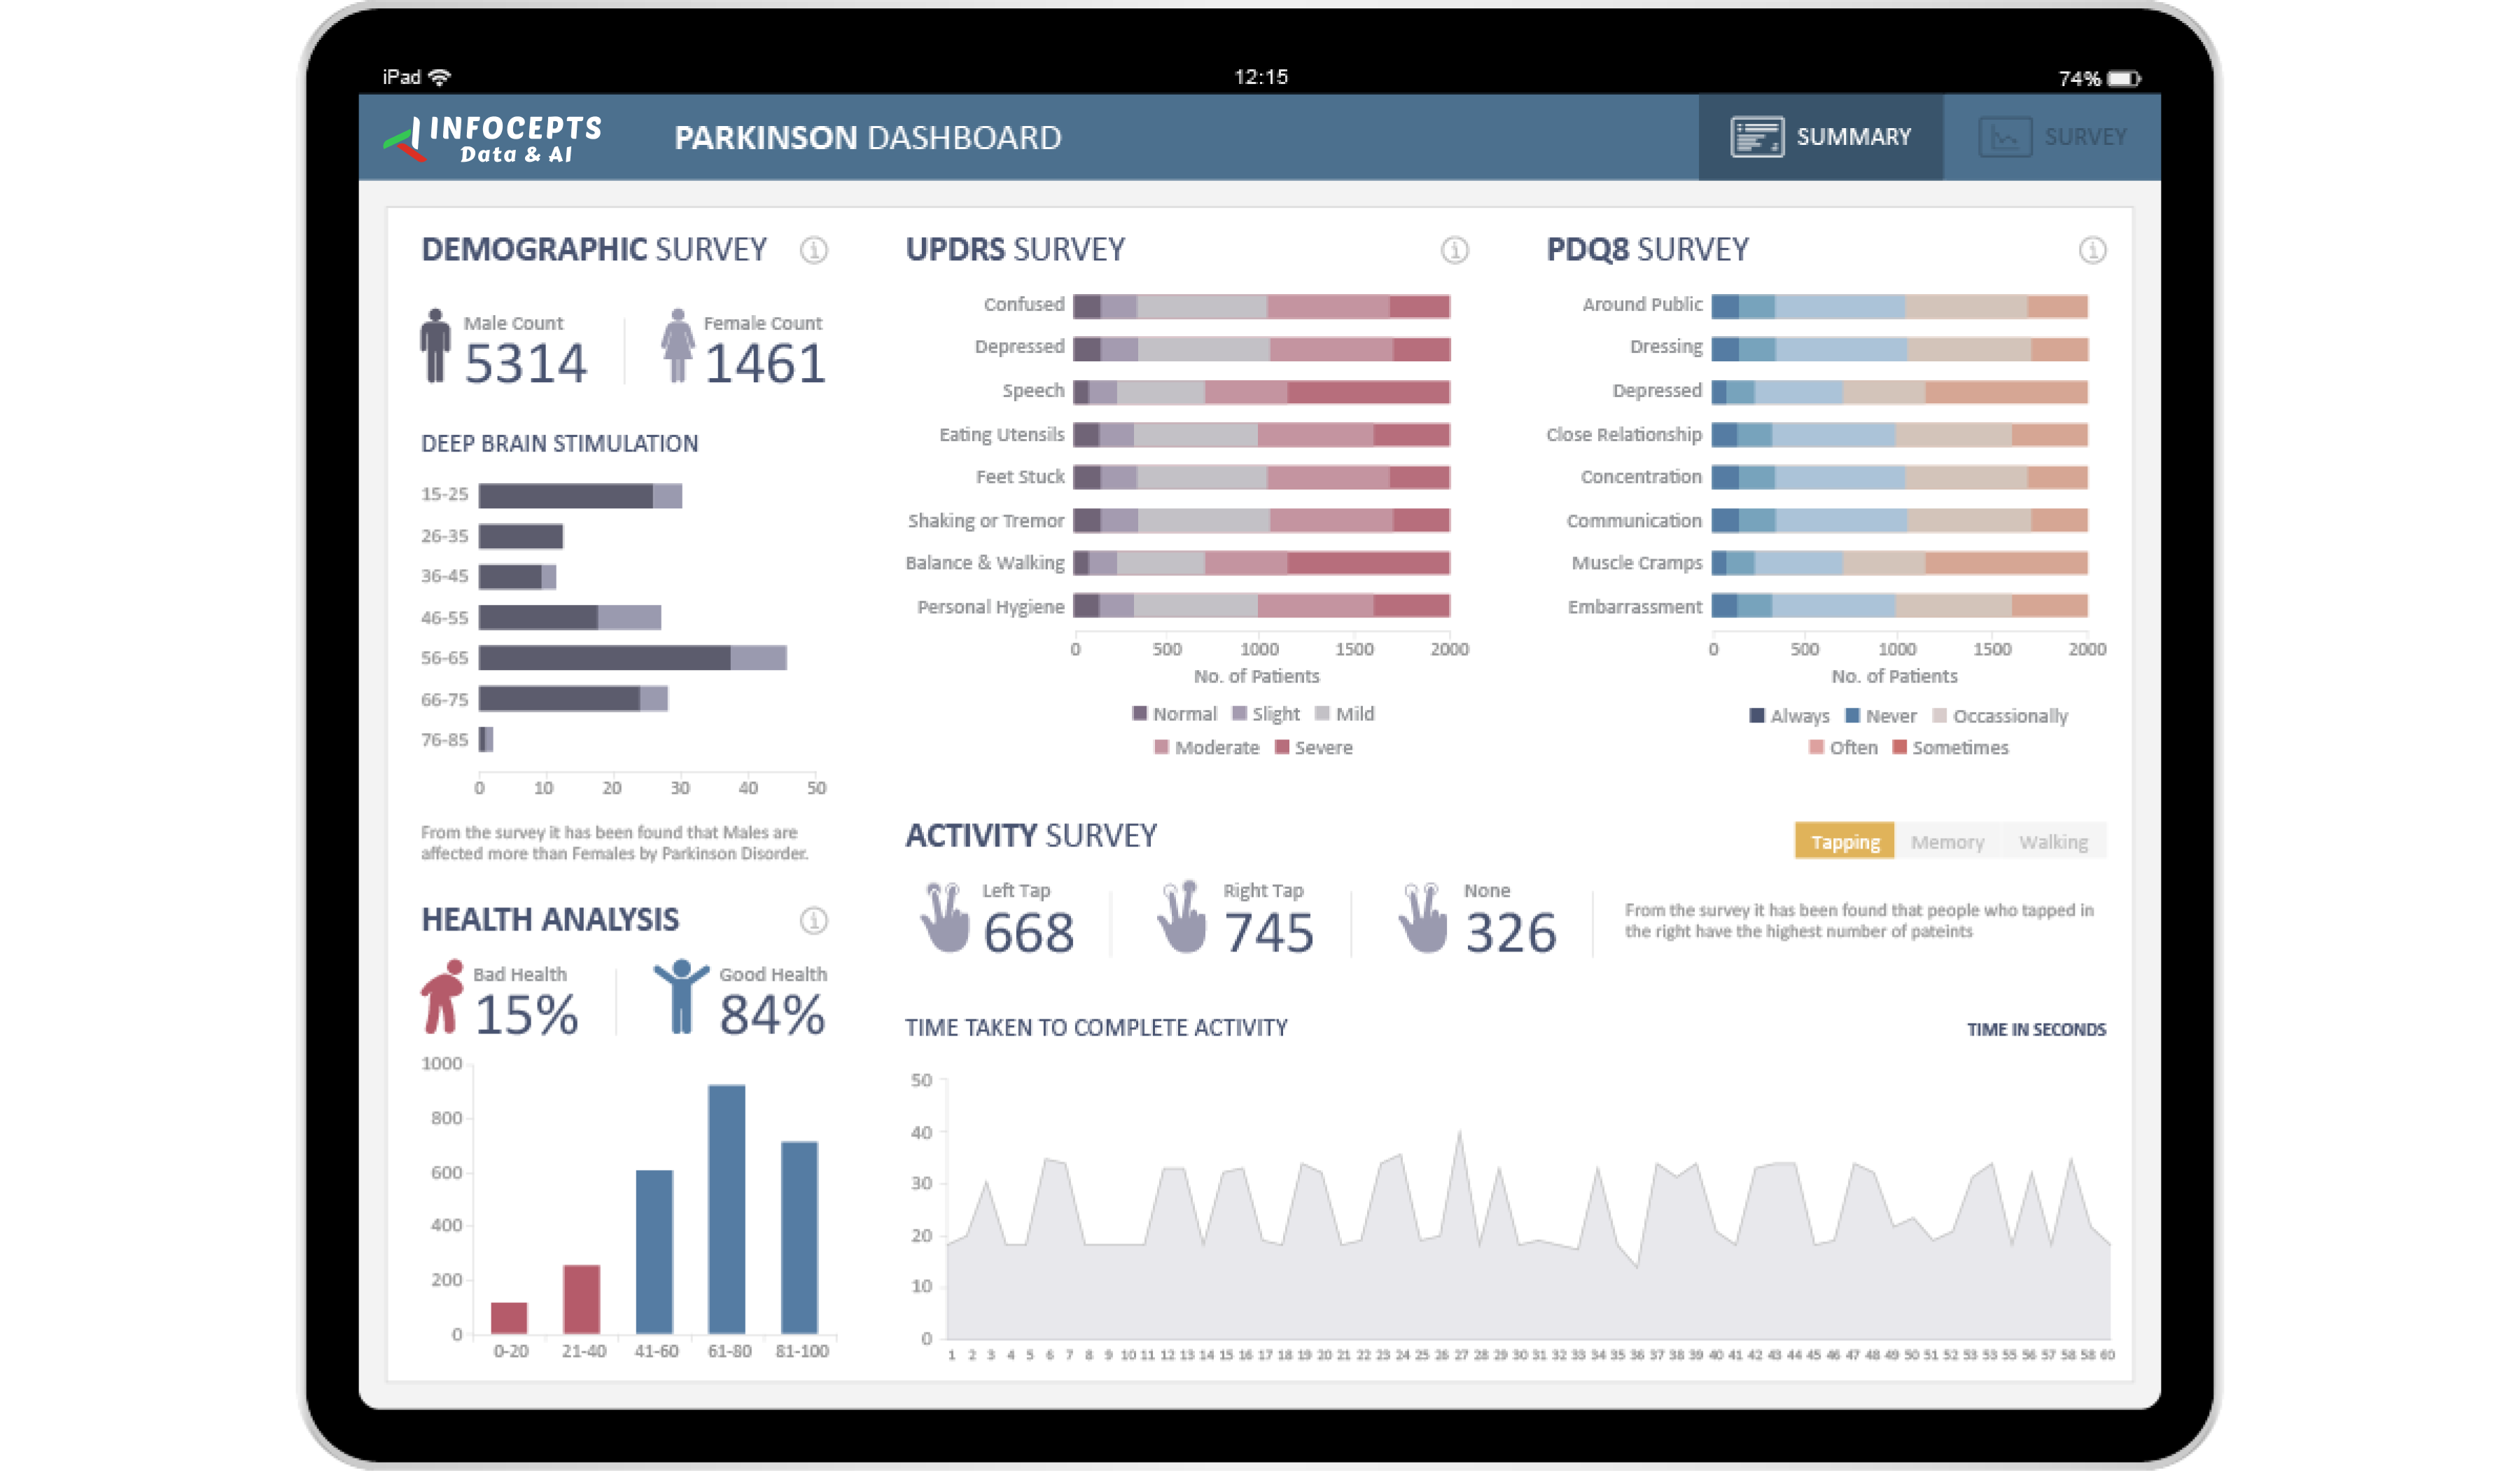
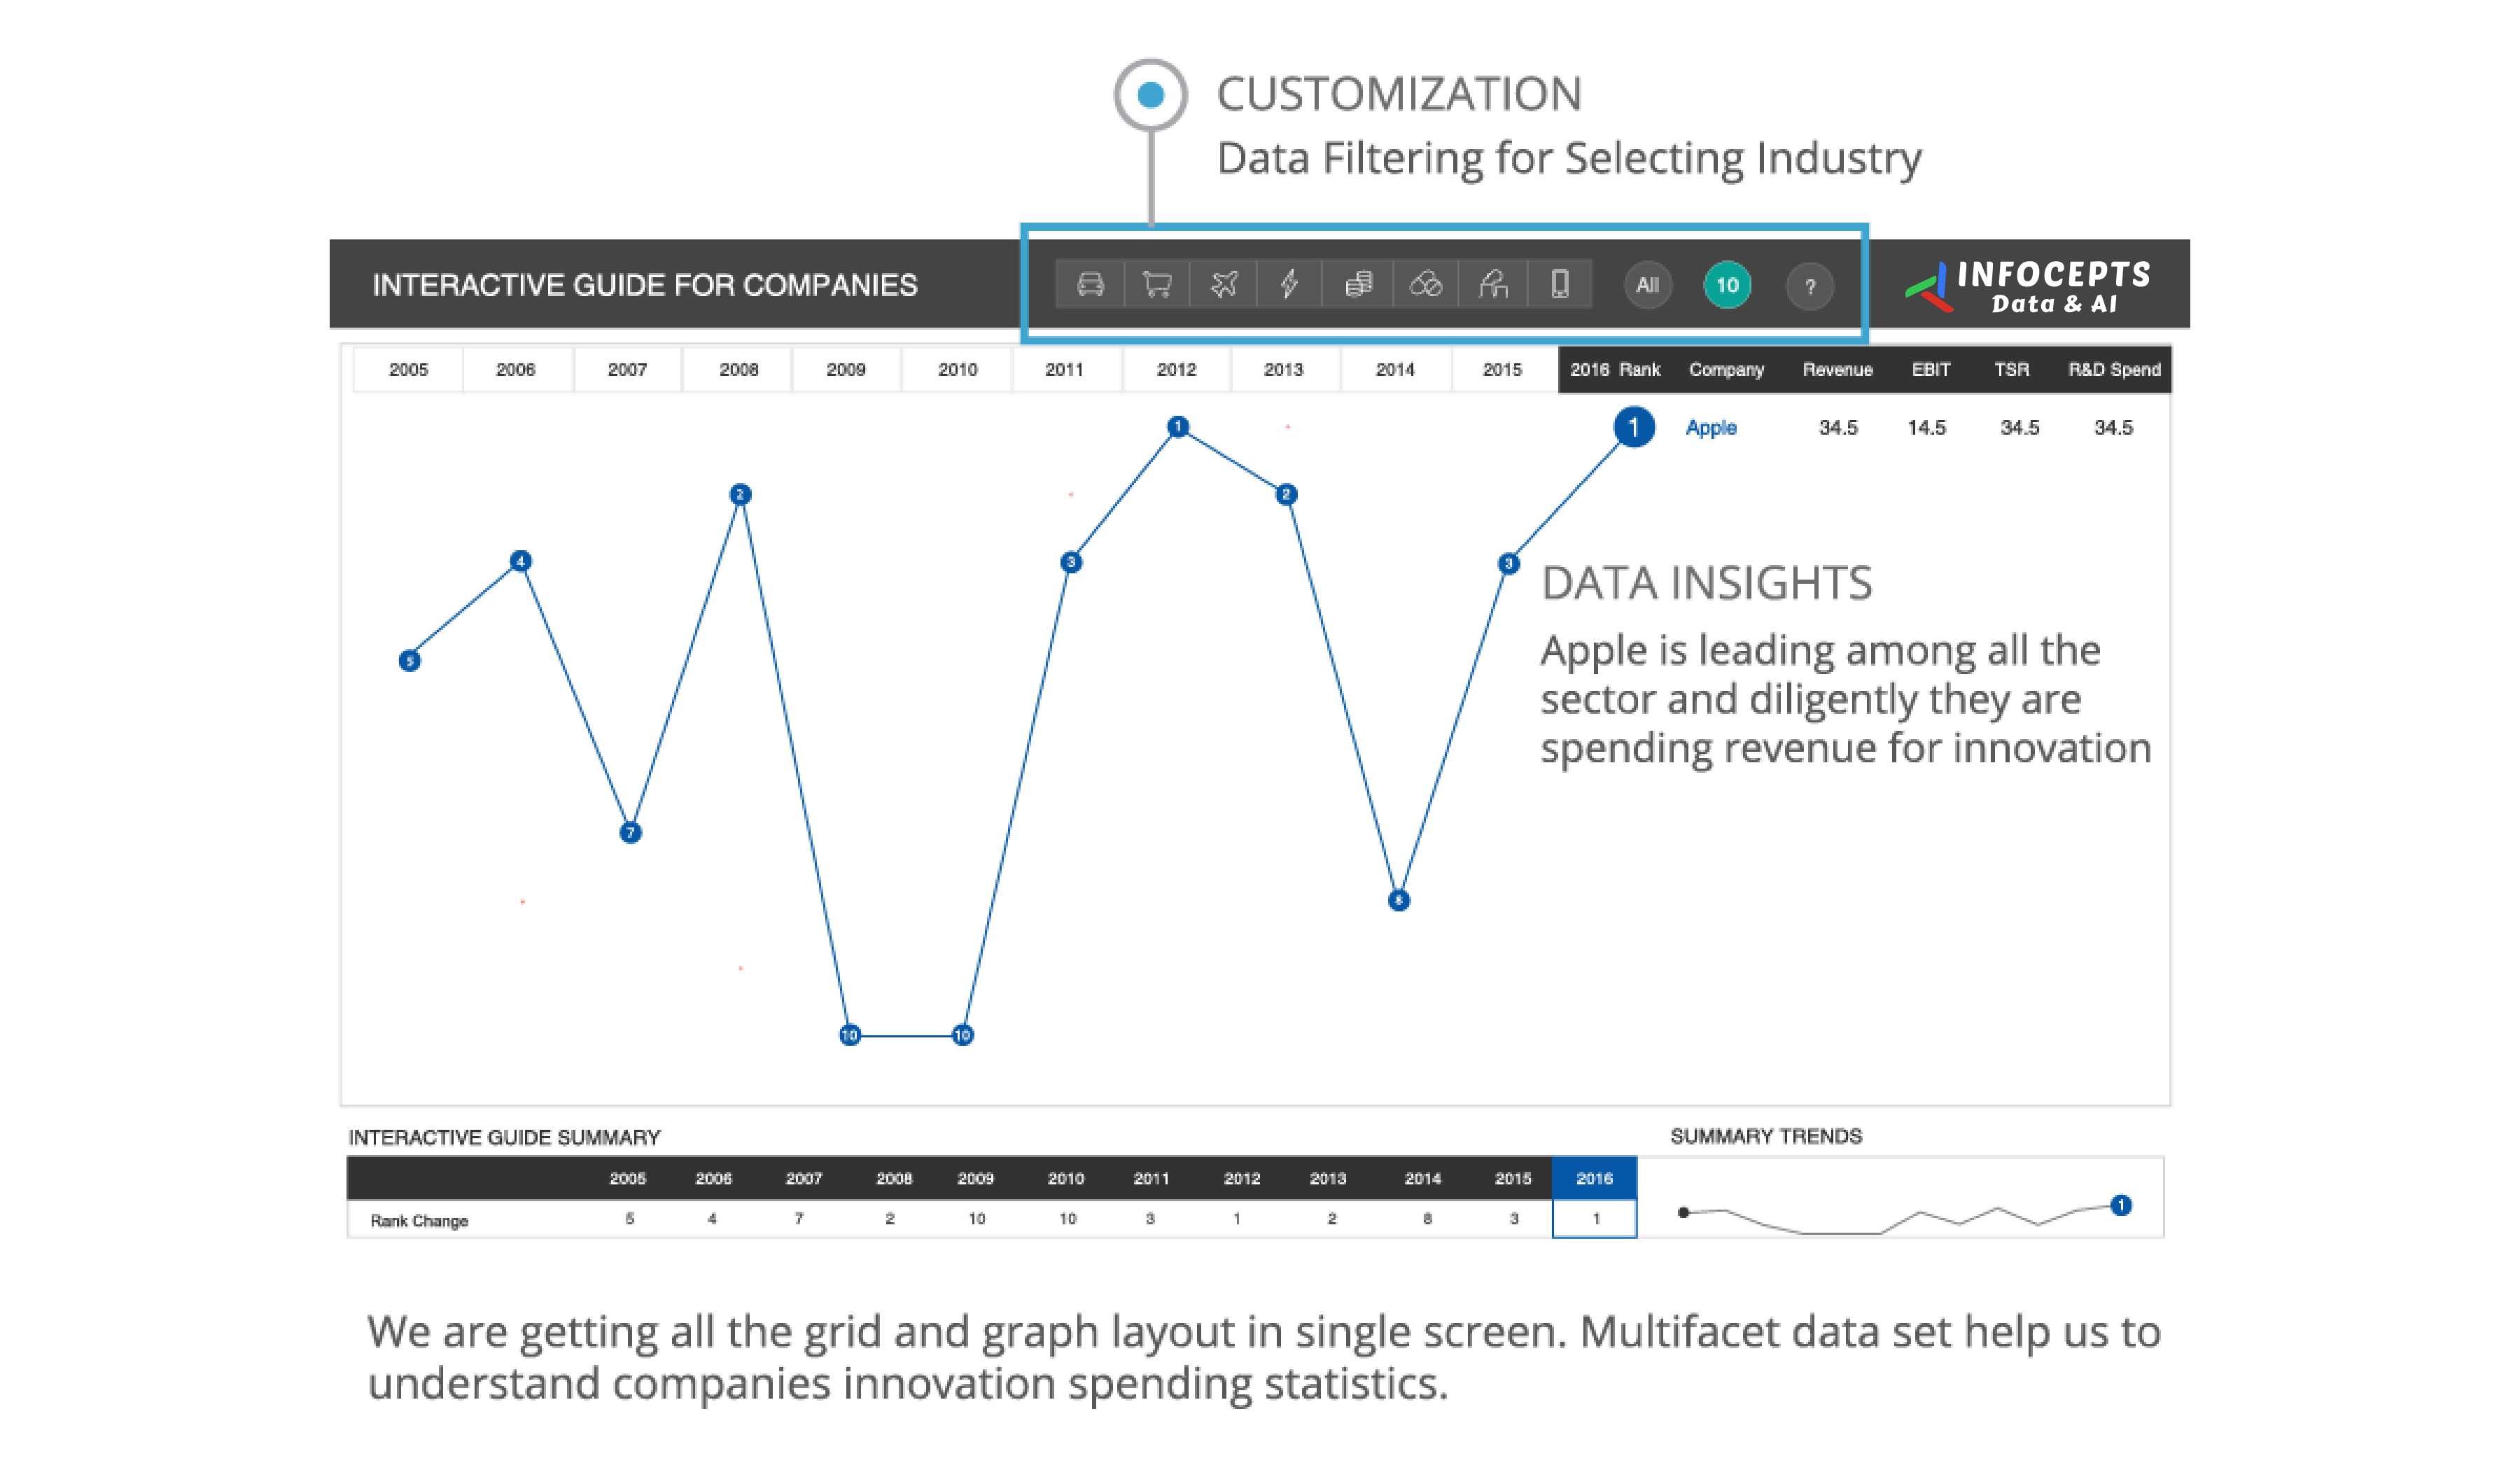
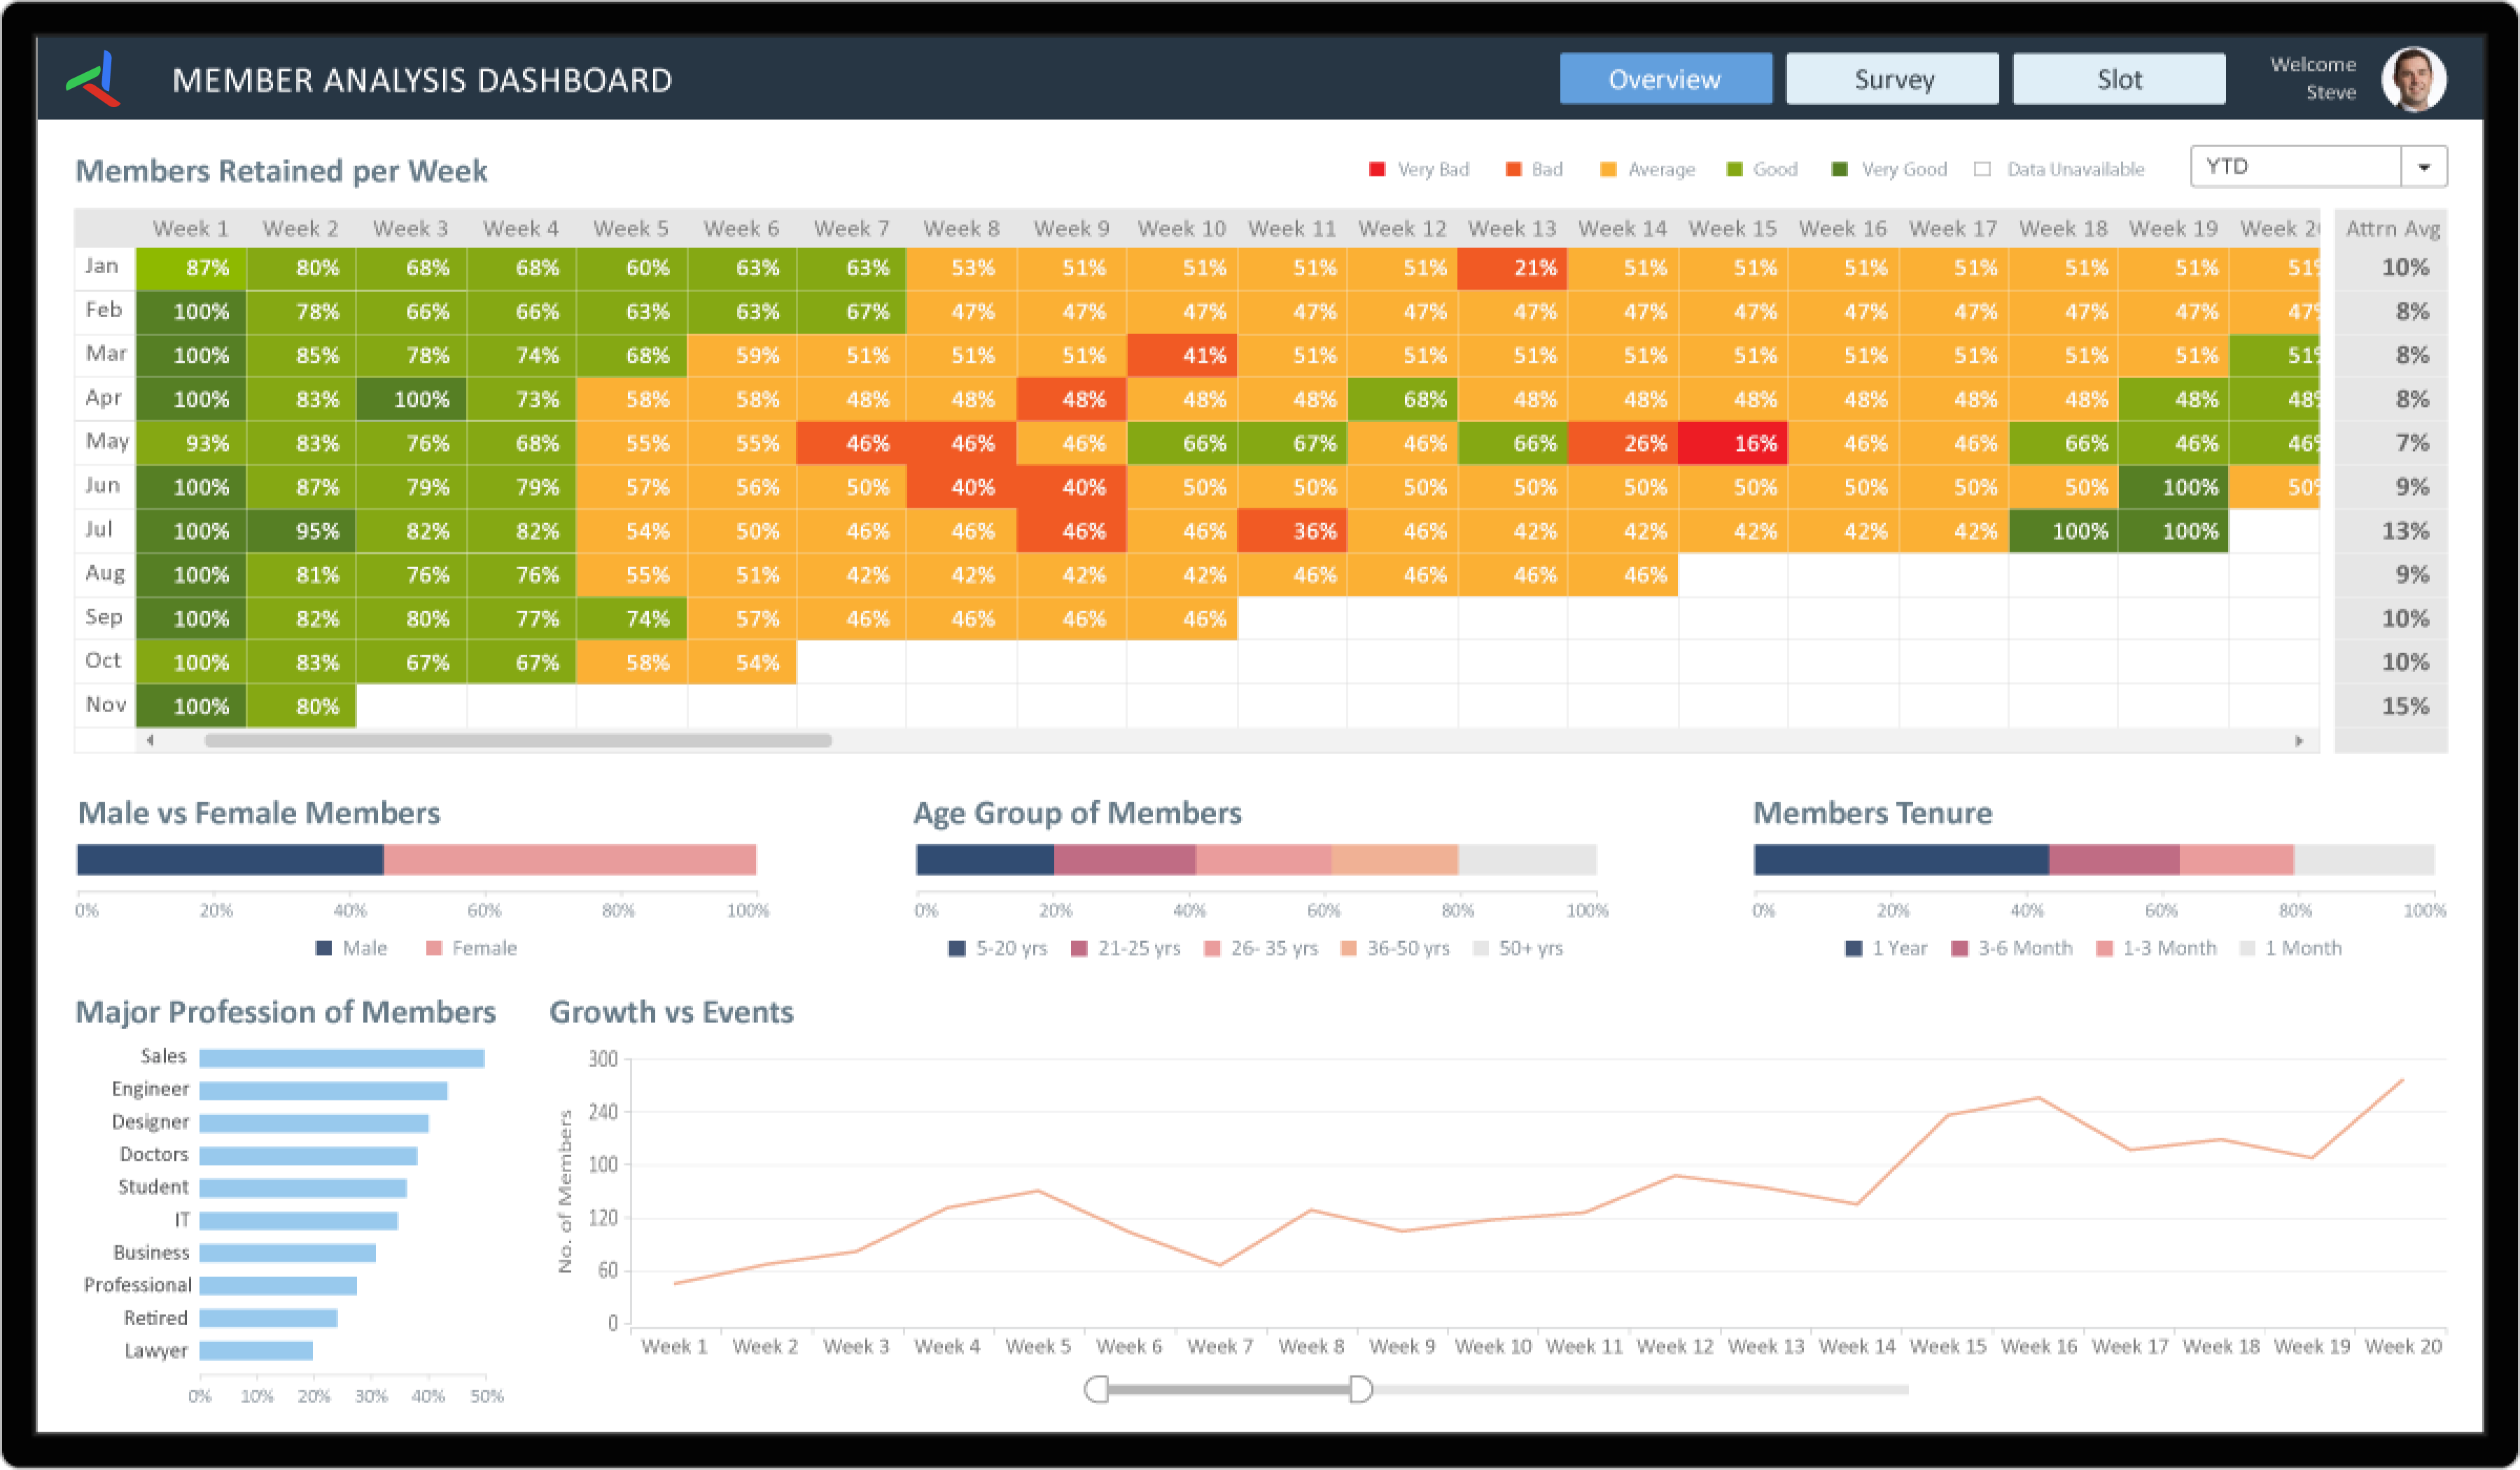
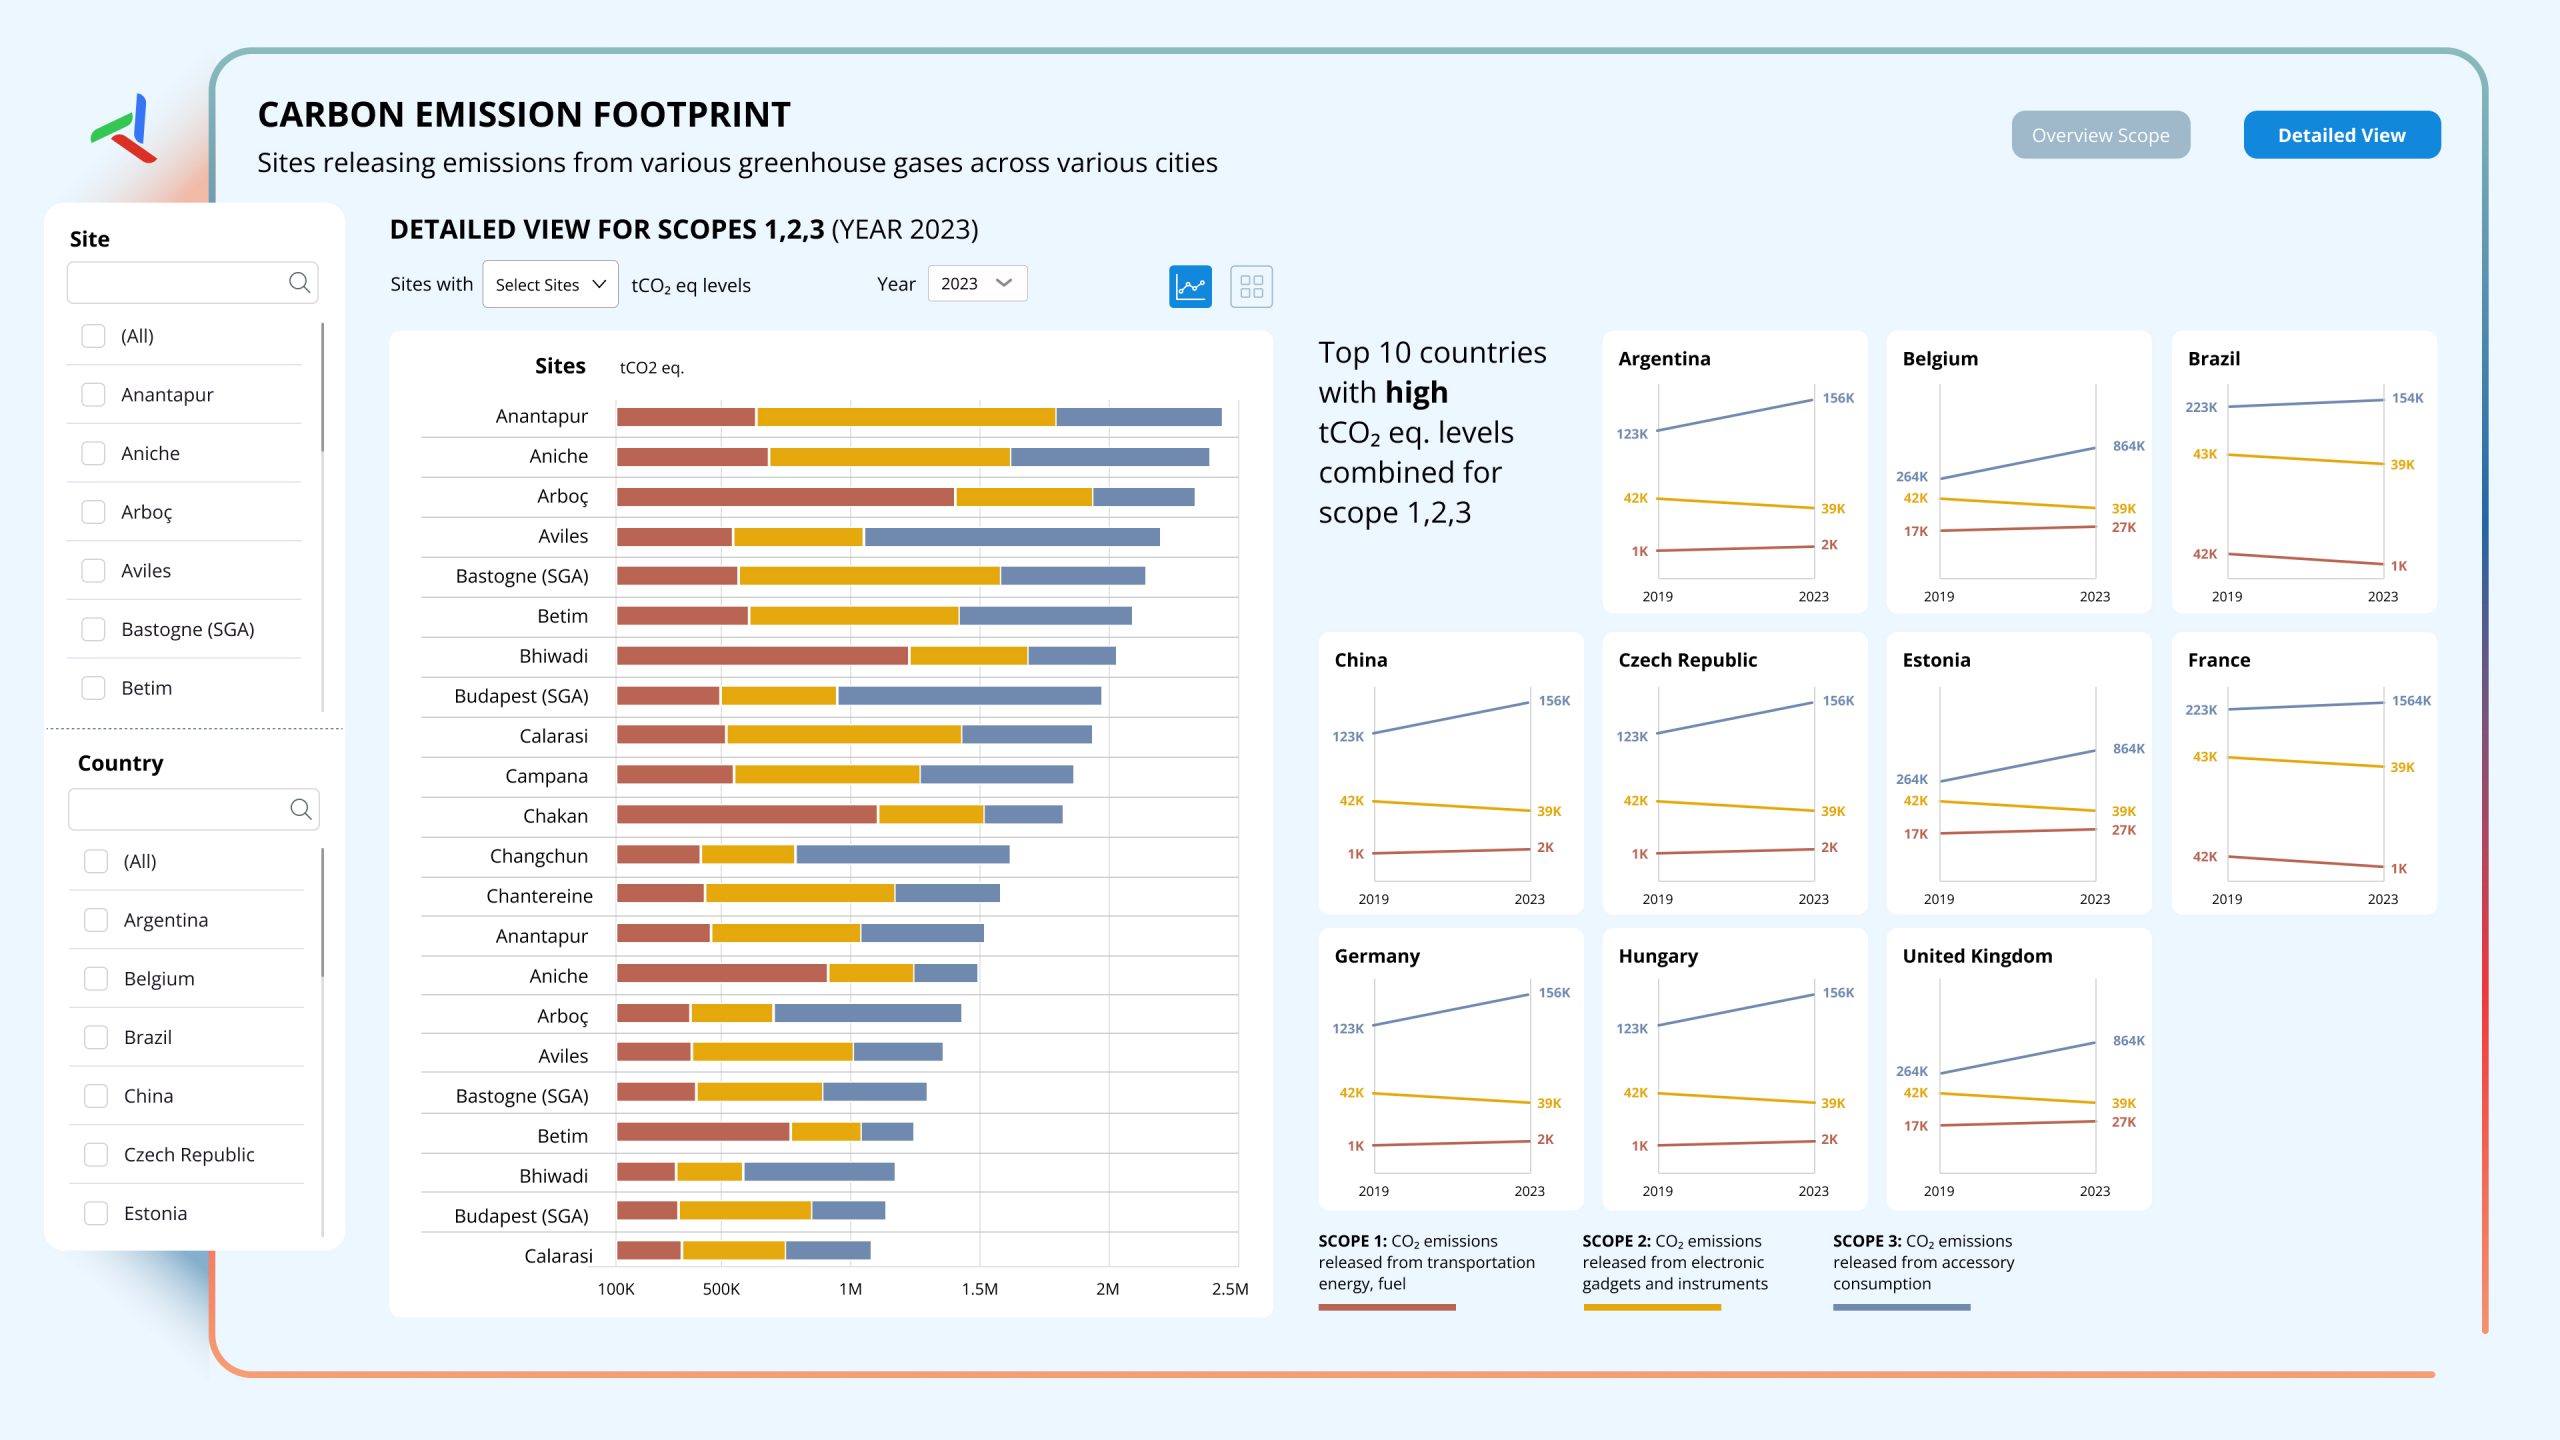
This dashboard tracks CO₂ emissions across multiple sites, providing real-time insights to identify major emission sources and monitor reduction efforts. It highlights key contributors by analyzing emissions data and trends, enabling businesses to measure progress toward sustainability goals. With clear visualizations and actionable insights, the dashboard promotes data-driven strategies to support environmental initiatives and achieve net-zero targets.
Frequently asked questions
It brings emissions, sustainability, and reduction-effort data across multiple sites into one real-time view, so environmental teams can track progress toward targets without reconciling separate site-level reports.
Emissions data is usually one of the core inputs into a broader ESG report; monitoring it continuously rather than compiling it once a year gives sustainability teams time to correct course before a reporting deadline.
Major emission sources and the sites or processes contributing most to the total, so reduction efforts can be targeted rather than applied evenly across the business.
Sustainability and ESG teams, along with the site or operations leaders whose facilities are being measured against reduction targets.
Yes. Trend views over time are what make a net-zero target measurable day to day, rather than only visible in an annual report.
By consolidating emissions and operational data from multiple sites through data modernization work, then presenting it through Business Analytics so sustainability teams see one consistent view.

 Pranali Lanjewar